A Report is a Designer Element used to collect, filter, and organize data. The data displayed on a report can be sourced from the System, Flows, Folders, integrated systems, and custom Data Structures.
Reports are created within the Decisions Studio using the Report Designer. This Designer provides a blank workspace for configuring the Report's Data Source, Data Fields, any desired Filters and View methods, and additional visual, style, and behavioral configurations.
The data from these Reports can be used in the following ways:
- Downloaded as a CSV file
- Converted into a PDF file
- Used as a Flow Step
- Embedded in a Page as a Report Viewer Control
Report Designer Features
The Report Designer is the Designer Studio responsible for the creation of Reports. It can be accessed by selecting the CREATE REPORT button on the Global Action Bar within a Designer Project and subsequently selecting Report.
Create
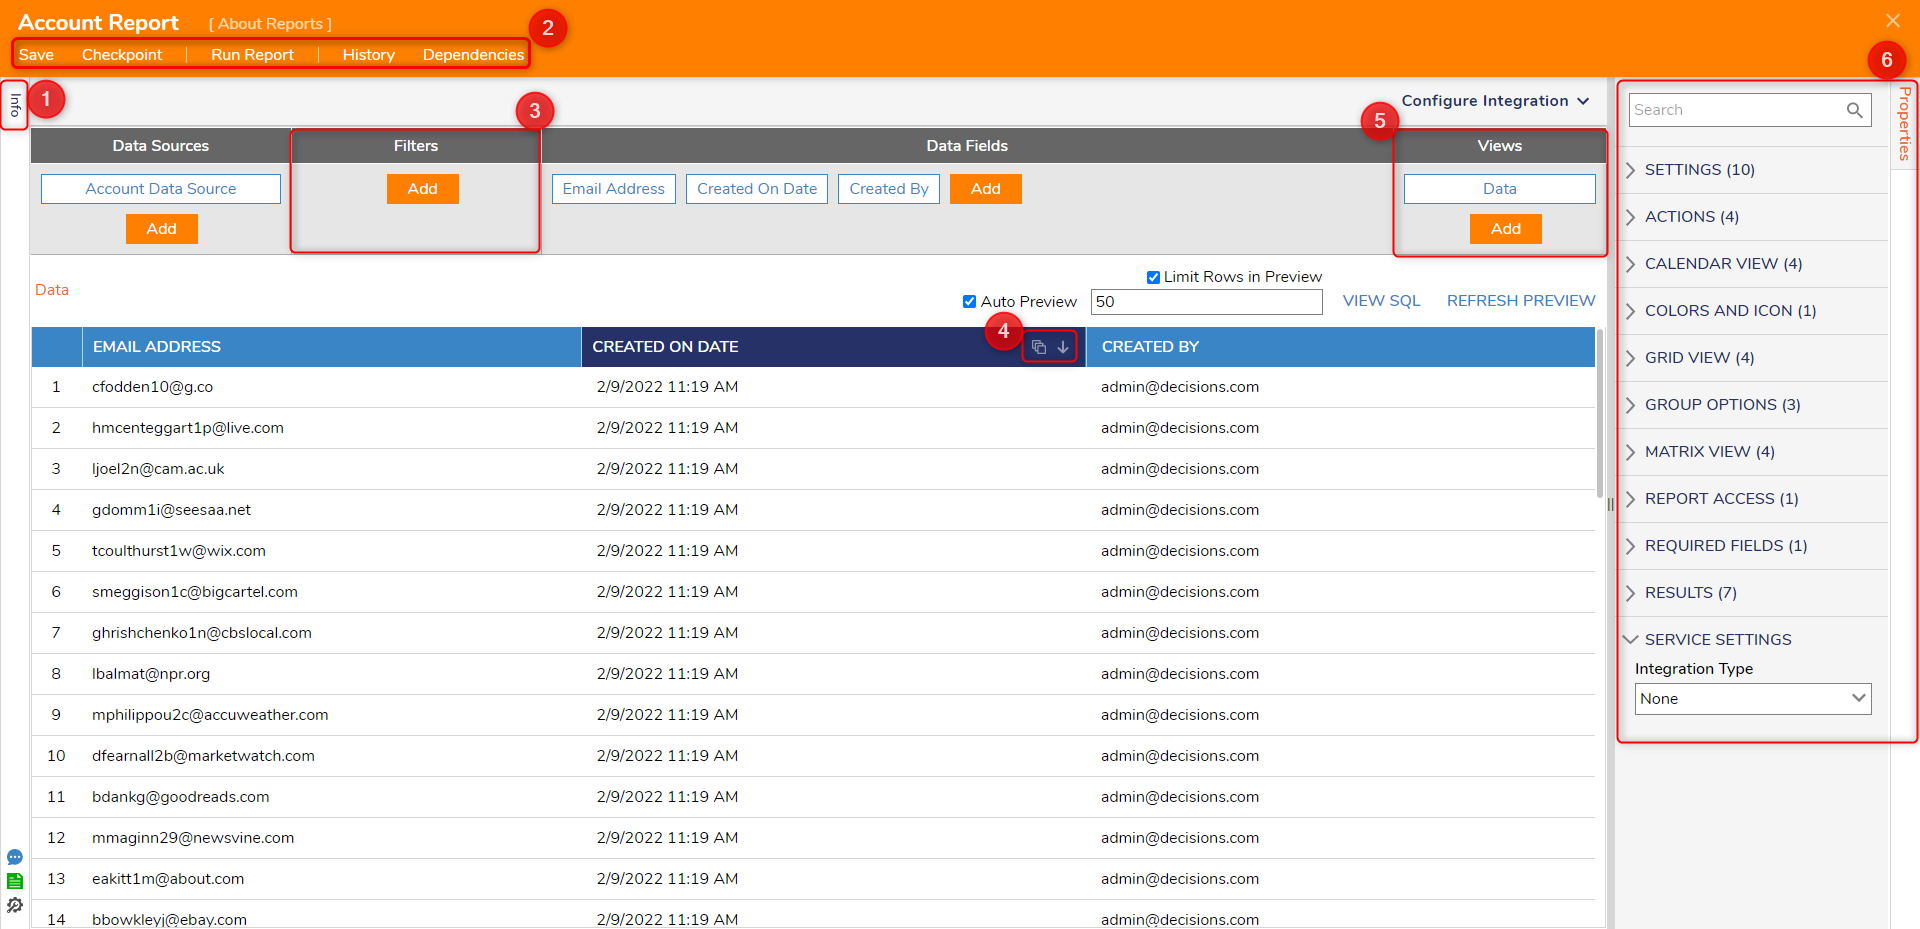
The primary method of creating Reports involves defining a Data Source and providing the desired Data Fields. Selecting the Add button allows adding each respective item/feature to the Report.
| Column | Function |
|---|---|
| Data Sources | Allows users to provide data for the Report. After configuring the remaining columns, the data is displayed on the Report. |
| Data Fields | Allows users to define which Data Field/Property of the Data Source is displayed on the Report. Note: at least one Data Field is required for the Report to display the Data Source. |
Configure
Once data has been defined via the Data panel, Reports can be further configured using the Properties tab and the Filters and Views panel. These features allow filtration of the populated data, options to display Charts about the data and provide additional methods of
| Feature | Function | |
|---|---|---|
| Info | This tab allows identification info for the Report, such as its Name, Description, and Owner, and provides details on the Report's creation/modification. Additionally, this tab can add Tags, Comments, and Files to the Report. | |
| Top Action Bar | ||
| Save | Saves the Report without closing the Designer. This action includes a window to write notes for the current Save State if needed. | |
| Close (X) | Closes the Report Designer; upon Close, users are provided the option to Save and provide Notes. | |
| Checkpoint | Creates a Backup point for the Report at the point where the Checkpoint action is enacted, then stores it in the History Folder. This can be useful when making drastic changes that could affect the contents or design of the Report. | |
| Run Report | Runs the Report in a new window. The Report will display as expected upon Runtime within a Page or Flow. | |
| History | Displays the History and Documentation page for the Report. Displays each saved version of the Report and allows user; users can use this list of versions to Restore desired versions of the Report. | |
| Dependencies | Offers a breakdown of which Designer Elements the Page depends on and which Elements rely on the Page. | |
| Filters | Filters out data based on specific fields. Such Filters include Rule Filters, Date Range Filters, Folder location Filters, and more. | |
| Column Settings | Allows adjustment of how the Report is organized. The group icon will apply or remove grouping to that column. The arrow icon will adjust if the column is sorted ascending or descending. Column headers can be dragged and dropped to set the display order. | |
| Views | Allows users to display the data on the Report in alternate layouts. These include Matrix, Row Summary, Rich Text, Layout Based View, Calendar, Tiles, Hierarchical view, Columns view, and Chart view for Grouped Reports. | |
| Properties | Provides additional configurations that affect how the data is displayed and used within the Report. | |

Implement
Reports can be displayed on a Page/Dashboard through a Report Viewer, applied to a Folder to display information, or used as a step within a Flow to manipulate data.
Output
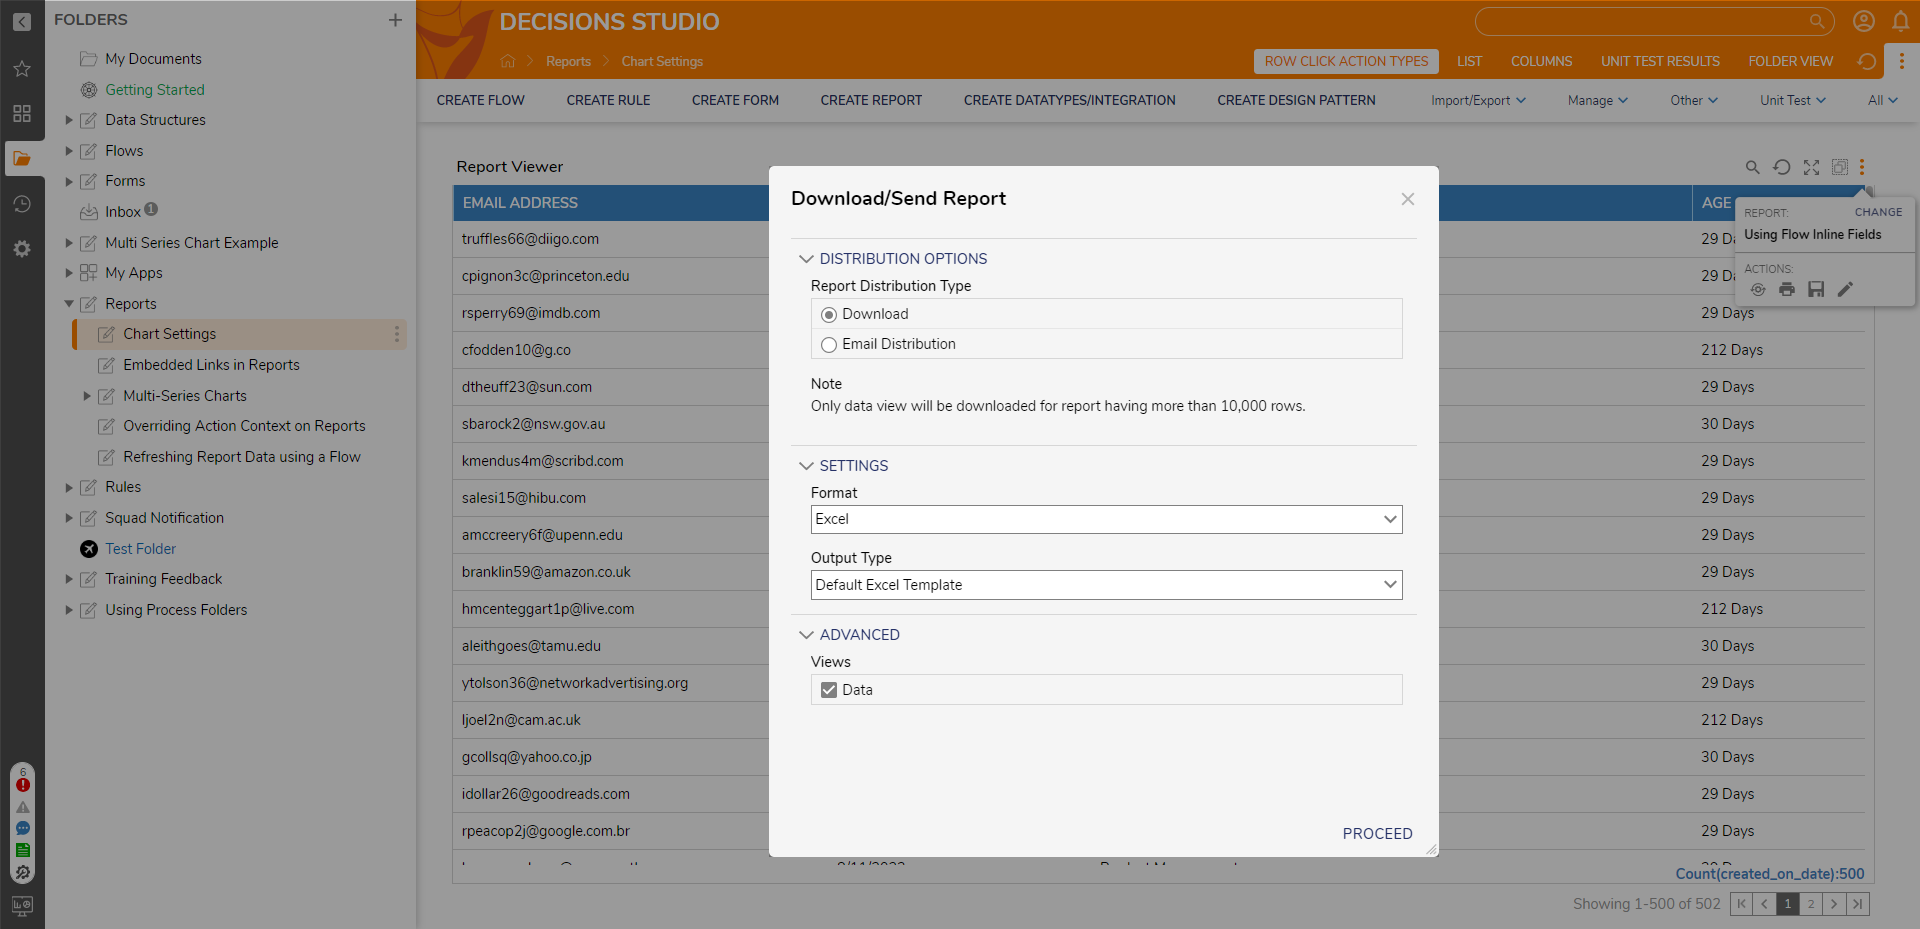
After a Report has been created and configured as desired, it can be Downloaded/Exported as a .decobj for use in other Decisions-based environments, as a Pdf, or in Excel format.
Additional features, such as Report Output Templates and Report Output Handler Flows, can define how the Report is saved and displayed in the chosen file format.
.png)