Overview
Configuring options for the Report Viewer gives a user the flexibility to set the component's behavior and appearance on a portal page. Options include changing the appearance of buttons and filters, enabling group actions, setting a default Report, and more.
Example
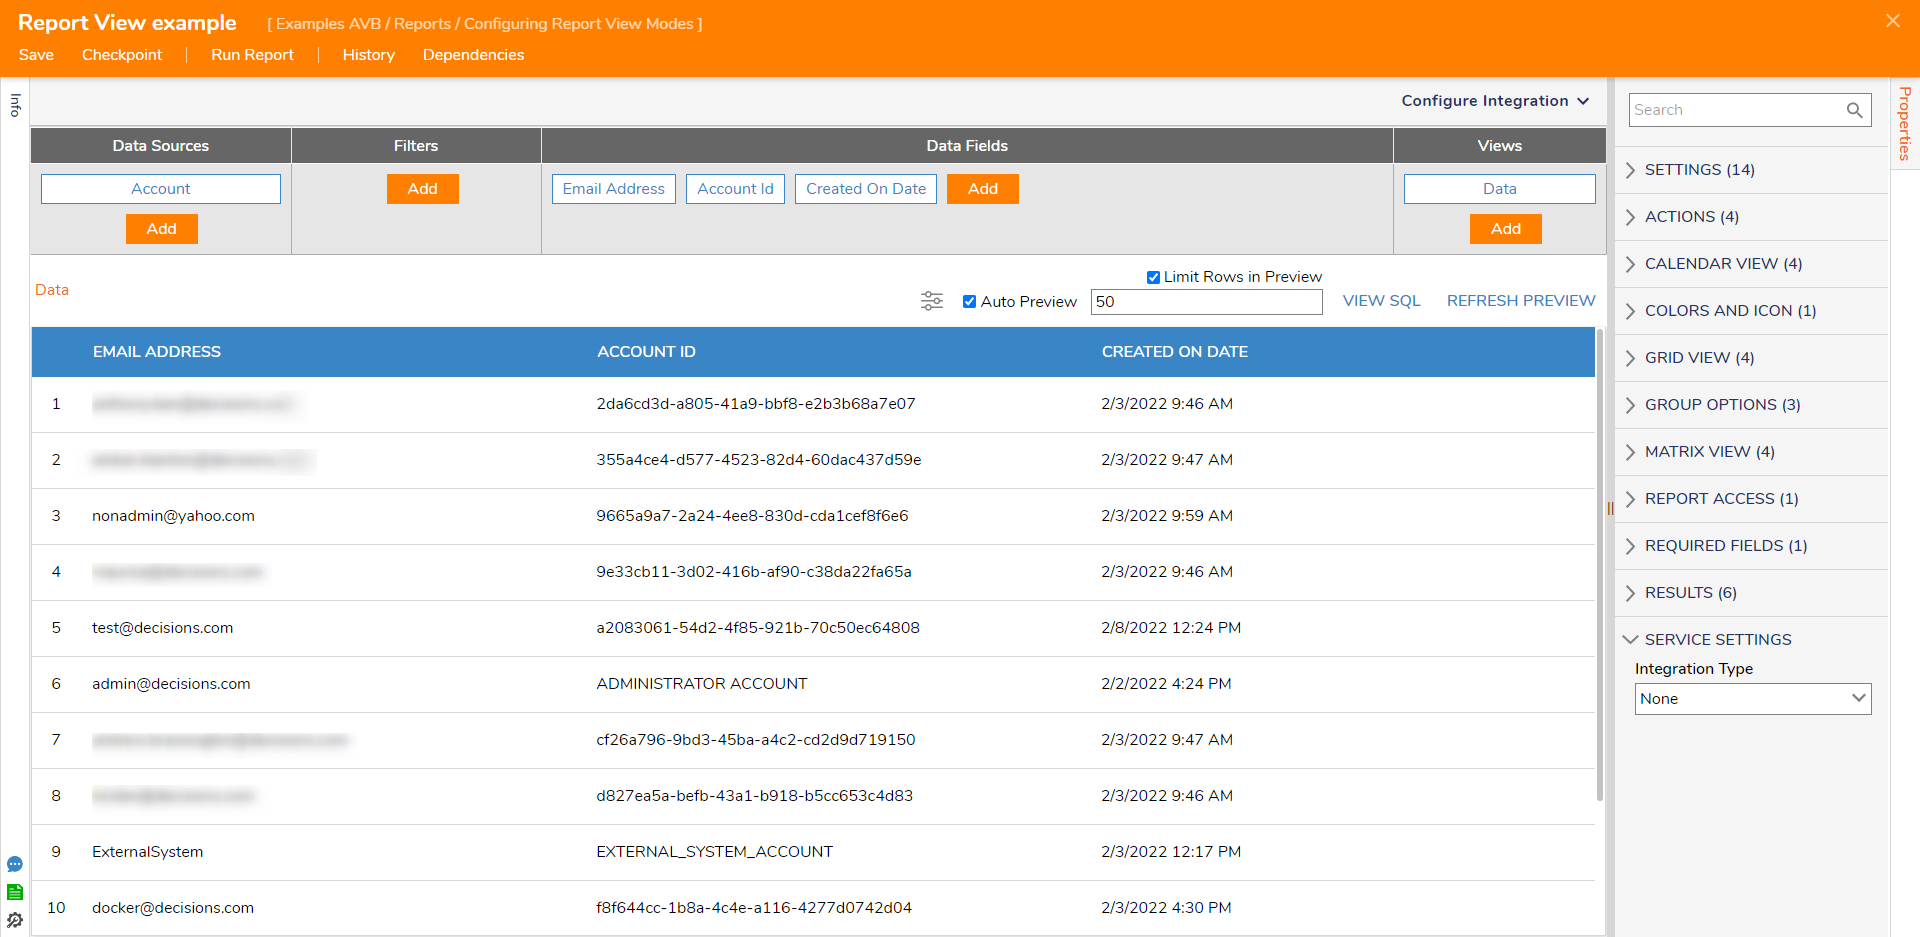
In this example, a Report has been created to serve as a basis to demonstrate the different Report Views.
- In the Report Designer, add Accounts as the Data Source then Email Address and Created on Date as the Data Fields.
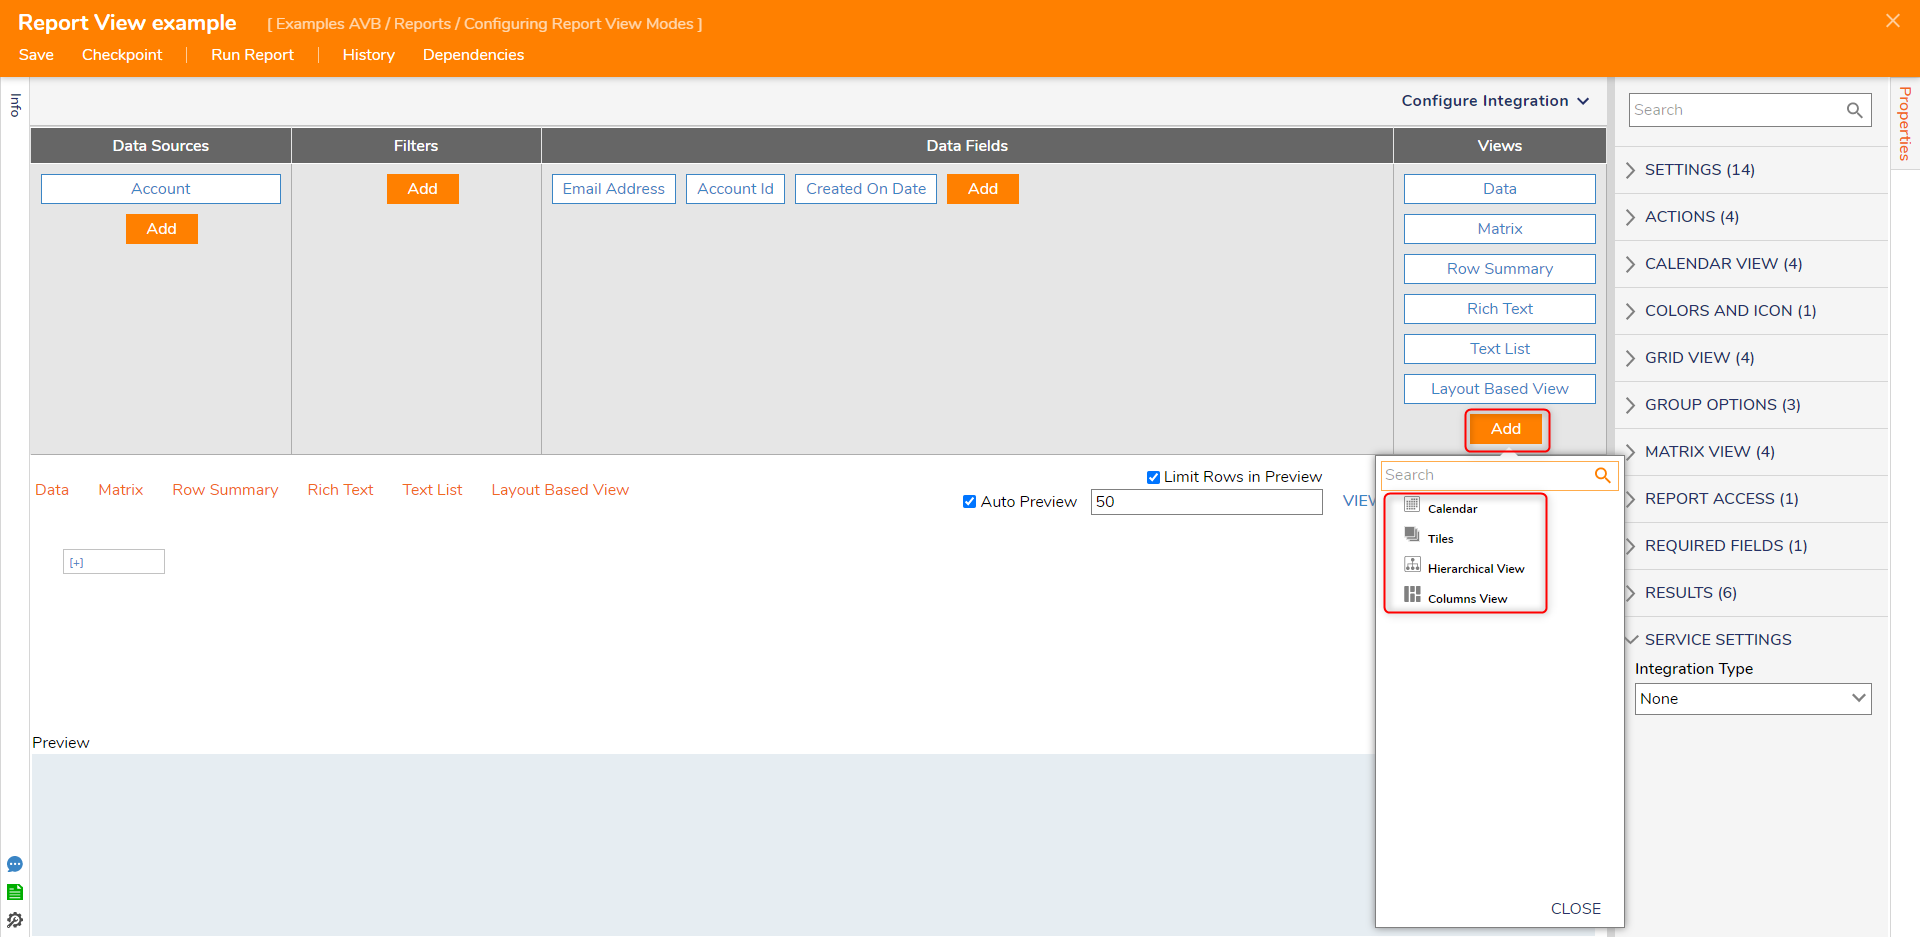
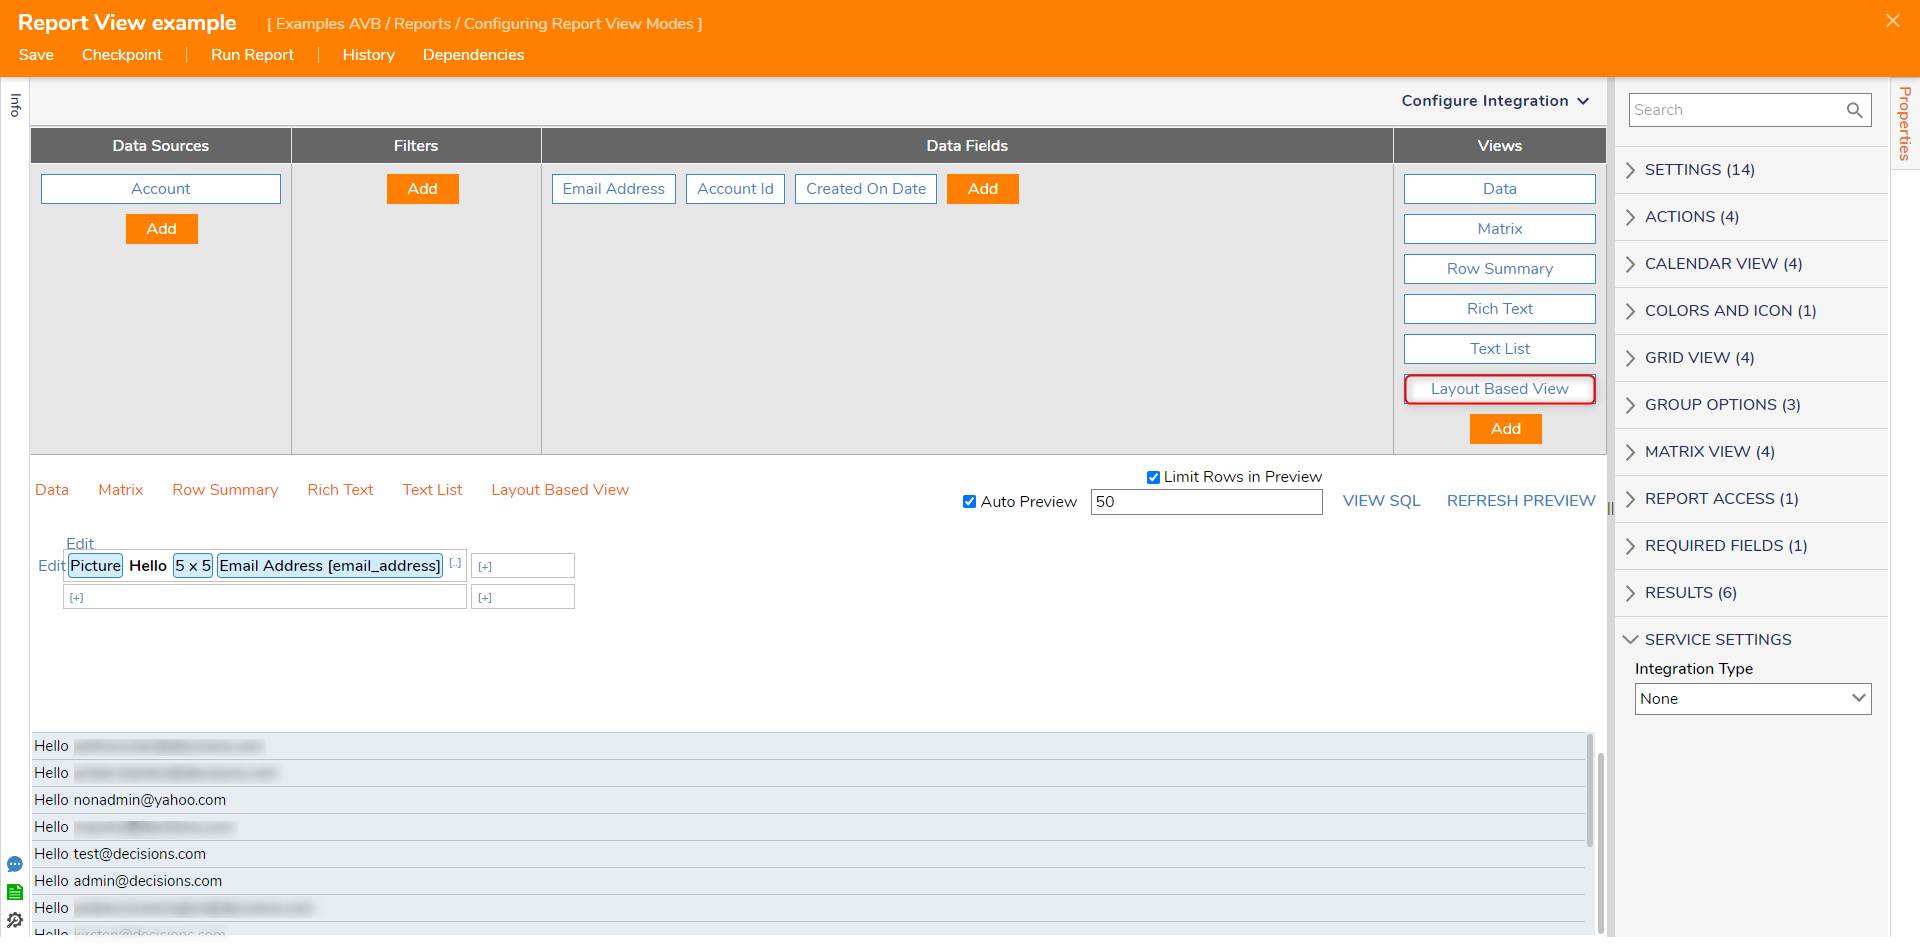
- Under Views, click Add to add different view modes. In this example, add Matrix, Layout Based, and Calendar views. Once the views are added, select them to configure what data they will display in the report.
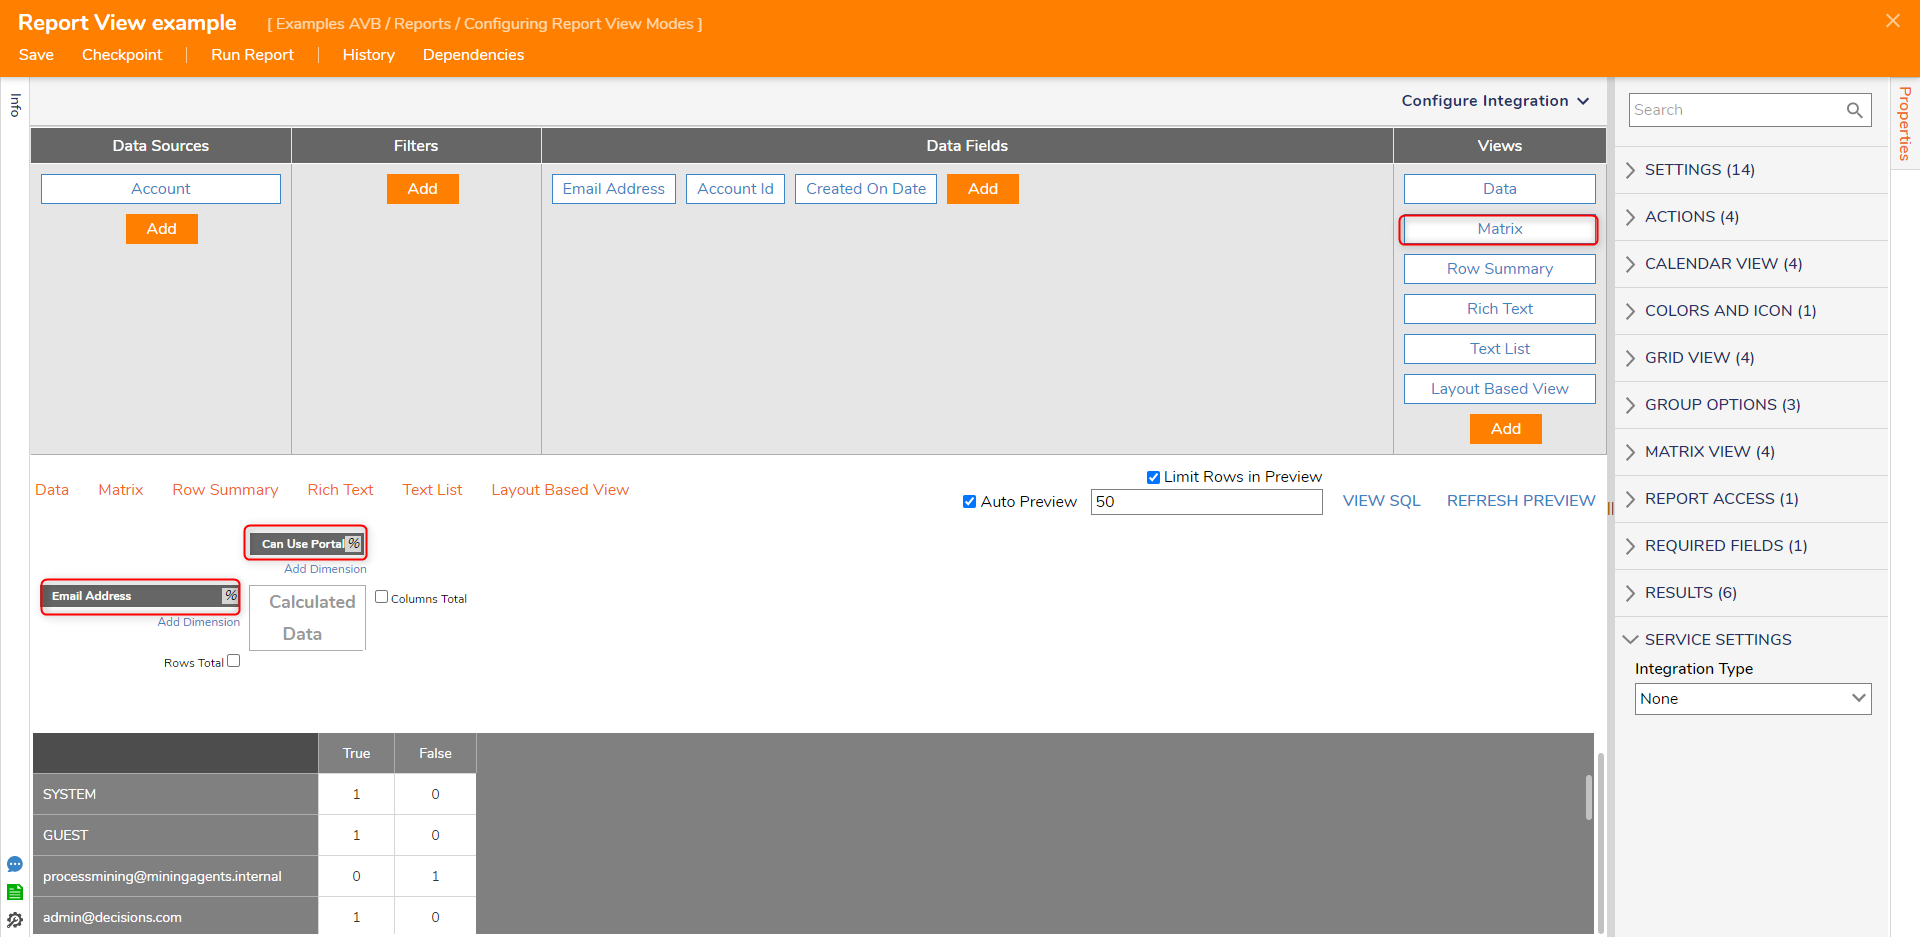
Matrix View
The Matrix view is configured to display email addresses and if the user can use the Portal.
Layout Based View
The Layout Based view is displaying email addresses, first and last name, and what time zone that user is in. Icons were also added.
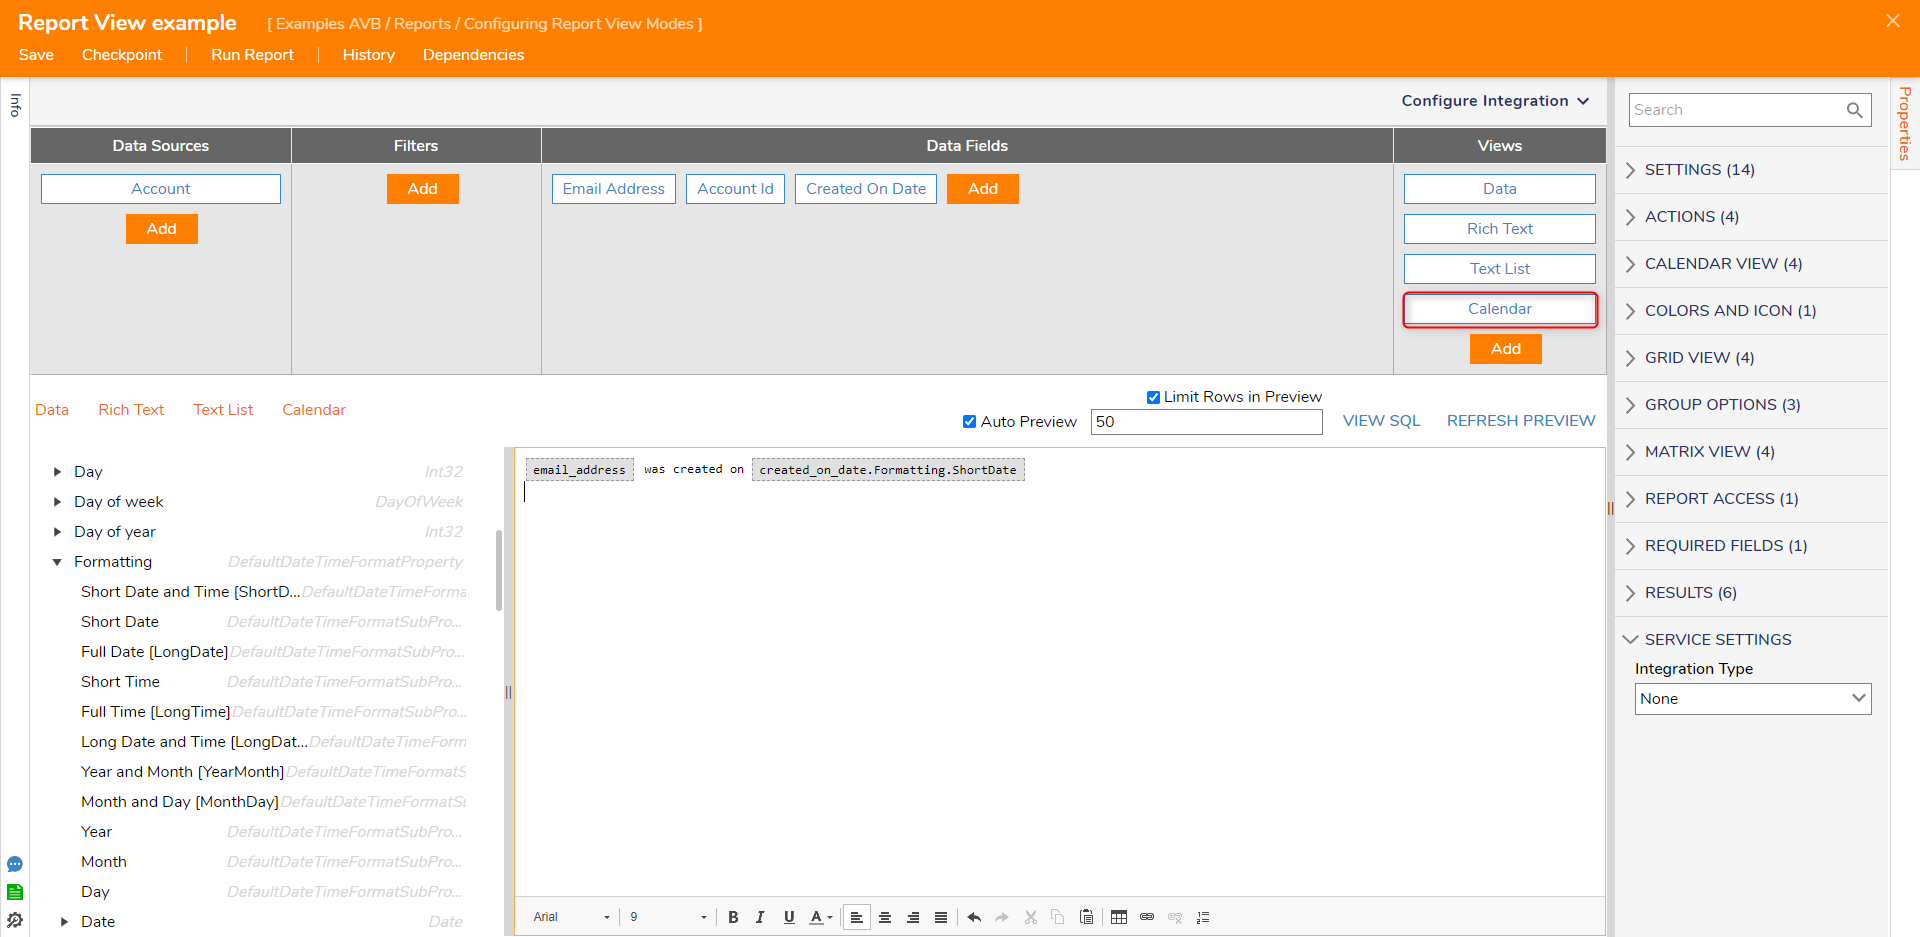
Calendar View
The Calendar view uses a Merge Text Editor to display a dynamic statement on a date. This view is configured to show what email address was created on which day.
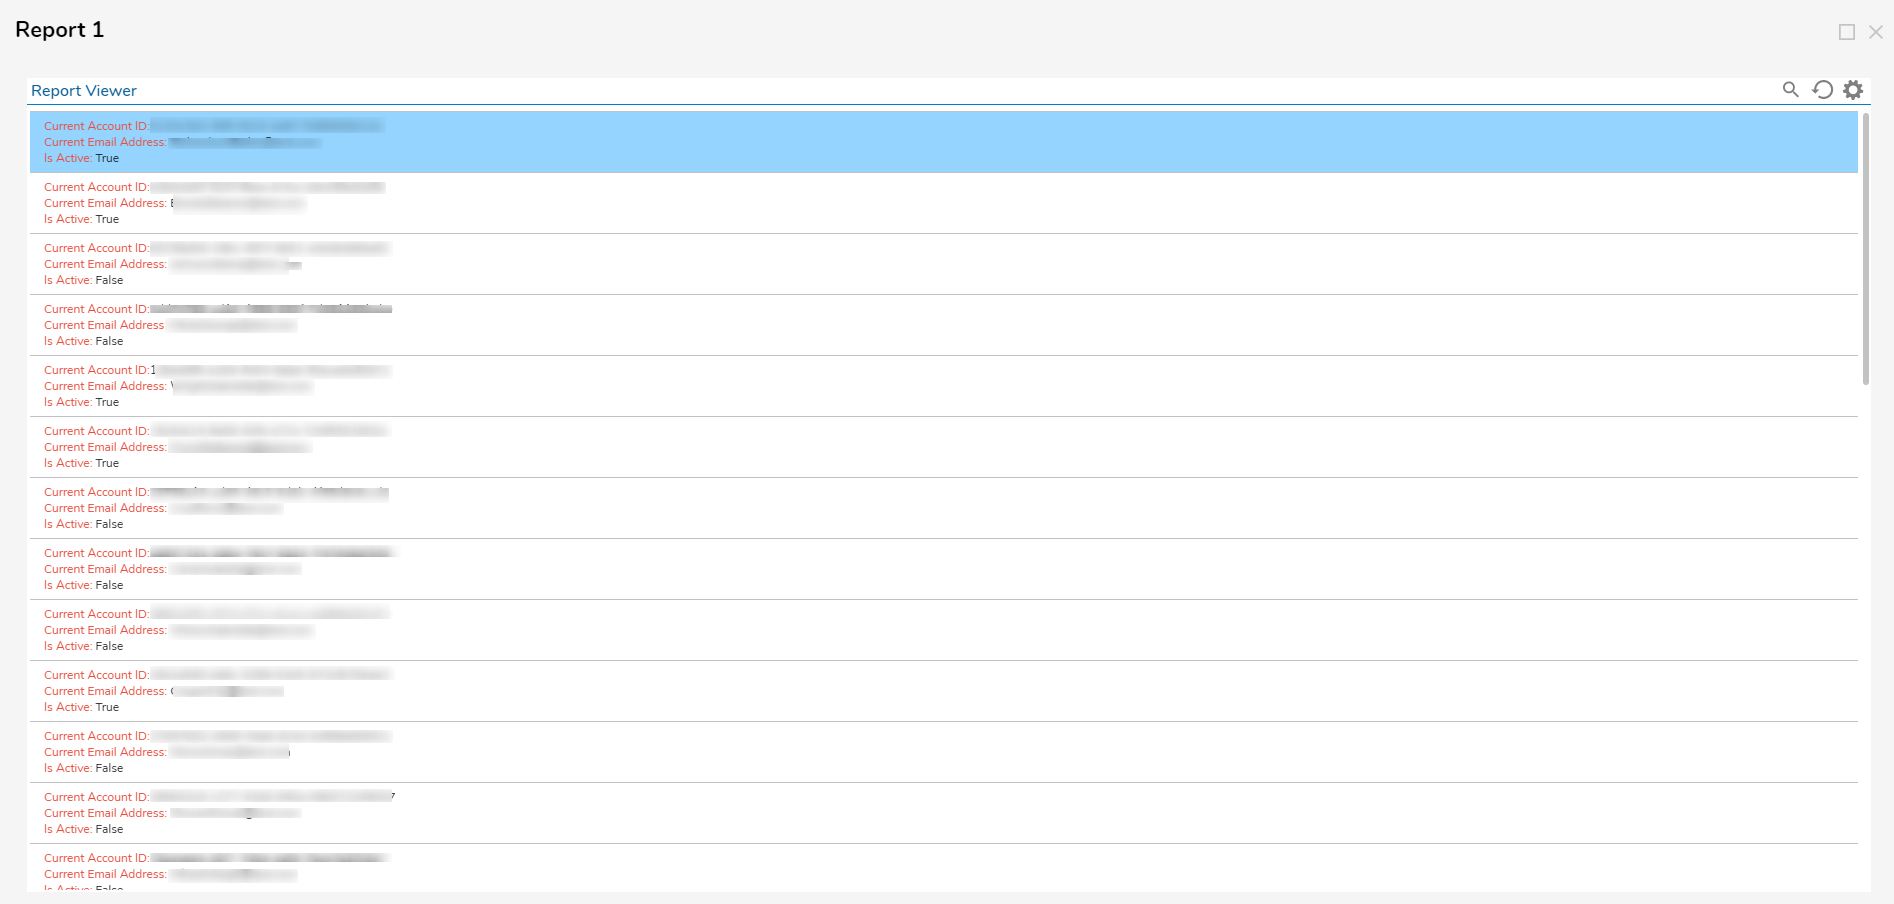
 Row Summary
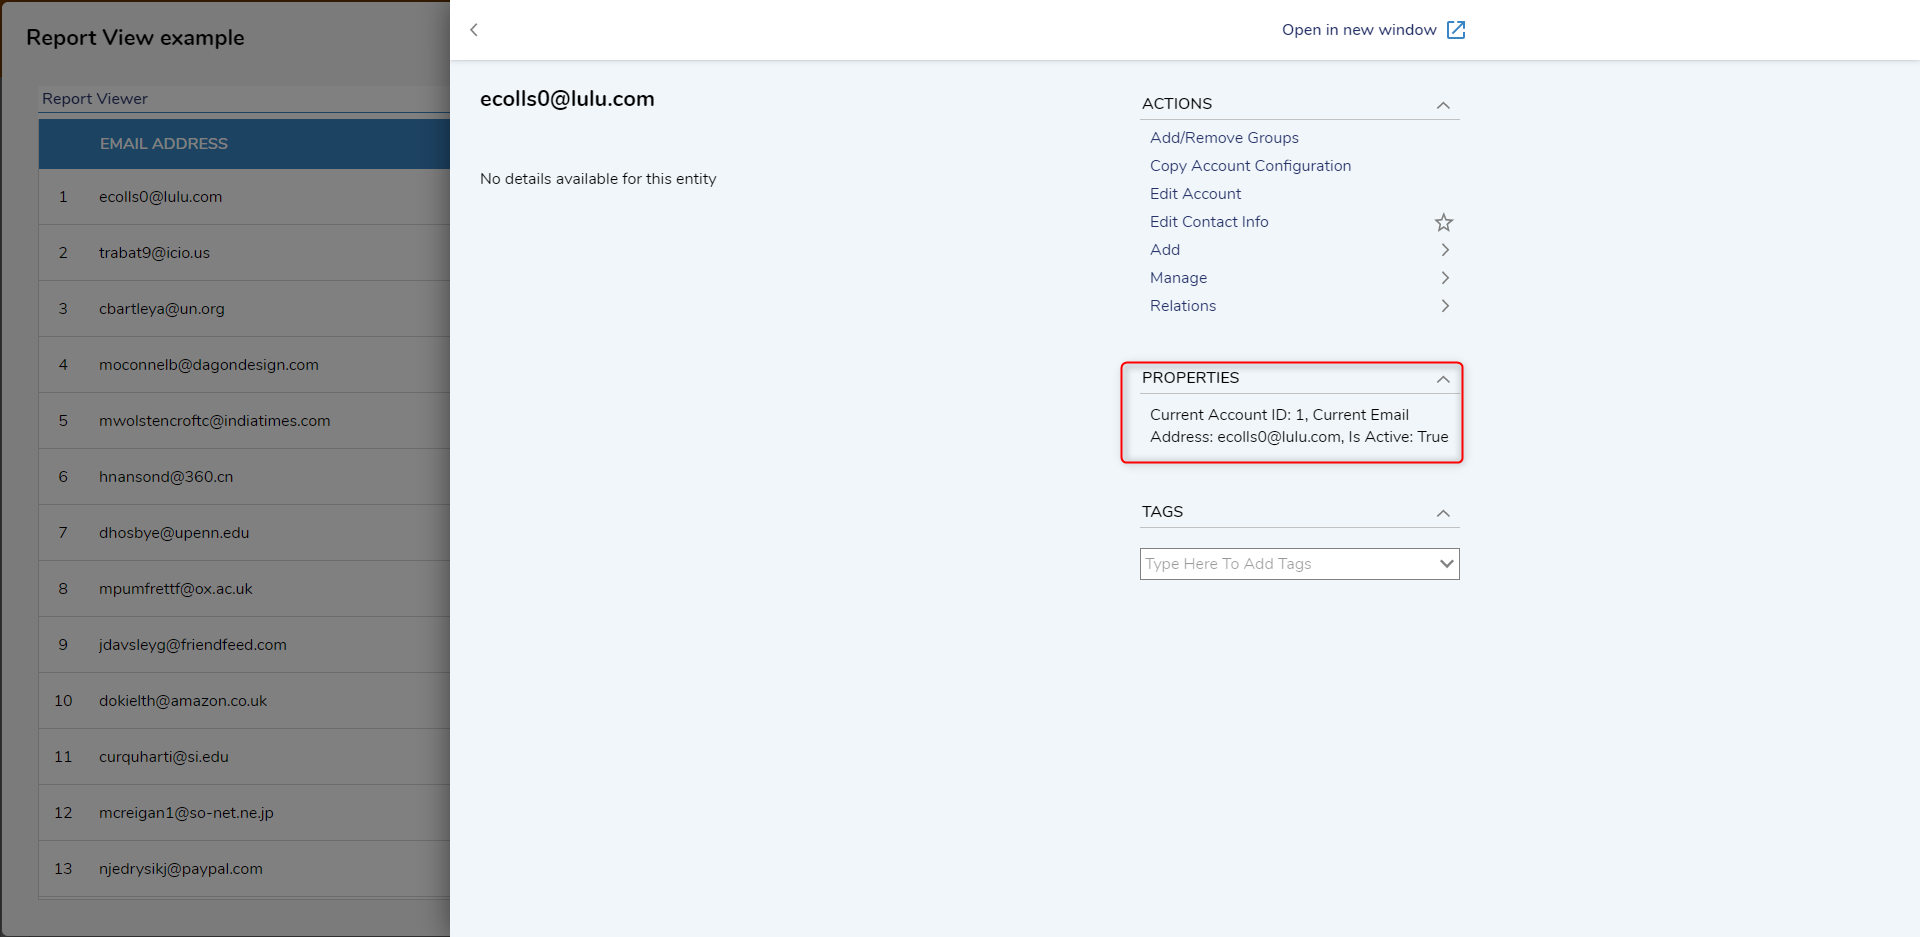
Row Summary allows the user to create a custom description that can be applied to every row. This is displayed in the Properties section when a row is selected. The below example displays the AccountID, Email Address, and is_active fields for an Account.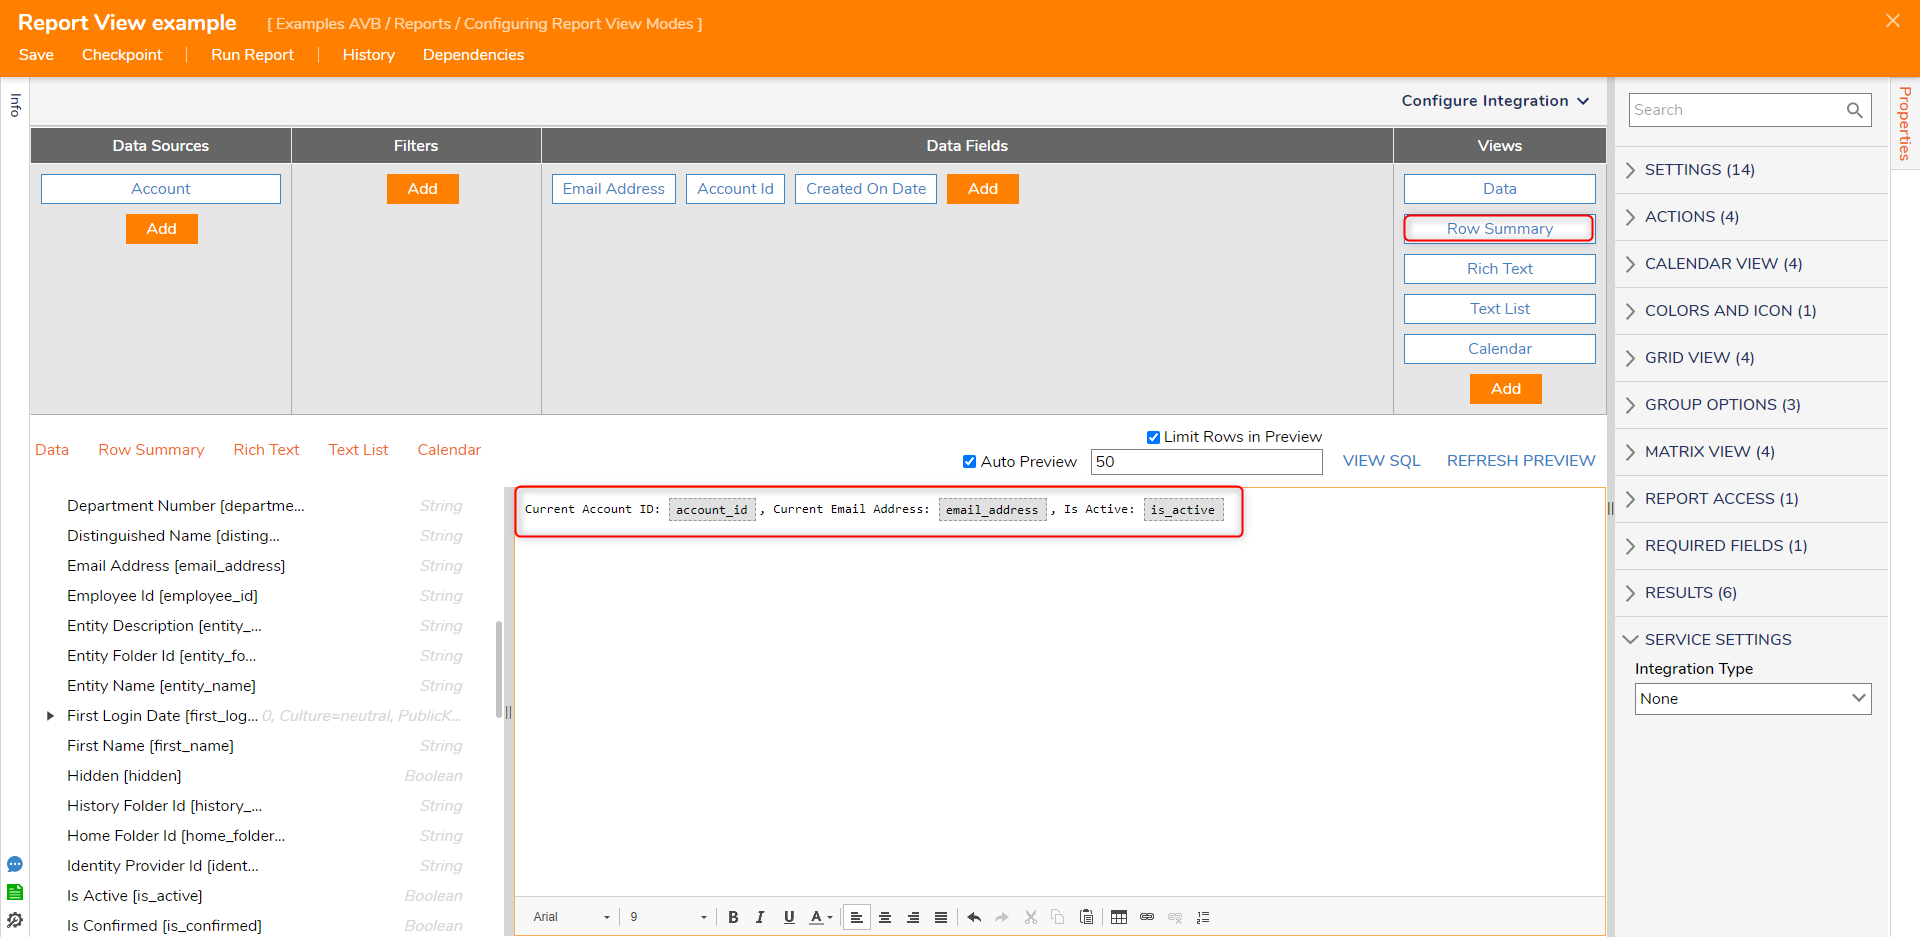
Rich Text
Rich Text View uses a rich text editor to display customized Reports. Tables, images, and links can be added and displayed for each row of the Report.
Text List
Similar to Rich Text View, however, this view will use a standard text editor. Images and links will not display correctly in this view. Any text entered will be displayed as a single line.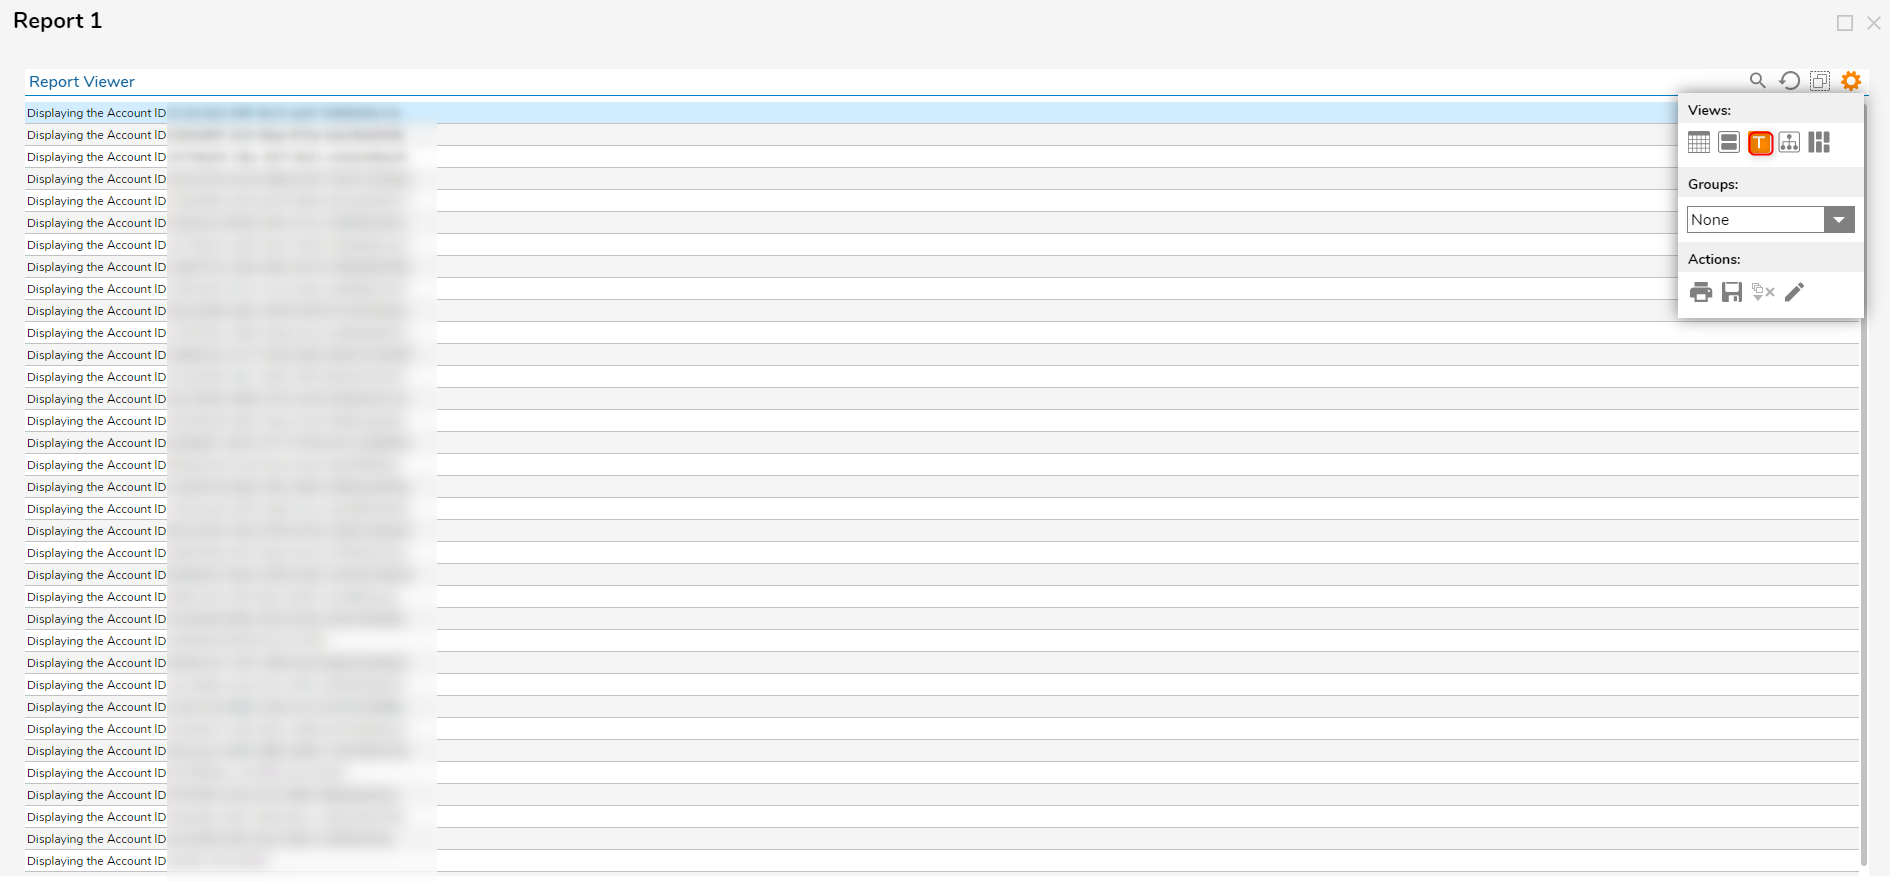
Columns View
The Columns View in the Report provides an option to display selected information from the Report as Columns. 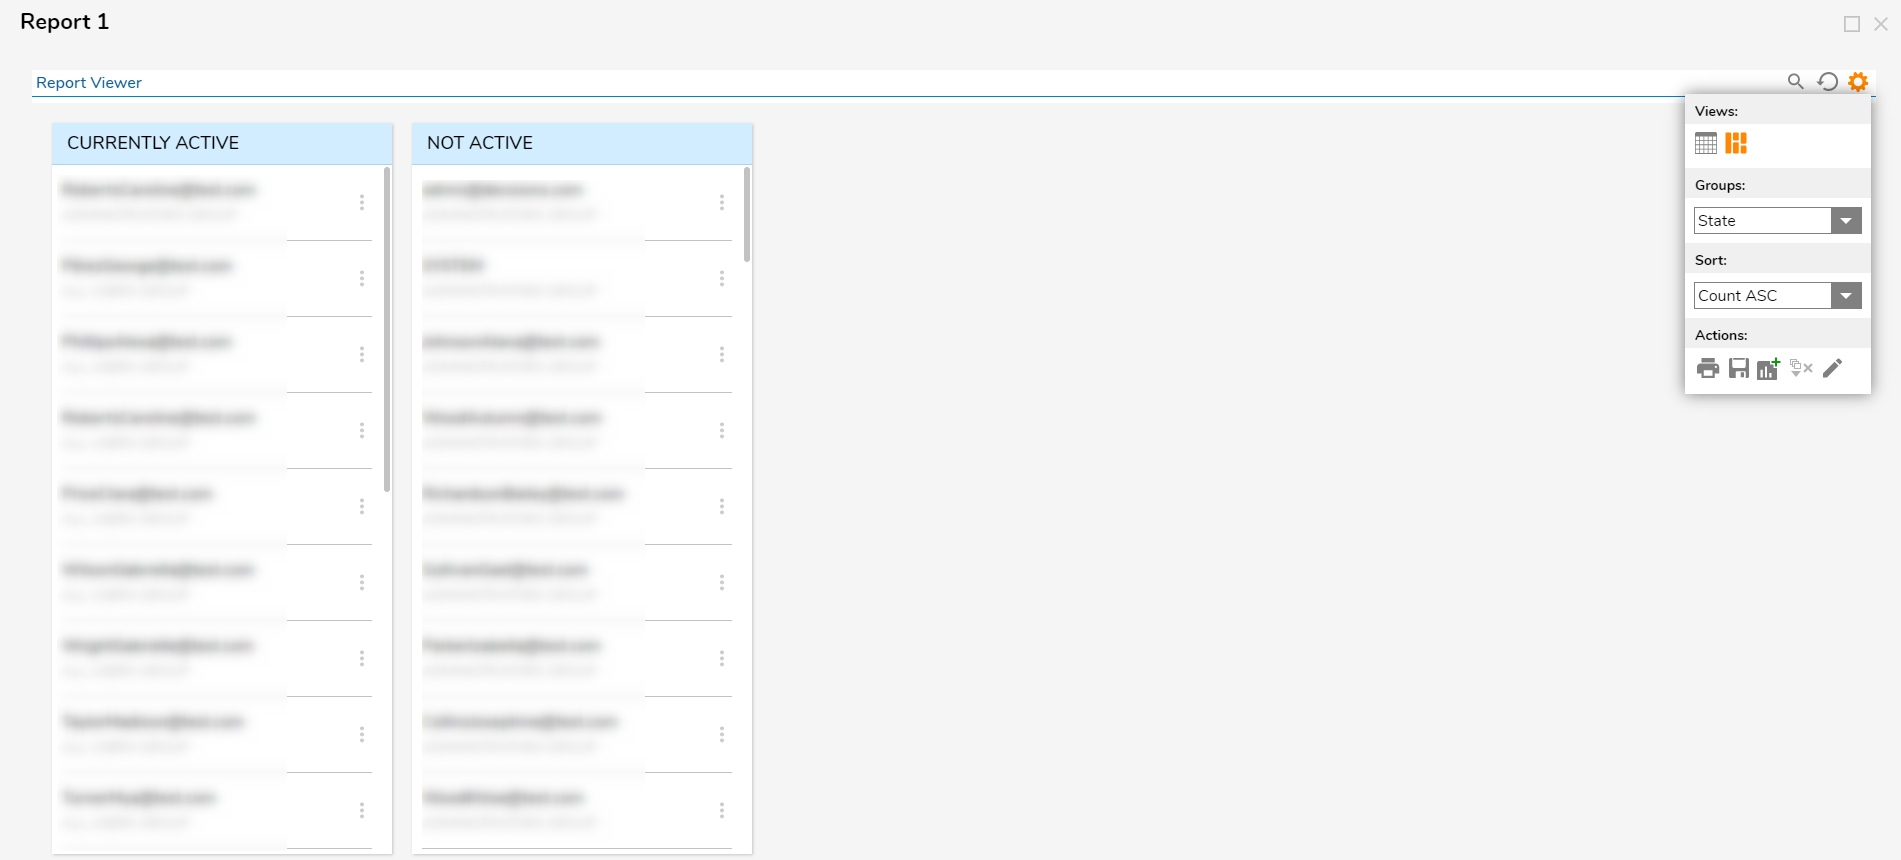
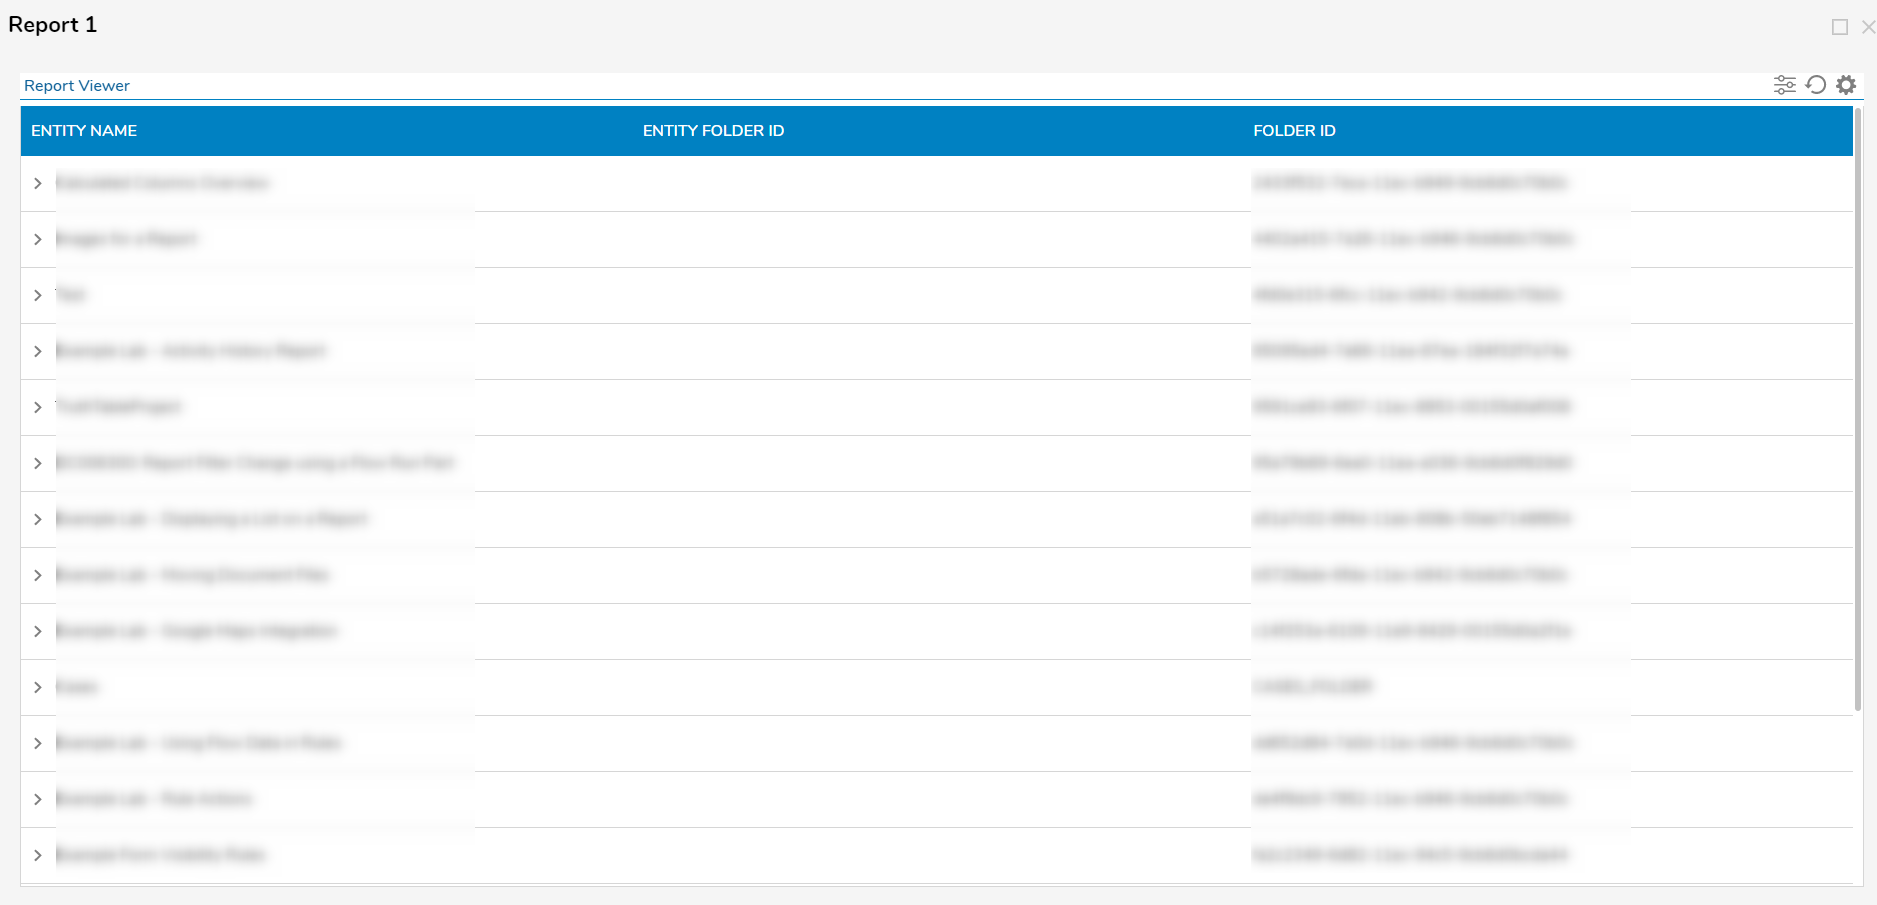
Hierarchical View
Hierarchical Views allow nested objects to be shown in a Report. For example, this view can be used to display the child Folders for every Folder that has been created in Decisions.
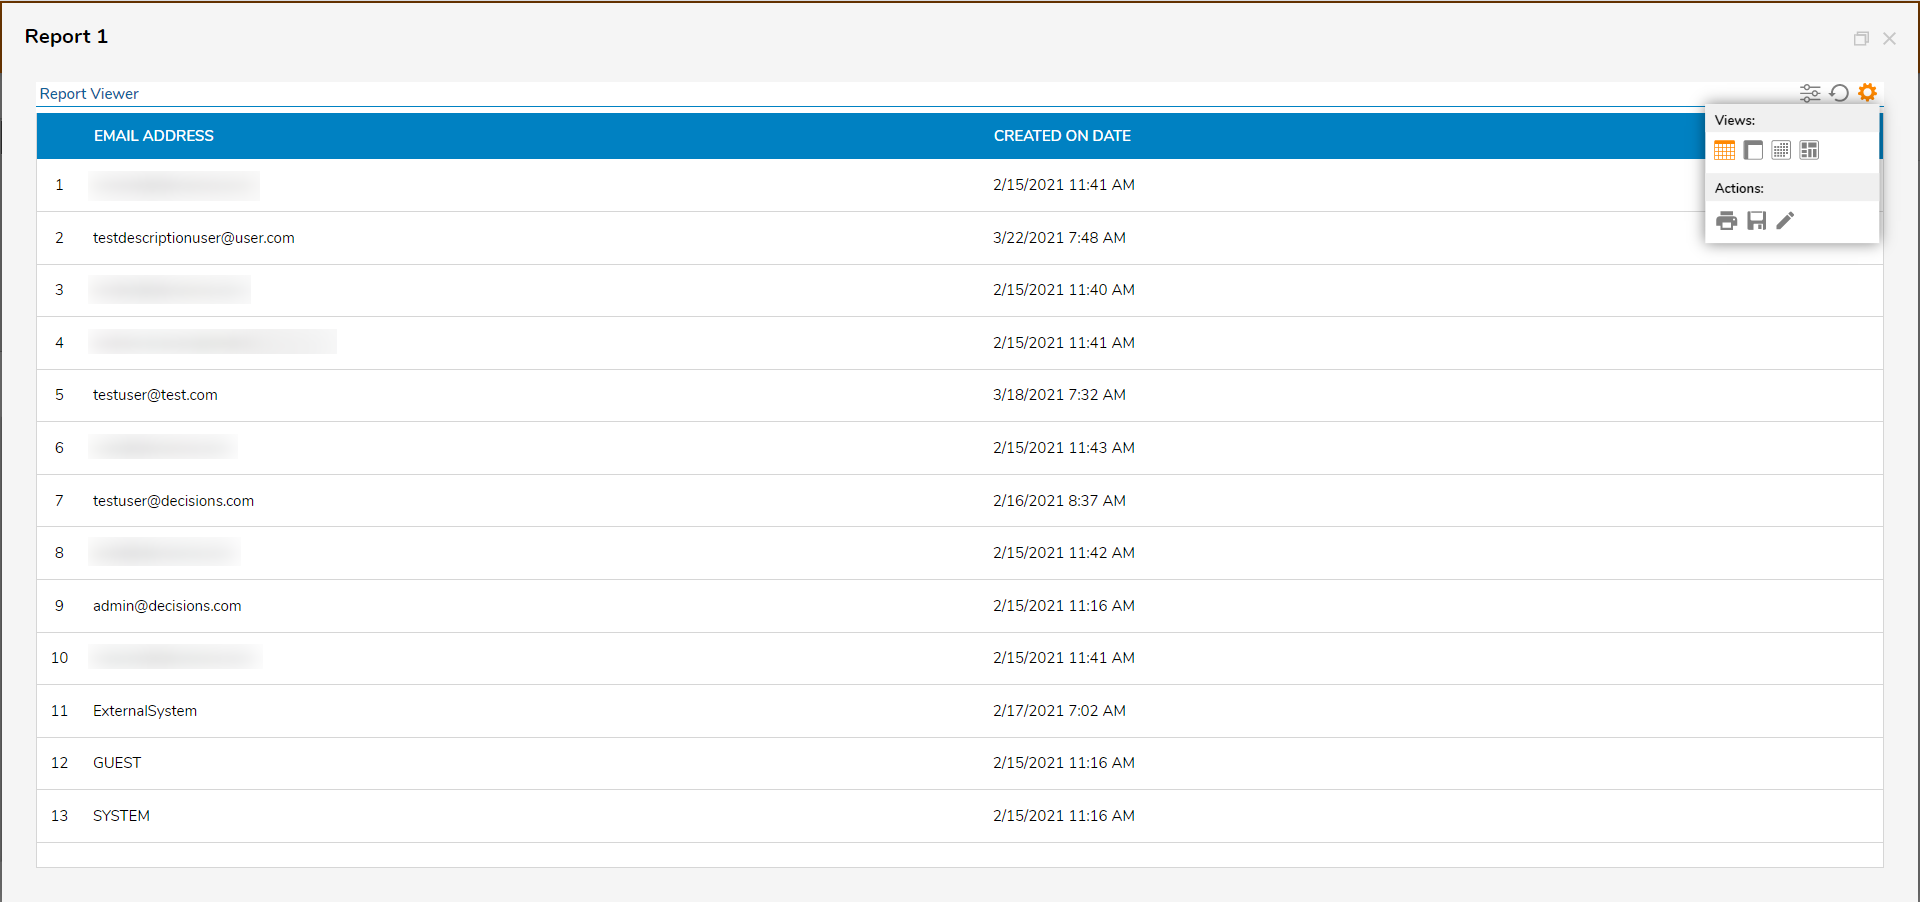
To test the report view modes, at the top of the Reports Designer, click Run Report. The view modes you've added to the report appear as icons in the top left-hand corner. Save and close your report to finish.
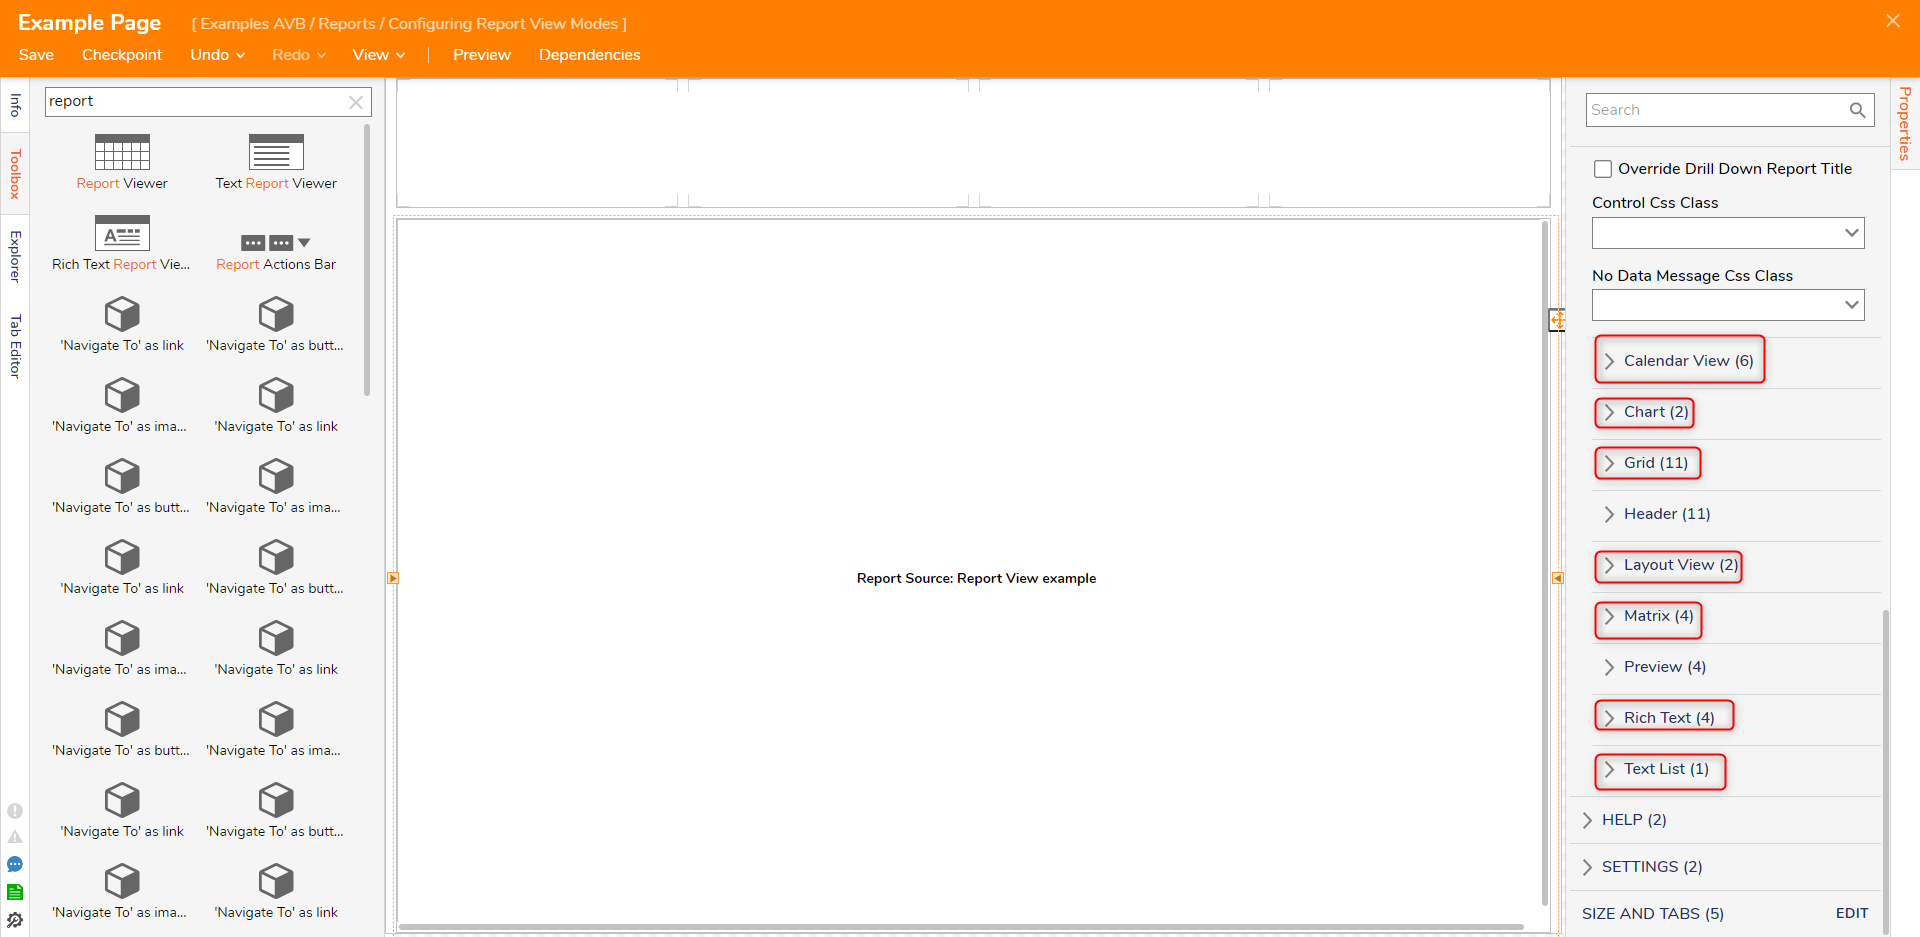
Allowing View Modes on a Page
If the report is displayed on a page, there are additional settings in the report viewer component to further refine how the report data will appear. This example will demonstrate that step.
In the Page Designer, select the Report Viewer, then in the Properties panel on the right side, expand View. By default, all the View Modes are selected. The Page Designer will allow further configuration for the views that are selected.