Overview
Reports are Designer Elements that collect, filter, organize, and display data. The way a Report displays data can be configured through the Properties panel in the Report Designer. The following article details the settings of a Report and how the different functions affect the data being displayed.
Prerequisite Decisions Studio Knowledge
Settings
| Setting | Function |
|---|
| Default View | - sets the default view for the data based on Views selected by the user
|
| Can Add Columns | - allows the end-user to add additional Data Fields to an existing Report while viewing
|
| Audit Report | - shows the user when the Report was executed and what filters are applied if Runtime Filters are enabled
- allows the user to audit Report execution data that will be available in the System > Administration > Auditing folder
- the Default option means that the value of Audit Settings > Enable Audit for Report Executions will be respected
|
| Include Deleted Rows | - includes data from previously deleted rows in the Report
|
| Enable Snapshot | - enables the Snapshot feature on the Report
|
| Excel Default Template | - the user can create templates in the System > Designers > Report Output > Templates folder and this template can be used in the Report Designer to download Report data as a PDF or an Excel file
|
| Hide Default Output |
|
| Output Handlers |
|
| Override Booleans | - Override Drill Down Dialog Title: It changes the Drill Down Dialog Title
- The Drill-Down window can be opened from Views including Tiles, Matrix, or Charts.
|
- Override Drill Down Report Title: It changes the Report Viewer title shown in the Drill Down window
- The Drill Down window can be opened from Views including Tiles, Matrix, or Charts.
|
Override Runtime Filter Dialog Title: It changes the title in the Runtime Filter window- Runtime Filters must be used and this property is not supported in Grid View
|
- Override Display of Null Values: If the cell value is null, then this property gives the ability to show a customize text value in the cells instead of showing empty cells
|
| Row Selection Configuration | Select Row From Parameter: This gives the Designer the ability to pass a selected row of a Report within a Page's URL parameters |
- Parameter Name: this is the parameter displayed in the URL
- Match Value With Column: this setting is matching the Parameter Name with the corresponding Data Field column
|
Actions
| Action | Function |
|---|
| Override Action Context | - allows the user to configure data-specific actions to Report data
|
| Group Action Behavior | - Dynamic: when selecting multiple line items, this setting allows the user to customize the grouping actions
|
- Flow: once enabled, the user will be able to create group actions
- Flow Group Actions: allows the user to create group action Flows
|
| Show Actions On Right Click | - enables the user to right-click and open an item's action menu
|
Calendar View
| Property | Function |
|---|
| Select Calendar Providers | - allows the user to select how the Calendar will display the information
|
| Primary Calendar Provider | - this option tells the Report to display the information at the time it is scheduled for
|
| Specify Calendar Timeline | - allows the user to specify a Timeline to show in the Calendar mode
|
| Max Number Of Event In Cell | - allows the user to specify the number of events that will be shown in the cell
- If the given number to the property is less than the number of events, then a ‘Show More’ link will display, to show other events.
|
Colors and Icon
| Colors and Icon Rules | - enables the user to create a Rule to evaluate data in a Row and add color or an icon to the row when the conditions of the Rule are met
|
Grid View
| Property | Function |
|---|
| Show Group Field Name | - this displays the grouping column field name on the grouping row
|
- Default: this option respects the values from Designer Studio Settings
|
- Never: this option will never show the grouping column field name on the grouping row
|
- Not On Single Grouping: this option will only show the grouping column field name when there is a multi-level grouping
|
- Always: this option will always show the grouping column field name on the grouping row
|
| Grid Settings Type | - Default: this setting gets values from Designer Studio Settings
- Specified: this setting allows the user to specify values for the Grid for the current Report only
|
| Icon Type | - None: this setting displays no icon type
- Circle: this setting displays a circle icon
- Ghost Circle: this setting displays an empty circle icon
- Image: this setting displays an image
|
| Editable | - enables the end-user to edit the Report
|
| Conditional Formatting | - allows the user to set a color to a row or column based on a specific value
- This feature is only applicable to String or Boolean data types
|
Group Options
| Options | Function |
|---|
| Group Text Reports |
|
| Show Aggregations in Text Reports |
|
| Levels Format |
|
Matrix View
| Property | Function |
|---|
| Show Intersection Data | - this allows customized data to be shown at the intersection column
|
| Limit Rows and Columns | - enables the user to set numerical limits for the Report rows and columns
|
| Maximum Rows | - sets the maximum rows for the Matrix data view
|
| Maximum Columns | - sets the maximum columns for the Matrix data view
|
Report Access
| Generate Step to Run Report | - allows the user to create an independent step for a specific Report.
|
| Generated Type Name | - allows user to configure a custom name for an independent step
|
Required Fields
| Required Fields | - this allows the user to specify the columns that will be displayed in the Report
- If the selected column is not present under the Data Fields section, then a warning message will display
|
Results
| Sub Totals | - calculates subtotals based on user selection from Report data
|
| Use Paging | - displays the count of data rows that will be displayed on a Report page
- By default, this is set to 500 which means that 500 rows will be displayed on each page
|
| In-Memory Data Pagination | - this setting allows all data to load at once to help calculate an accurate number of Report pages, useful especially when filtering Report data
|
| Filter Mode | - allows for the default filter to be the filter defined in the Report, a filter on the data set, or no filter at all.
|
| Rows Per Page | - sets the number of rows displayed per Report page
|
| Paging Mode | - Numeric: shows the total page count
|
- Previous Next: shows the current page number and the next button, useful when total page count may be unknown
- this setting is not applicable if the Report has a grouping or subtotal on any column, or if the Report has a Chart, Matrix, Calendar, or Hierarchical view.
|
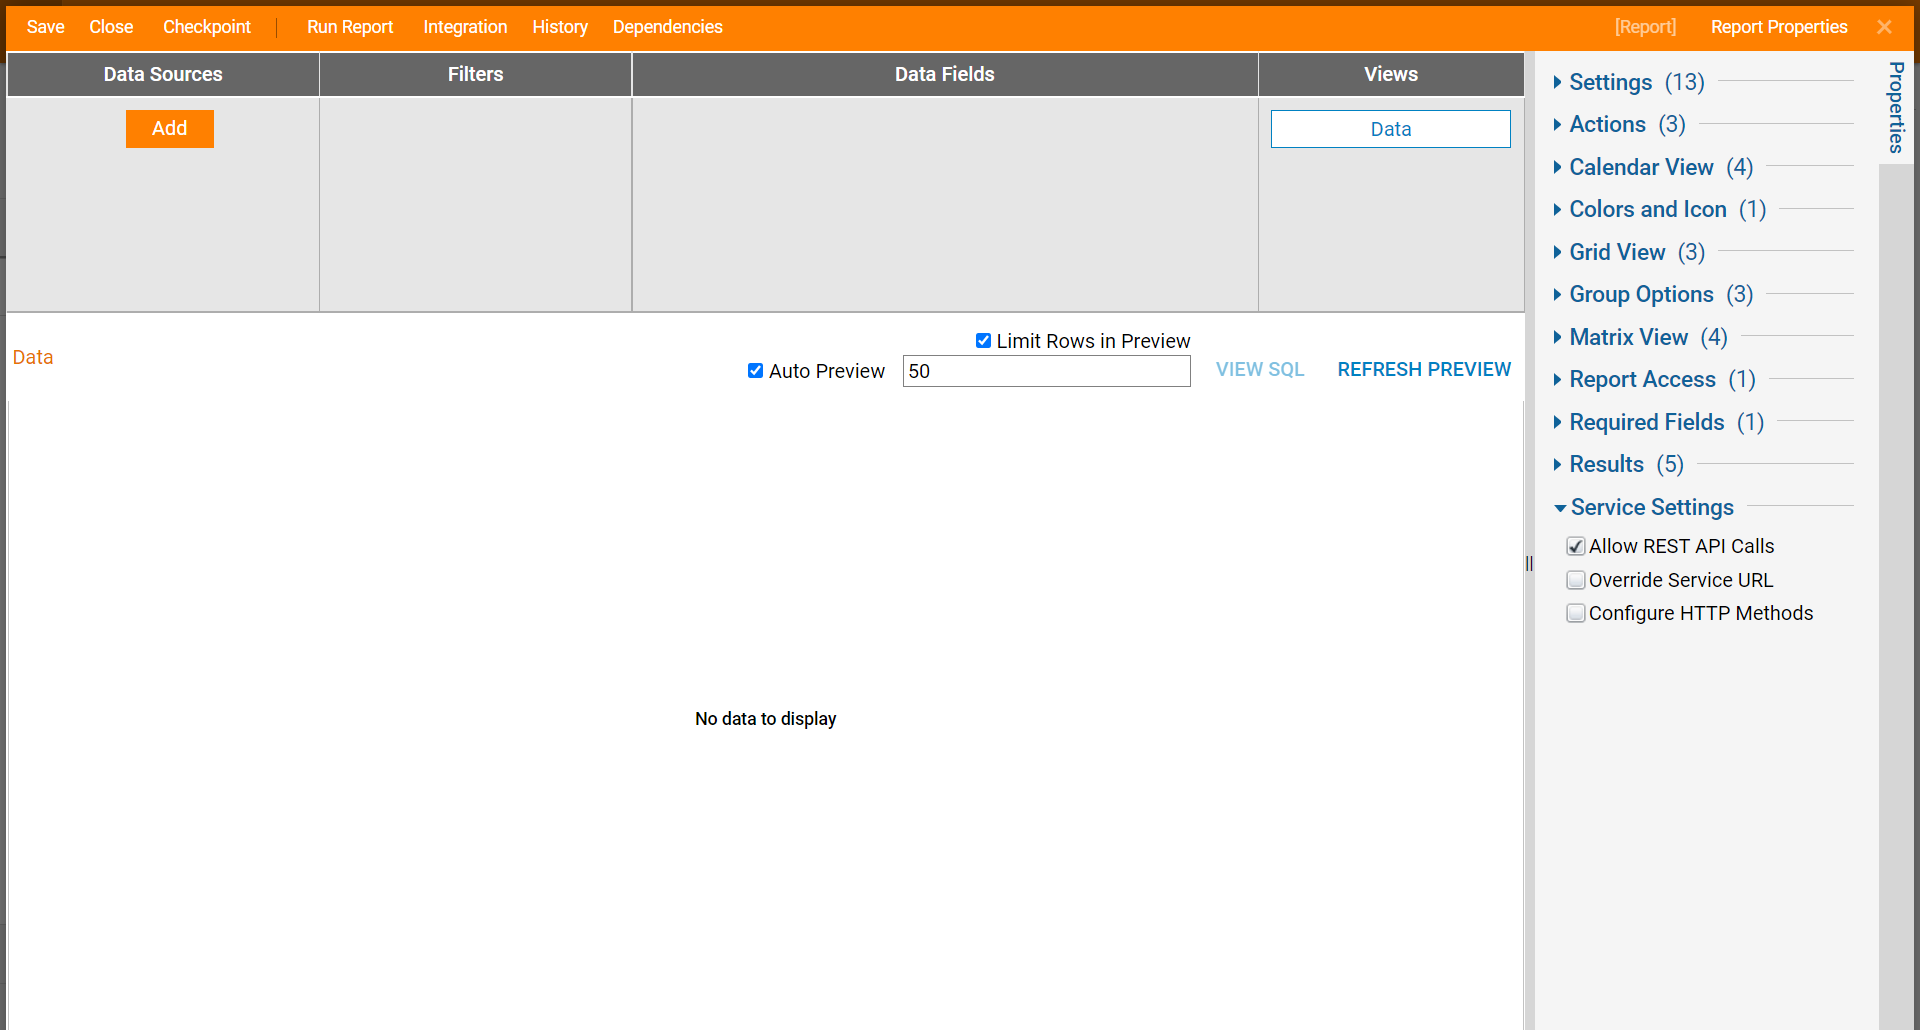
Service Settings
| Allow REST API Calls | - enables the Report to be called using a REST web service that supports different HTTP methods
|
| Override Service URL | - allows the user to customize the Service URL
- the Service URL allows the user to make API calls using the Base Portal URL and the configuration shown in the Report Designer.
|
| Configure HTTP Methods | - allows the user to select GET, POST, or PUT as HTTP methods
|