Overview
Data in the Report Designer can be displayed in tables, matrixes, summaries, or charts. Reportable data can be sourced from the System, Flows, Folders, or Integrated Systems. It can also be filtered according to the source's contents; custom charts, matrixes, summaries, grouping, and organization schemes can be configured in the Report Designer. Additional display and styling options can be configured within the Report Designer, the Page Designer, or at runtime. This article will demonstrate how to create a Report using the Report Designer.
Example
- In a Designer Folder, select CREATE REPORT from the bottom action panel.
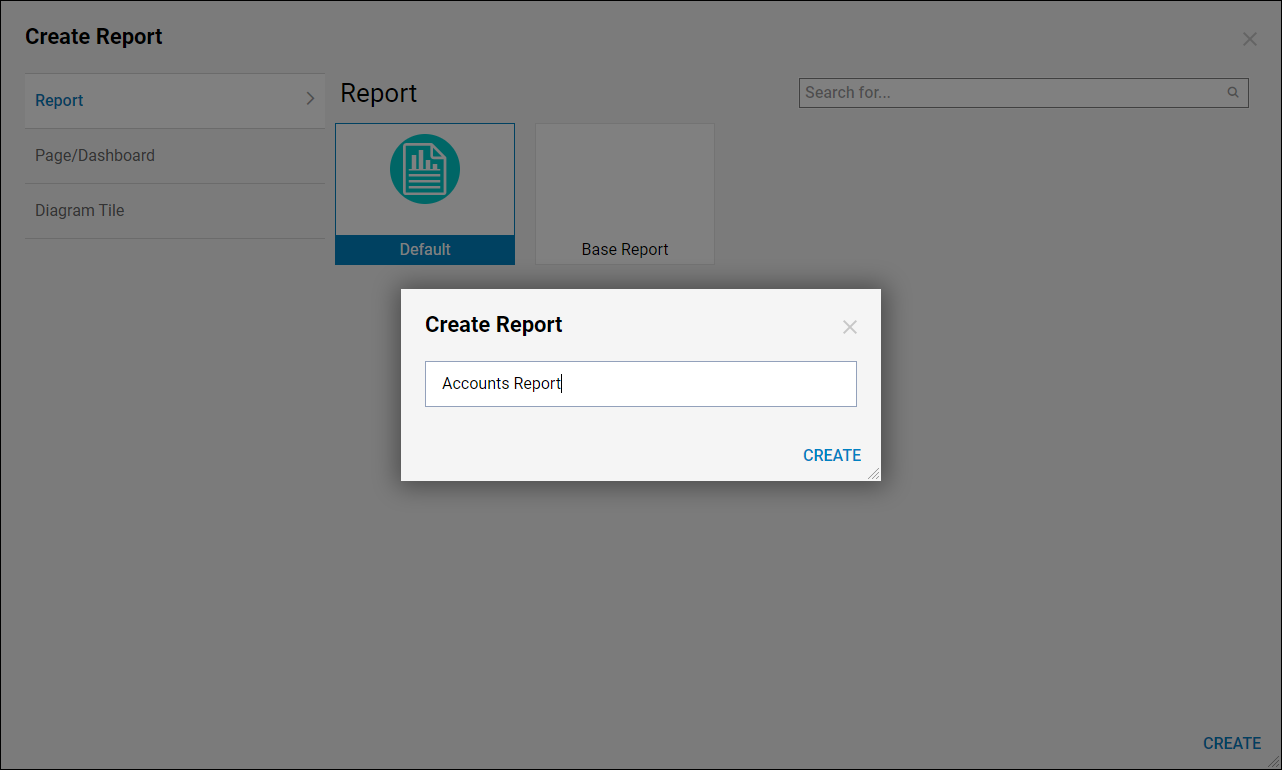
- In the resulting Create Report window, select and name the default Report [Accounts Report]. Click CREATE.
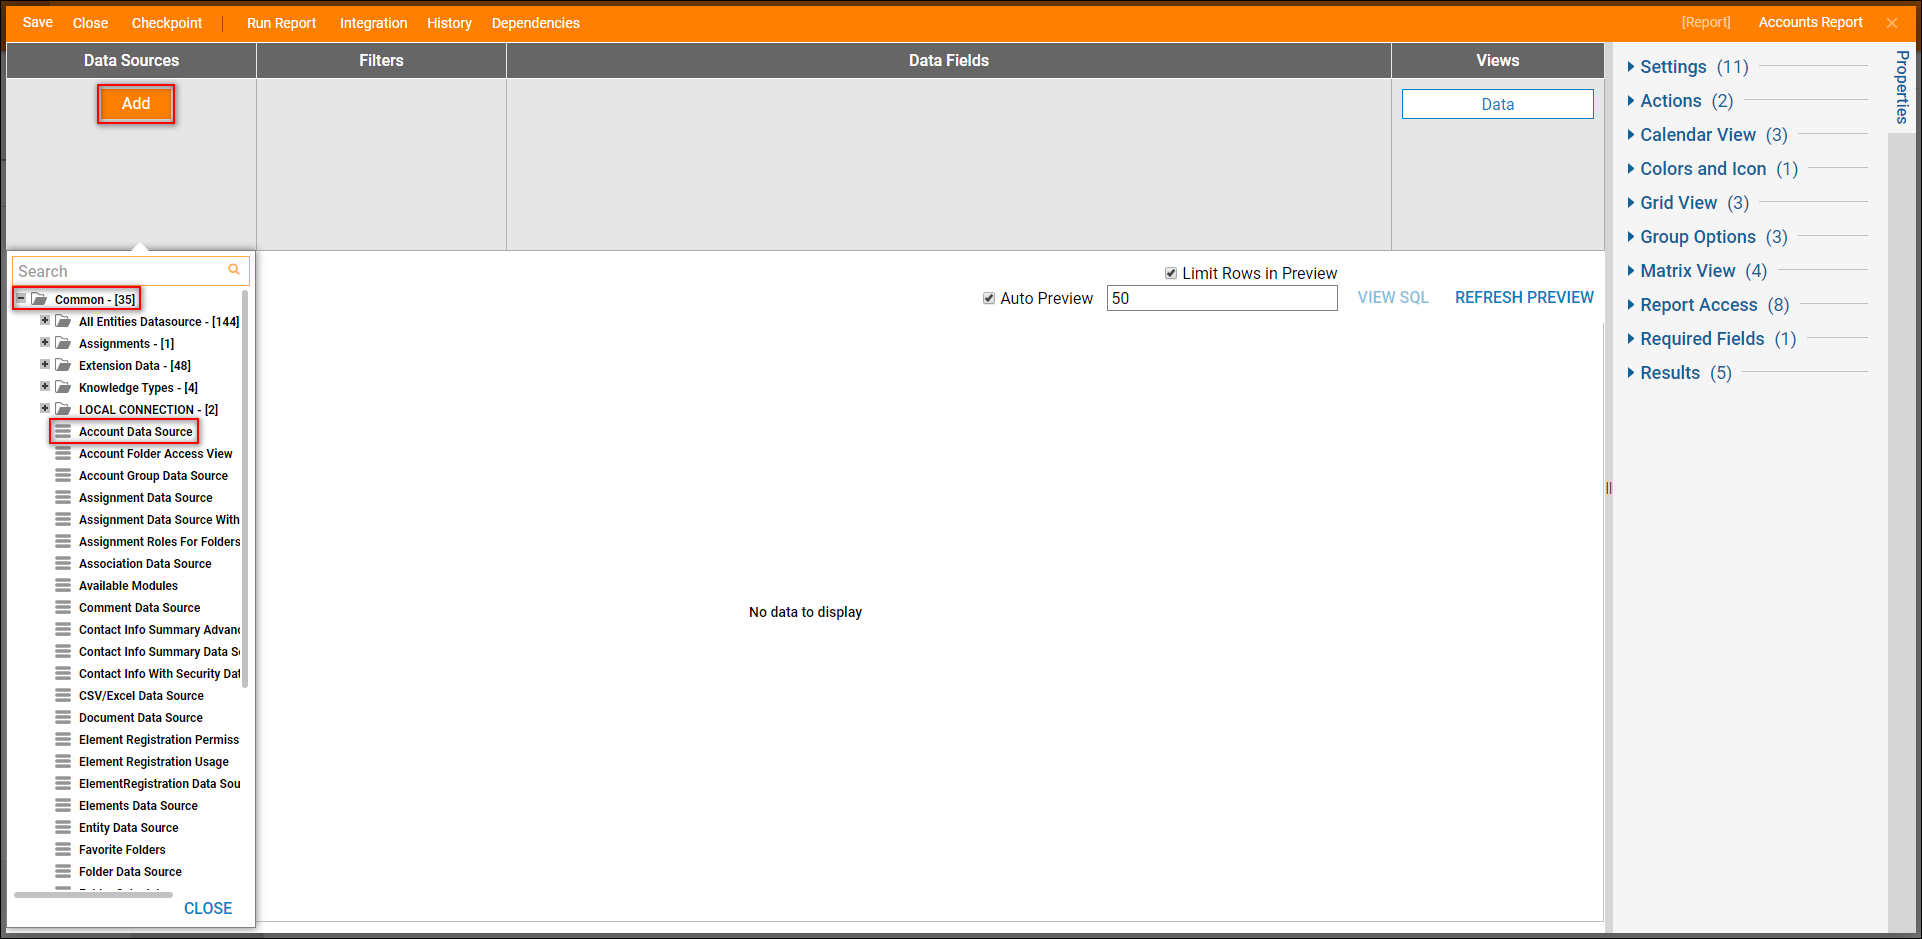
- In the Report Designer, no other fields except the default Data View can be configured until the Data Source is configured because the items shown in the Report are selected based on the properties of the Data Source and the applied Filters.
- Click the Add button under Data Source, then perform a search for Account and select the standalone object. Optionally, expand the default Data Source Folders in the window to explore other options. For example purposes, the Account Data Source is selected. However, Data Sources can be sourced by Rule Sets, Flows, or a custom one can be created. See the About Reports article for more information.
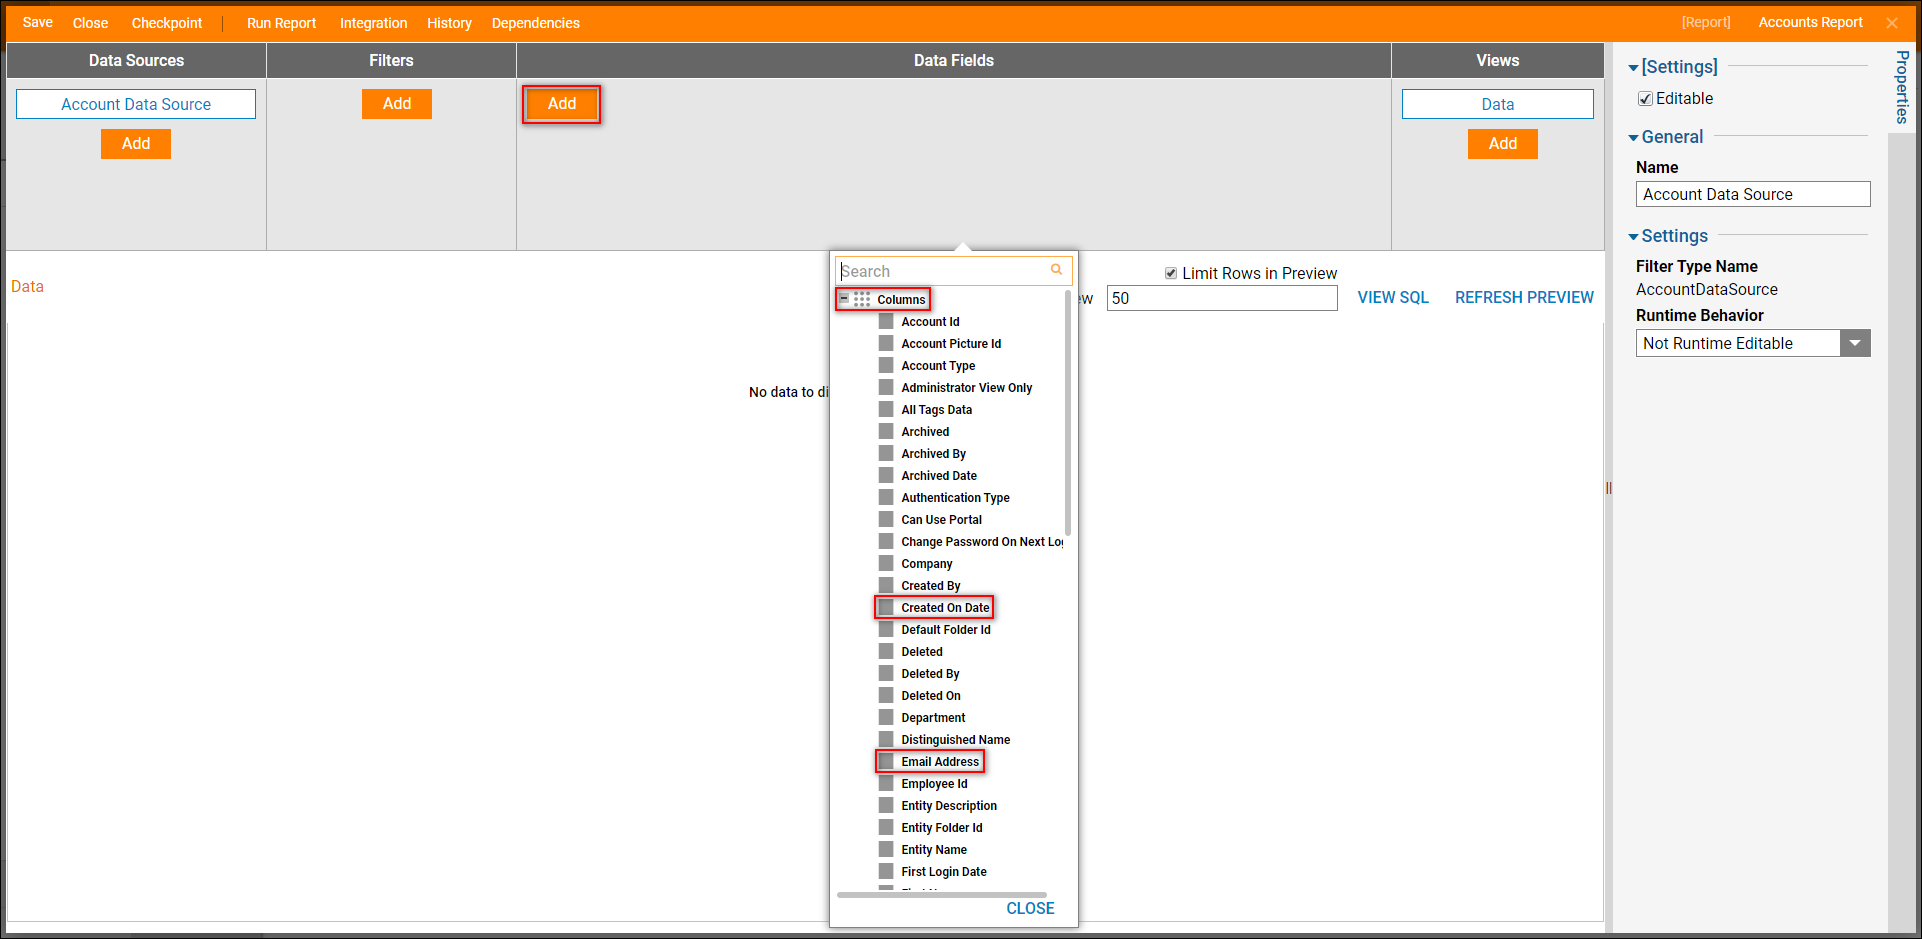
- Next, in the Data Fields section, select the Add button.
- In the Columns category, select Email Address and Created on Date.
Grouping
- To group these results by the Created on Date, hover the mouse over the Created on Date column header. A small icon of three squares will appear (Grouping icon).
- Click on the Grouping icon; grouping a Report by a column allows a user to create a chart for the Report.
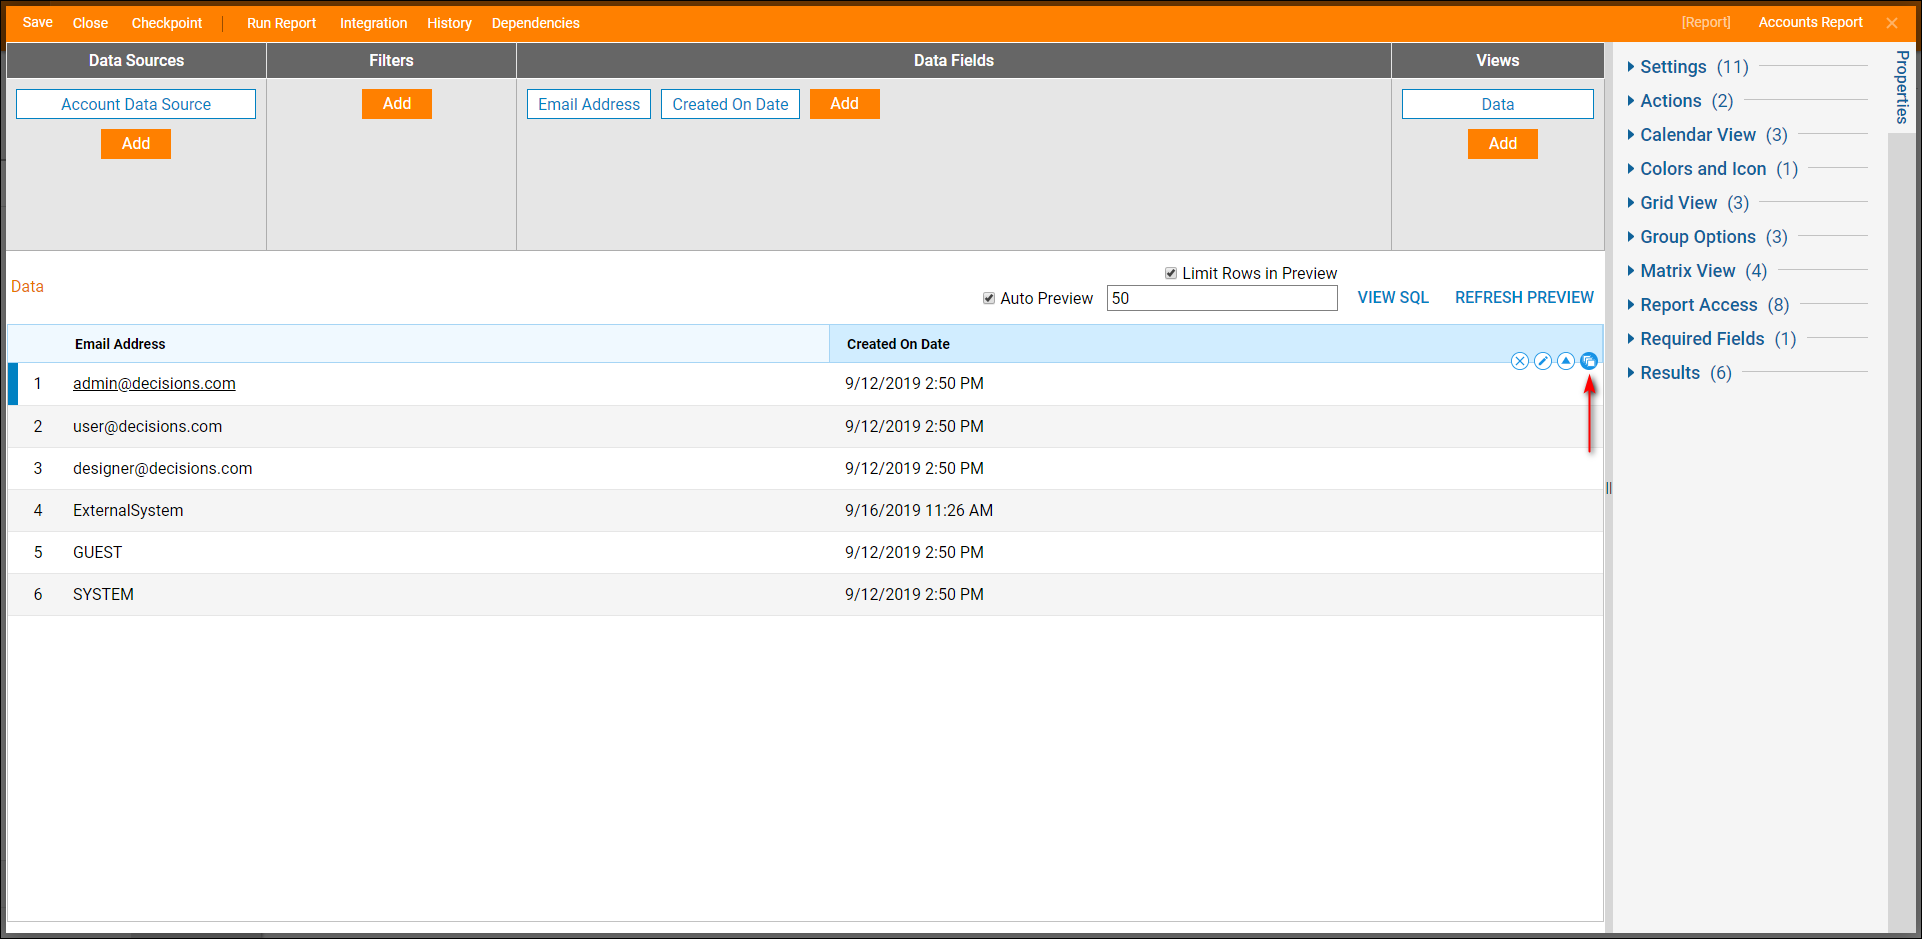
- Select Run Report from the top action panel; this action will automatically save the Report.
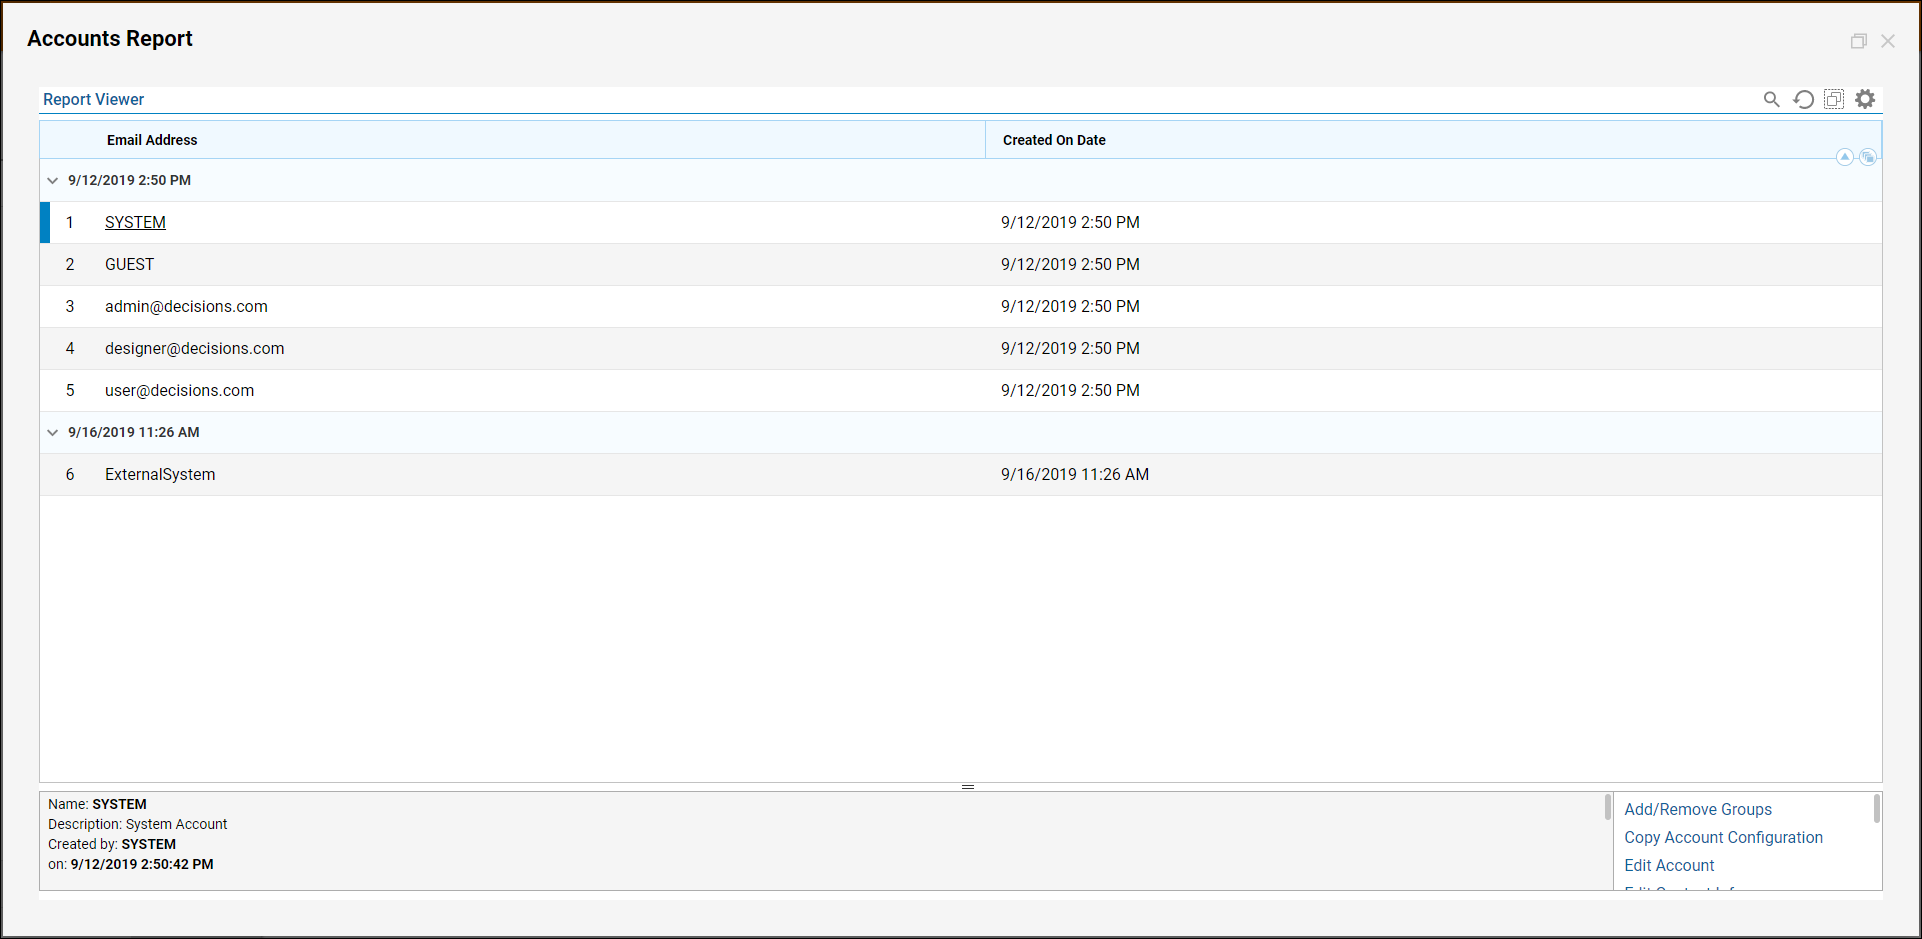
- The Report will open in a new window with a menu bar and several viewing options. By default, the Report will show in Data view, which is a table of all the accounts in the system being displayed. The results are grouped by Created on Date and each account's Email Address is displayed in the appropriate column.
