Overview
Reports are Designer Elements that collect, filter, organize, and display data. The way a Report displays data can be configured through the Properties panel in the Report Designer.
The following article details the settings of a Report and how the different functions affect the data being displayed.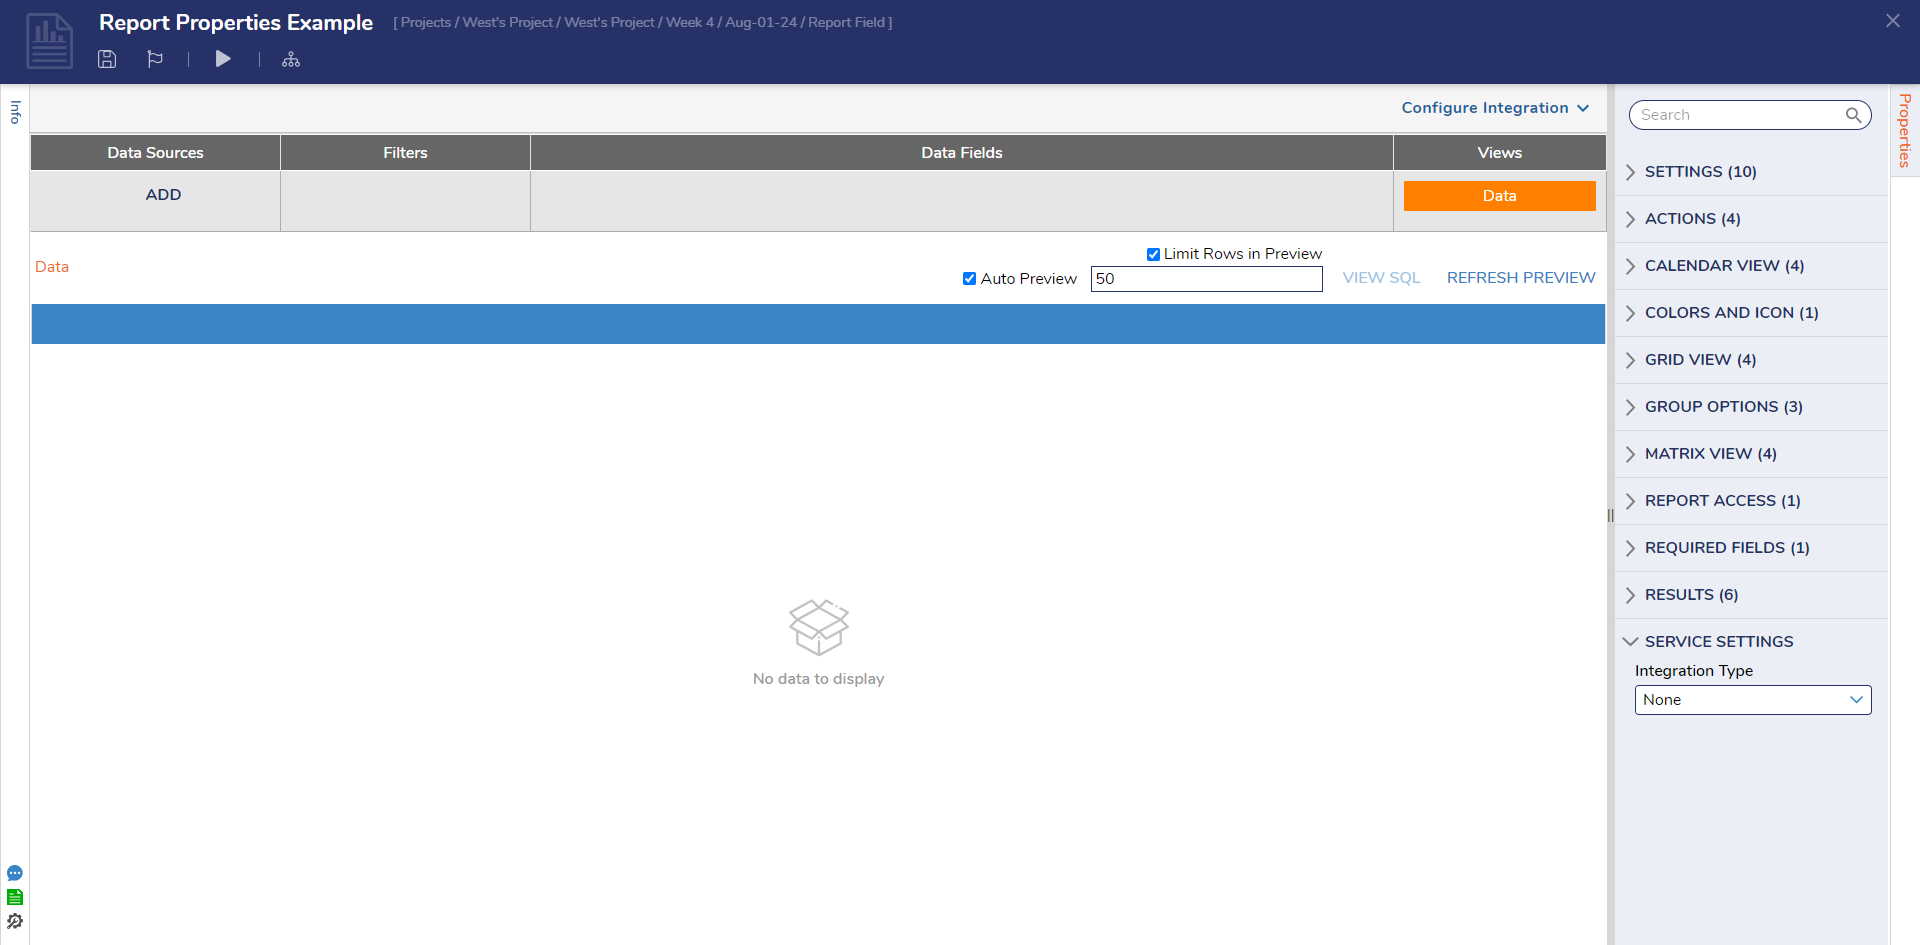
Settings
| Setting | Description | |||||
|---|---|---|---|---|---|---|
| Default View | Sets the default view for the data based on Views selected by the user. | |||||
| Audit Report | Shows the user when the Report was executed and what filters are applied if Runtime Filters are enabled. Allows the user to audit Report execution data that will be available in the System > Administration > Auditing folder. The Default option means that the value of Audit Settings > Enable Audit for Report Executions will be respected. | |||||
| Include Deleted Rows | Includes data from previously deleted rows in the Report. | |||||
| Excel Default Template | The user can create templates in the System > Designers > Report Output > Templates folder, and this template can be used in the Report Designer to download Report data as a PDF or an Excel file. | |||||
| Hide Default Output | Hides the default output for the Report. | |||||
| Output Handlers | Allows the user to create output handler Flows that use the Report's data. | |||||
| Override Drill Down Dialog Title | Updates the Dialog Title for the Drill Down window. The Drill-Down window can be opened from Views, including Tiles, Matrix, or Charts. | |||||
| Override Drill Down Report Title | Updates the Report Title that is shown in the Drill Down window. The Drill Down window can be opened from Views, including Tiles, Matrix, or Charts. | |||||
| Override Display of Null Values | When enabled, if a cell value is null, custom text can be defined and displayed for the field. | |||||
| Row Selection Configuration | ||||||
| Select Row From Parameter | Enabled allows passing a selected Report row within a Page's URL parameters. This is defined in the Parameter Name and Match Value With Column fields. | |||||
| Parameter Name | This is the parameter name as displayed in the URL. | |||||
| Match Value With Column | This setting will match the Parameter Name to a corresponding Data Field column. | |||||
Actions
| Setting | Description | ||
|---|---|---|---|
| Override Action Context | When enabled, allows the user to configure data-specific actions to Report data. | ||
| Action Context Type | The selected action type will override the actions on a Report. | ||
| Action Context ID Field | The ID field is used to tie the action to the Report. | ||
| Group Action Behavior | This setting determines how Group Actions will be displayed on the Report. | ||
| Dynamic | When selecting multiple line items, this setting allows the user to customize the grouping actions. This is the default setting. | ||
| Flow | If selected, the user can create Flows used for Group Actions. An additional input to select Flows can be found under Flow Group Actions. | ||
| Flow Group Actions | Defines the Flows used for Group Actions. | ||
| Show Actions On Right Click | If enabled, allows the user to run actions by right-clicking a Row. | ||
| Show Actions On Left Click | If enabled, allows the user to run actions on the left by clicking a Row. | ||
Calendar View
| Setting | Description |
|---|---|
| Select Calendar Providers | Allows the user to select how the Calendar View will display the information. |
| Primary Calendar Provider | This option tells the Report to display the information at the time it is scheduled for. |
| Specify Calendar Timeline | Allows the user to specify a Timeline to show in the Calendar mode. |
| Max Number Of Event In Cell | Allows the user to specify the number of events shown in the cell. A 'Show More' link will display if the given number to the property is less than the number of events. Selecting the link will display other events. |
Colors and Icon
| Setting | Description |
|---|---|
| Colors and Icon Rules | Enables the user to create a Rule to evaluate data in a Row and add color or an icon to the row when the conditions of the Rule are met |
Grid View
| Setting | Description | ||
|---|---|---|---|
| Show Group Field Name | This displays the grouping column field name on the grouping row. | ||
| Default | This option respects the values of Designer Studio Settings. | ||
| Never | This option will never show the grouping column filed name or row. | ||
| Not On Single Grouping | This option will only show the Grouping column filed name when there is multi-level grouping. | ||
| Always | This option will always display the grouping column field name and row. | ||
| Grid Settings Type | |||
| Default | The Default Grid settings for a Report as defined in Designer Studio Settings | ||
| Specified | If selected, the user can specify values displayed on the grid for a Report. When this setting is enabled, additional options that apply to the Grid View will appear. | ||
| Icon Type | Required Grid Settings Type to be Specified along with a configured Icon Rule. This setting determines what Icon will be displayed based on results from the Rule. | ||
| None | No icon will be displayed if selected based on the Icon rule results. | ||
| Circle | If selected, a circle icon will be displayed based on the results from the Icon rule. | ||
| Ghost Circle | If selected, an empty circle icon will be displayed based on the results from the Icon rule. | ||
| Image | If selected, an image will be displayed based on the results from the Icon rule. | ||
| Editable | Enables the end-user to edit the Report. | ||
| Row Left/Right Click Action Type | Two settings control what actions occur on the Report based on the left or right click. | ||
| Show Slider | Displays the Slider when the Report row is clicked | ||
| Show Actions | Displays the action context menu based on the data type used as a source for the Report. | ||
| Default Action | Executes the action as defined in Designer Studio Settings. | ||
| No Action | If selected, no action will run based on the left/right click. | ||
| Selected Rows Style | This property selects the different styles to indicate the selected row. The Show Selected Row Indicator boolean must be enabled for this setting to apply. | ||
| Enable Row Numbering | Allows the user to enable numbers on each row. | ||
| Enable Grouping | Allows the user to group the Report data. | ||
| Enable Sorting | Allows the user to sort the Report data. | ||
| Enable Grid Stretch Mode | This option allows individual columns to be stretched; however, by default, the available width of the Report is equally distributed between all columns. | ||
| Show Selected Row Indicator | Allows the user to highlight selected rows in the Folders when performing actions. | ||
| Conditional Formatting | Allows the user to set a color to a row or column based on a specific value. Only applicable to String or Boolean data types. | ||
| Allow Column Reordering | Allows the end user to reorder the placement of columns at runtime. | ||
| Freeze Columns From Left (Number) (v9.13+) | Freezes desired number of columns on the left side of the Report. If "Allow Column Reordering" is true, columns can be moved in and out of frozen area. Runtime configuration is unavailable at the moment. | ||
| Freeze Columns From Right (Number) (v9.13+) | Freezes desired number of columns on the right side of the Report. If "Allow Column Reordering" is true, columns can be moved in and out of frozen area. Runtime configuration is unavailable at the moment. | ||
| Key Field Column (v9.14+) | This property allows the system to uniquely identify rows using a specified key, ensuring accurate behavior when a row is deleted or modified in the background. Triggering the RunFlowInline field after a row deletion will no longer return incorrect data, as the system can now correctly detect and handle the missing row. | ||
Group Options
| Setting | Description |
|---|---|
| Group Text Reports | If enabled, Text Views for Reports will be grouped together. |
| Show Aggregations in Text Reports | Shows aggregation totals on Text Views of a Report. |
| Levels Format | Sets the font size and indentation levels in a Report. |
| Show Expand/Collapse Action In Header | Moves the Expand/Collapse Groups action from the actions menu to the Report header for easier access. |
Matrix View
| Setting | Description |
|---|---|
| Show Intersection Data | This allows customized data to be shown in the intersecting column. |
| Limit Rows and Columns | Enables the user to set numerical limits for the Report rows and columns |
| Maximum Rows | Sets the maximum rows for the Matrix data view. By default, this value is set to 100. |
| Maximum Columns | Sets the maximum columns for the Matrix data view. By default, this value is set to 100. |
Report Access
| Setting | Description |
|---|---|
| Generate Step to Run Report | Allows the user to create an independent step for a specific Report. |
| Generated Type Name | Allows the user to configure a custom name for an independent step |
Required Fields
| Setting | Description |
|---|---|
| Required Fields | This allows the user to specify the columns displayed in the Report. A warning message will display if the selected column is not present under the Data Fields section. |
Results
| Setting | Description | |
|---|---|---|
| Sub Totals | Based on the field selected, this setting displays a count, sum, average, minimum, maximum, or median number. This is shown in group headers. | |
| Use Paging | Displays the count of data rows displayed on a Report Page. By default, this is set to 500, meaning 500 rows will be displayed on each Page. | |
| In-Memory Data Pagination | This setting allows all data to load at once to help calculate an accurate number of Report pages, useful, especially when filtering Report data. | |
| Filter Mode | Allows the default filter to be the filter defined in the Report, a filter on the data set, or no filter. | |
| Rows Per Page | Sets the number of rows displayed per Report Page. | |
| Paging Mode | Numeric: shows the total Page count. | |
| Previous Next: shows the current Page number and the next button. It is useful when the total Page count may be unknown. This setting is not applicable if the Report has a grouping or subtotal on any column or if the Report has a Chart, Matrix, Calendar, or Hierarchical view. | ||
Service Settings
| Setting | Description |
|---|---|
| Integration Type | None: default Report setting that will not initiate a service integration. |
User Interface: allows users to configure how UI elements will be configured via URL. | |
API Service: allows users to allow to configure Get or Post calls. |
Feature Changes
| Description | Version | Developer Task | |
|---|---|---|---|
| Added the ability to freeze Report and Advanced Data Grid columns. | 9.13 | July 2025 | [DT-038956] |
| Added the "Key Field Column" property. | 9.14 | August 2025 | [DT-044421] |
| Added Show Expand/Collapse Action in Header | 9.15 | September 2025 | [DT-044069] |
For further information on Reports, visit the Decisions Forum.