Overview
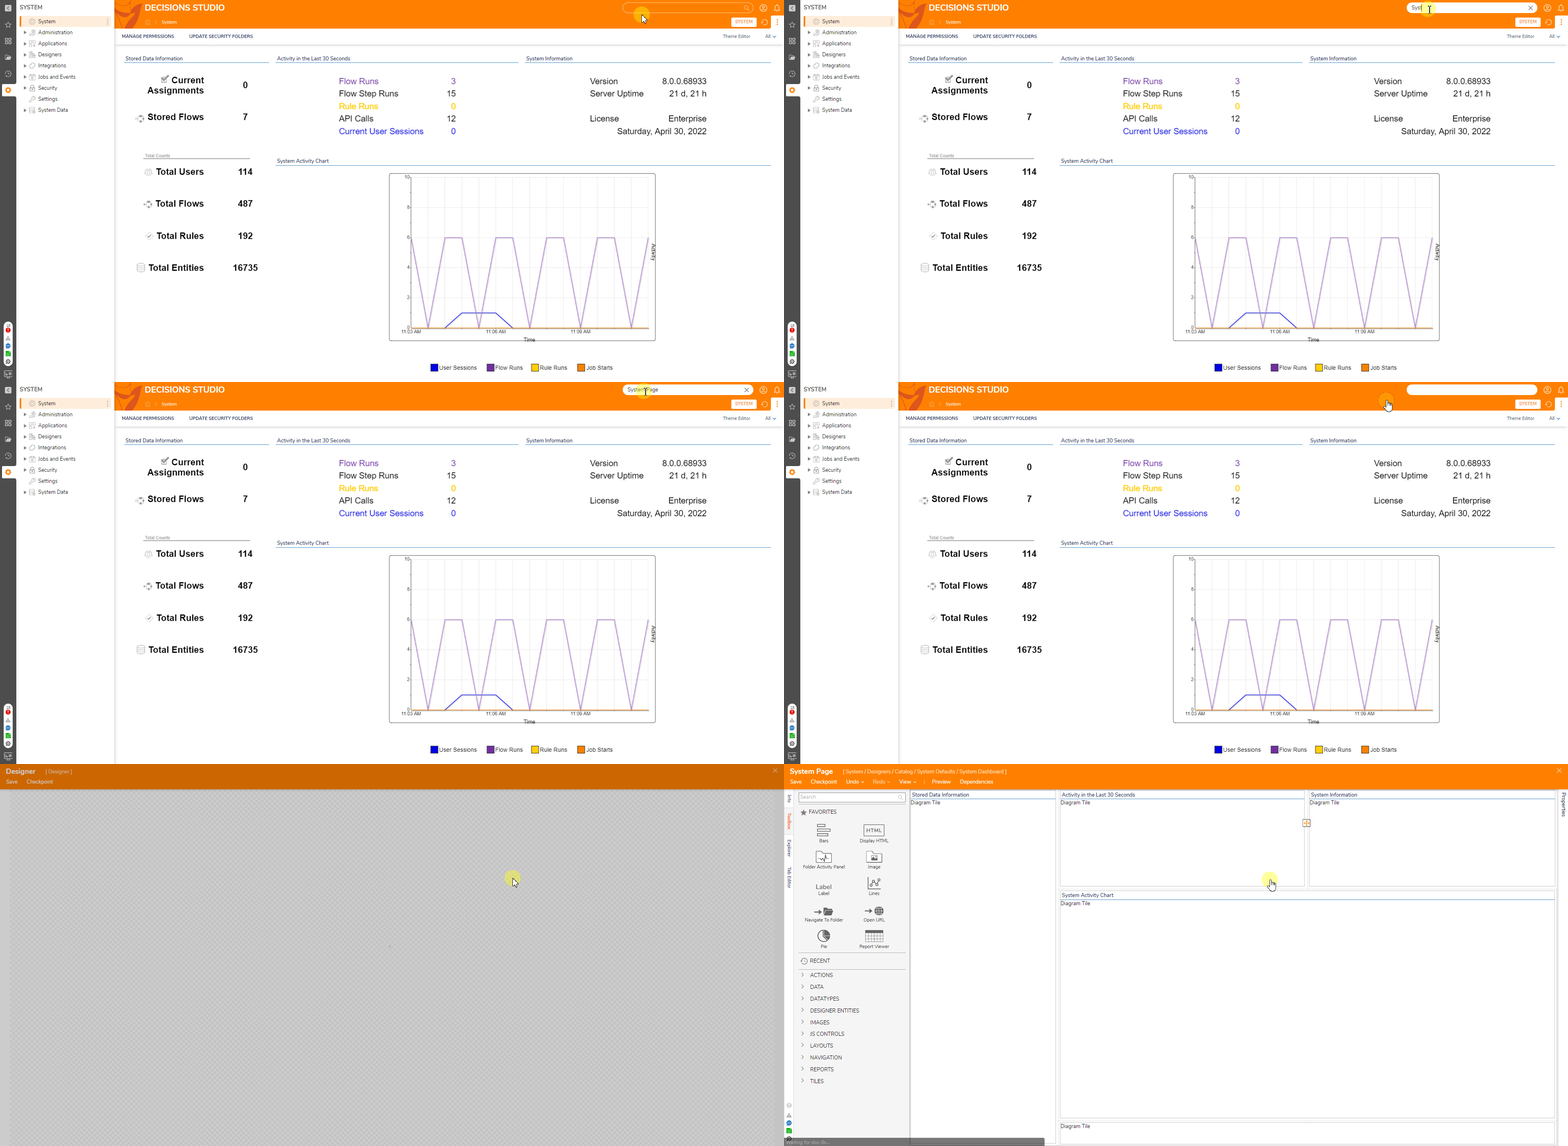
Upon selecting the System settings from the Folder view, the System Page populates the browser.
This Page displays metrics for activity within the Decisions instance. Admin users may customize the System Page by using the default as a base where they can add, remove, and other rearrange features to their preferences.
Note that any changes made to this Page effects all admin users not just the editing account's view.
It is a best practice to save a Checkpoint of the System Page and its Diagram Tiles in case any changes must be reversed. If anticipating heavy changes to the default System Page, it is also recommended to save a copy and/or save the default as a template.
Default Displayed Metrics
| Diagram Tile Name | Metric Name | Description |
|---|---|---|
| Stored Data Information | Current Assignments | Total number of Assignments currently active in the instance |
| Stored Flows | Total number of stored workflows in the instance | |
| Total Users | Total number of users in the instance | |
| Total Flows | Total number of Flows in the instance | |
| Total Rules | Total number of Rules in the instance | |
| Total Entities | Total number of Entities in the instance | |
| Activity in the Last 30 Seconds | Flow Runs | Total number of Flows initiated within the allotted time |
| Flow Step Runs | Total number of Steps ran across all initiated Flows within the allotted time | |
| Rule Runs | Total number of Rules ran within the allotted time | |
| API Calls | Total number of API Calls within the allotted time | |
| Current User Sessions | Total number of active users interacting with the instance in the last two minutes | |
| System Information | Version | Version number of the instance |
| Server Uptime | Total server uptime of the instance i.e. time since the server was last restarted and/or shut down | |
| License | License type of the instance | |
| System Activity Chart | System Activity Chart | Visualizes activity over time for the following metrics: User Sessions, Flow Runs, Rule Runs, and Job Starts |
Example
This example demonstrates how to remove the server uptime metric from the System Page; however, the same process applies to the other metrics.
- To find the System Page, search for it in the search bar at the top right of the Studio. Select it from the search results and it will automatically open in the Page Designer.

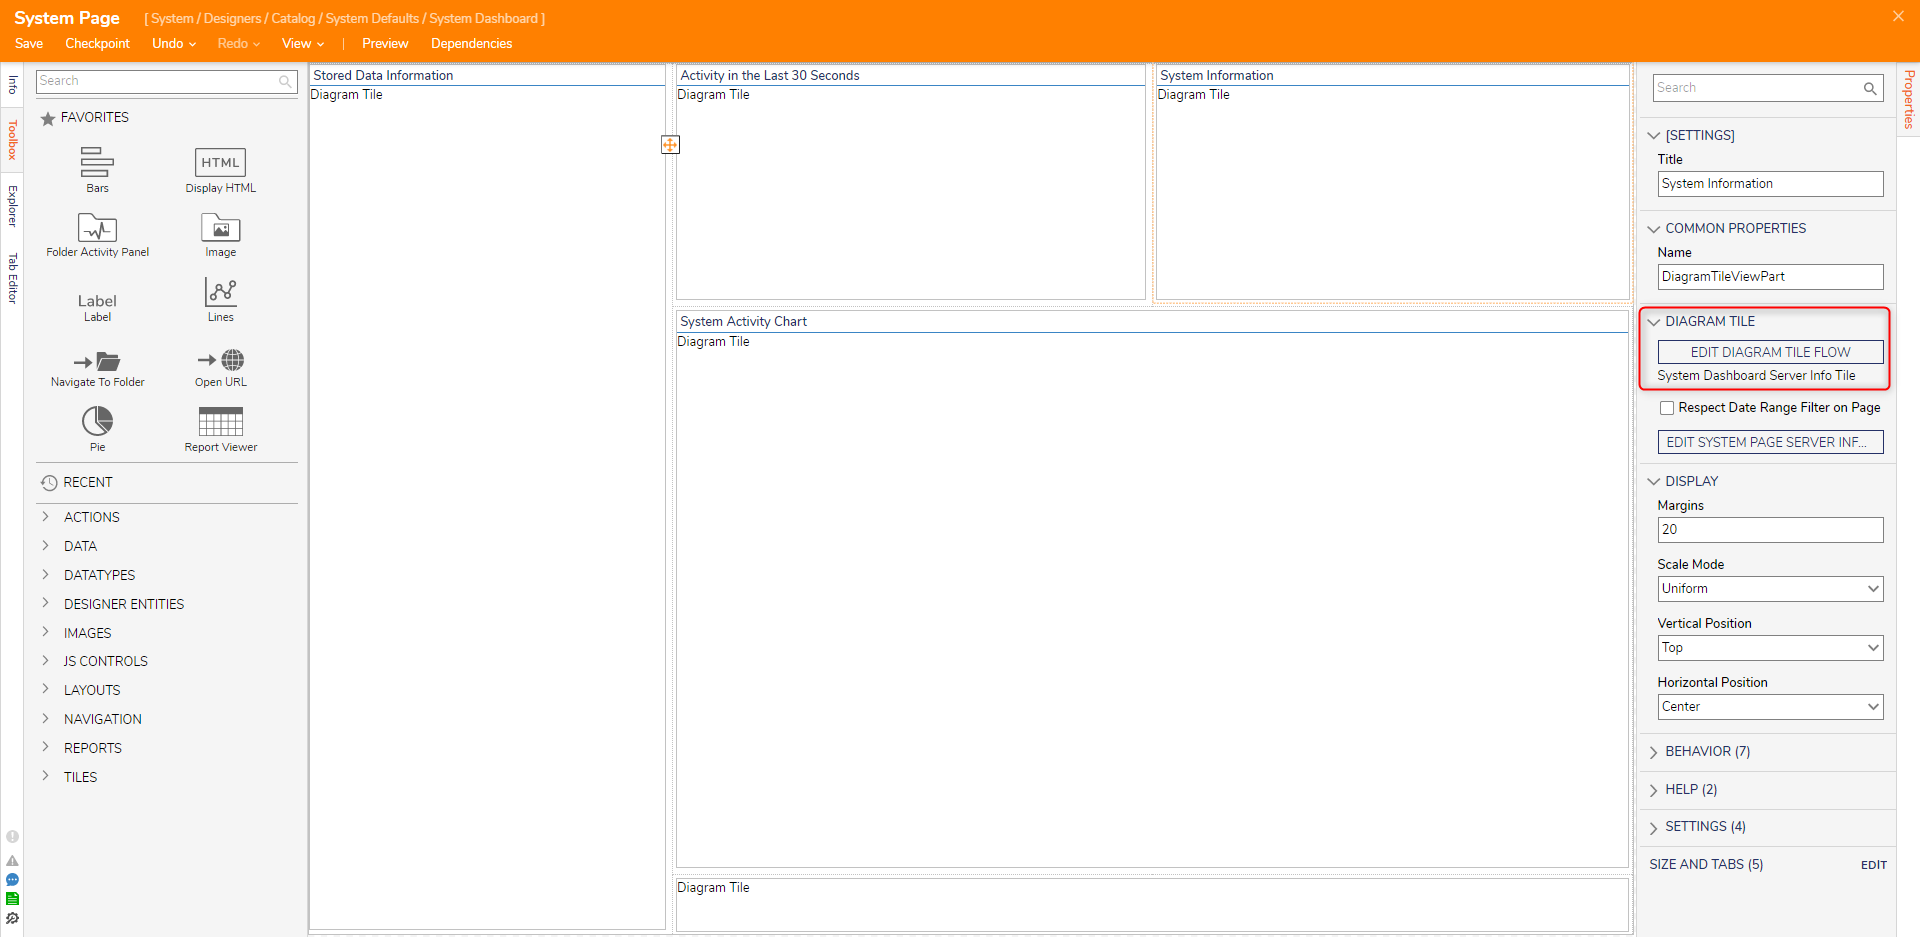
- In the Page Designer, notice the sections of the System Page are comprised of several Diagram Tiles. Select the Diagram Tile containing the Server Uptime metric aka System Information. In it's Properties, select EDIT DIAGRAM TIME FLOW.

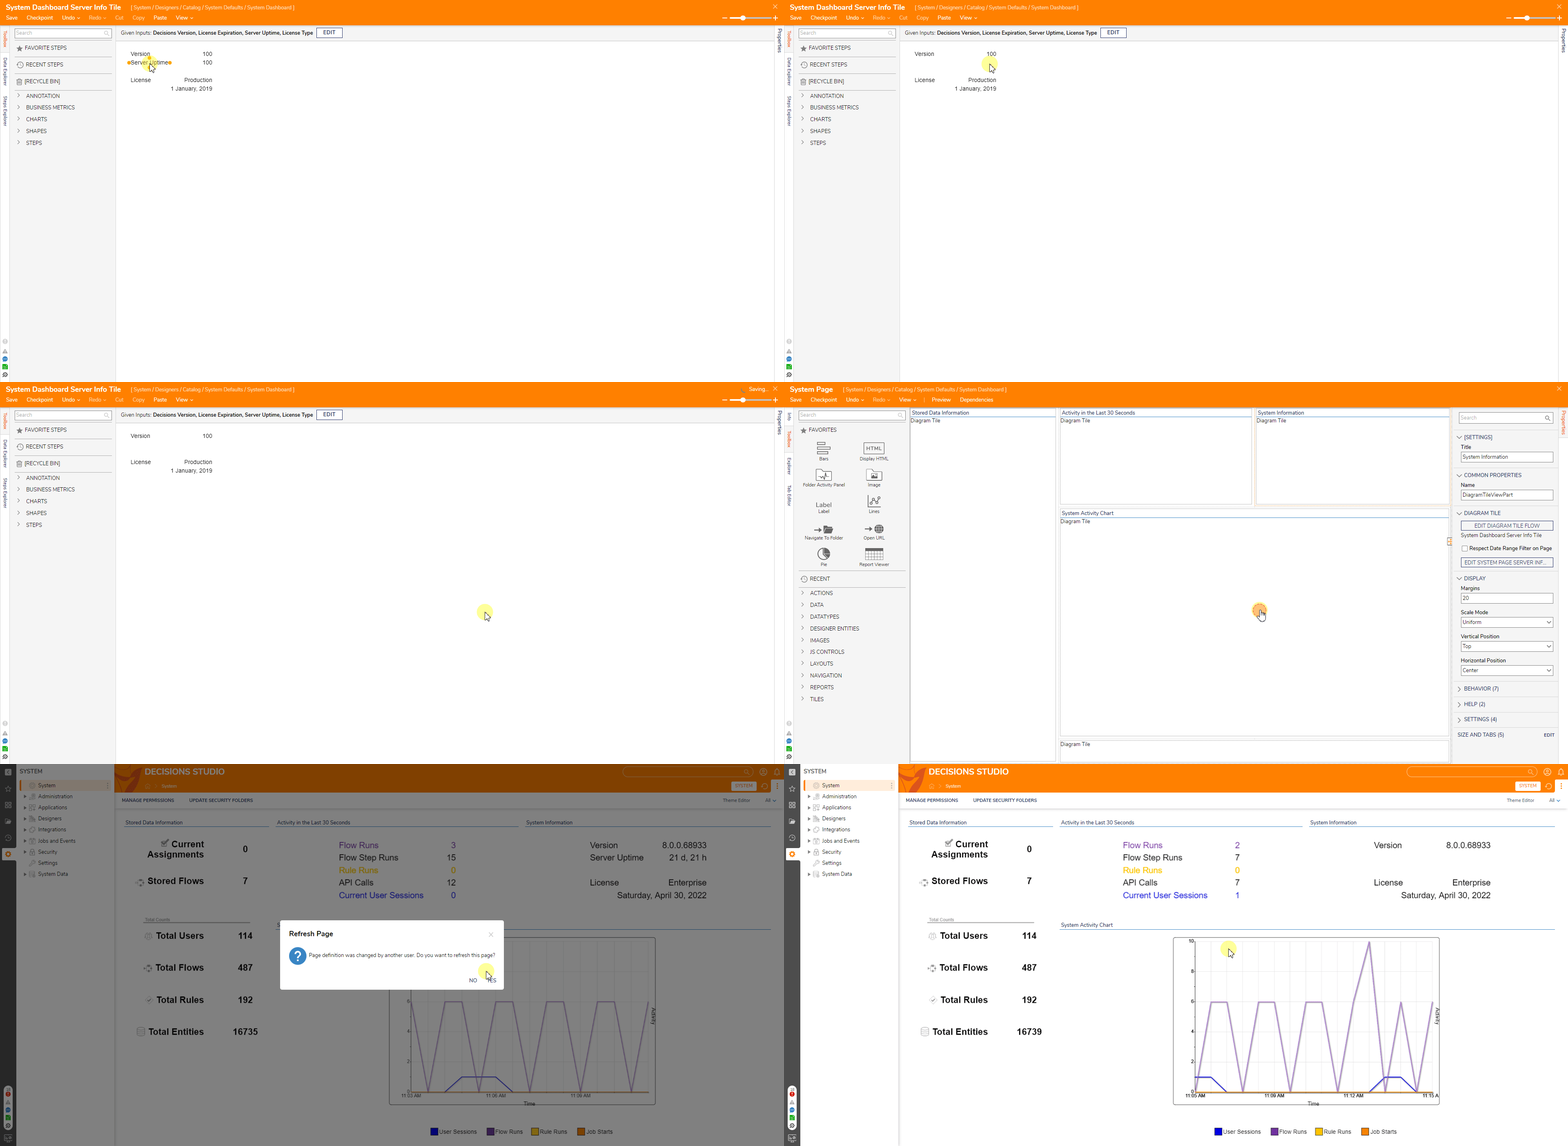
- In the Diagram Tile Flow Designer, delete the "Server Uptime" Label and its accompanying "100" Label to its right. Save and exit the Diagram Tile Flow Designer then save and exit the Page Designer.
- Upon exiting the Page Designer, a popup will appear stating the page definition has changed and thus the Page must be refreshed. This occurs in response to the edit conducted on the System Page. Select YES and and notice the new changes.

Reverting System Page Changes
Changes may be undone via the Revert To Version Action accessible by right-clicking the System Page then navigating to Manage > Revert To Version.
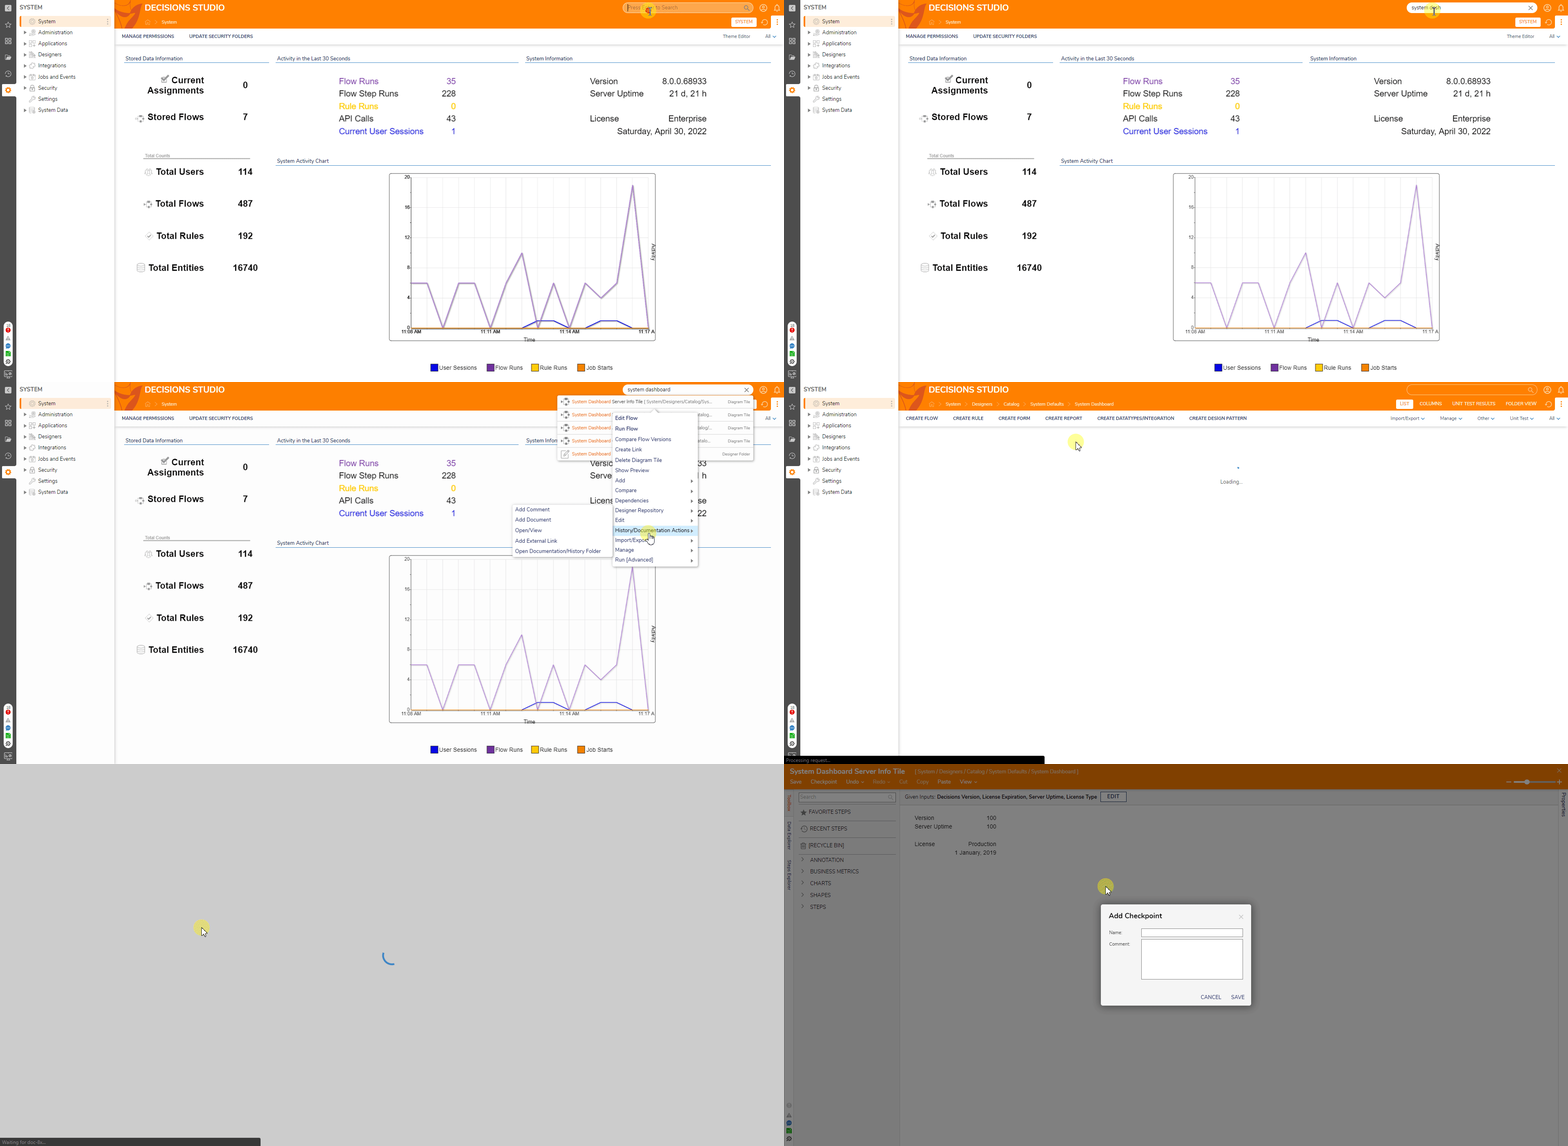
- Locate a System Page Diagram Tile. Default System Page Diagram Tiles are located in System > Designers > Catalog > System Defaults > System Dashboard. Alternatively, search for the Tile name and open its containing folder.
- Edit the desired Diagram Tile then select Checkpoint from the Top Action Bar to save a checkpoint. Provide a descriptive name. For this example, a Checkpoint of the System Information Diagram Tile is made.

- Make any change to the Diagram Tile with the Checkpoint. Similar to the prior example, the "Server Uptime" Labels will be removed. Save and exit the Diagram Tile Designer.
- Return back to the System Page to notice the change.
- In the top right search bar, search for the Diagram Tile with the Checkpoint. Right-click on it and select Manage > Revert To Version.
- In the Revert To Version window dialog, select the Checkpoint made before making the edit i.e. before removing the server uptime information. Select REVERT to confirm the change. After the Page refreshes, the change made will be reversed.
