Overview
Example Lab Details | |
| Version | 8.5.0 |
| Root Folder | Populate Chart Using a Flow |
| Modules | None |
| Dependencies | None |
A user can populate a chart component for a Page using a Flow by selecting the Use Flow option under the Mode setting under Chart Data. The Use Flow option allows the user to fetch and filter data that will be shown on a chart.
Explanation
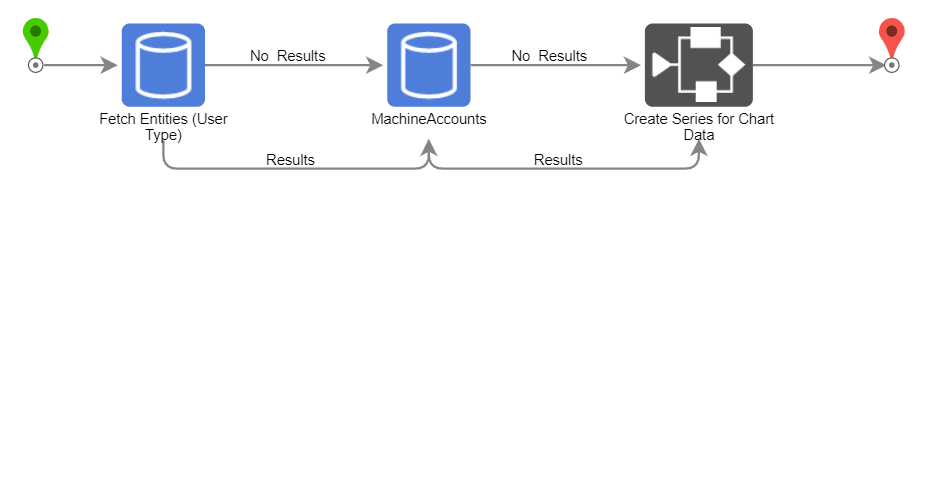
The Fetch Entities steps fetch Accounts by User Types of Person and Machine. The subflow creates the series for the chart using ChartRenderData.
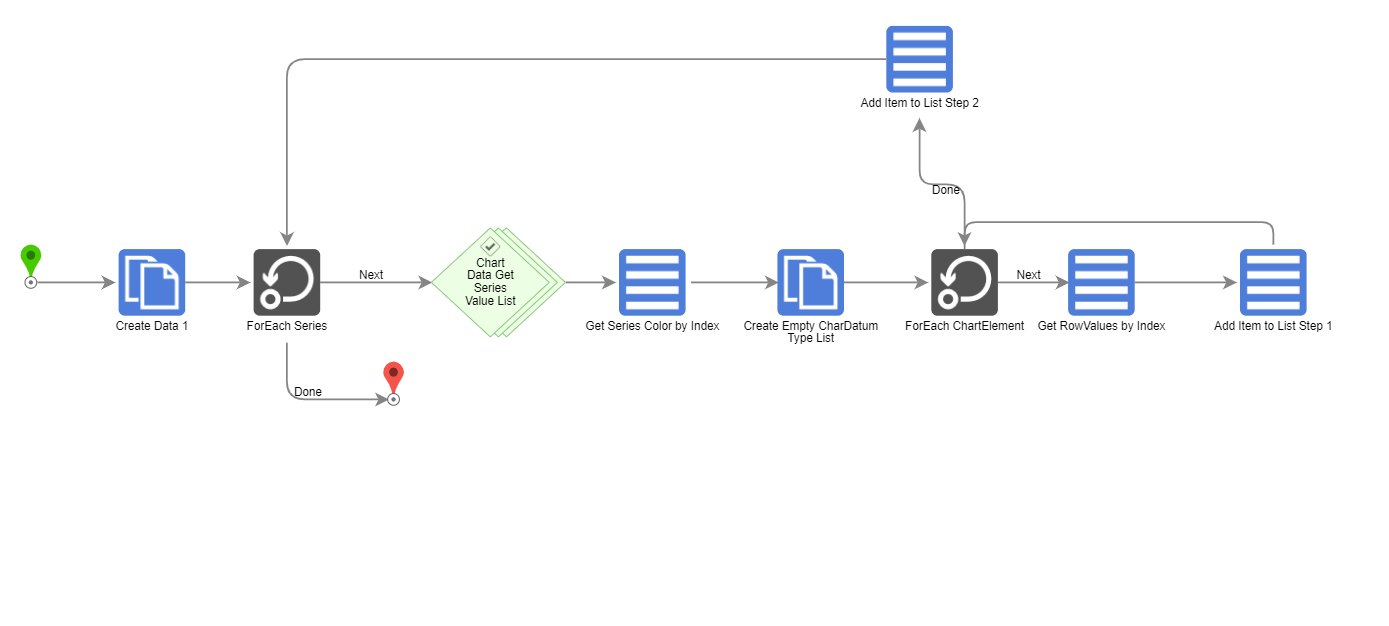
Each individual ChartRenderData makes up one series of data for the Chart; this allows the user to customize different series differently. Each series contains different pieces of the Chart, for instance, the slices on a Pie Chart are individually structured as the ChartDatum type. A series of ChartRenderData contains a list of ChartDatum. In this ChartDatum type, there are several fields: Title, Label, and Display Label that can all be mapped in and treated as the same value. The boolean Navigable determines whether or not something can be drilled into when selected. The Value decimal is the actual amount allotted to that piece of the chart.