Overview
Example Lab Details | |
| Version | 6.9.2 |
| Root Folder | Example Lab - Diagram Tile |
| Modules | None |
| Dependencies | None |
This Example Lab project demonstrates how to create a diagram tile that displays a count of current user accounts.
Explanation
This project displays a tile with a count of current accounts on the user's local Decisions instance. The tile design and style are created using the Example Tile Flow. Here you could change the shape, font, background color, etc., for the actual tile's look and feel. You can also set up an action to be executed when clicking the tile displayed on the page. In this example, there is an action setup that, when executed, runs the Flow "Display Account." This Flow uses the Fetch Entities step to get the account data and then displays a customized portion of that data in a Form using the Data Grid Form component. In this Form view, you can see each account included in the total count and some relevant data associated with each account.
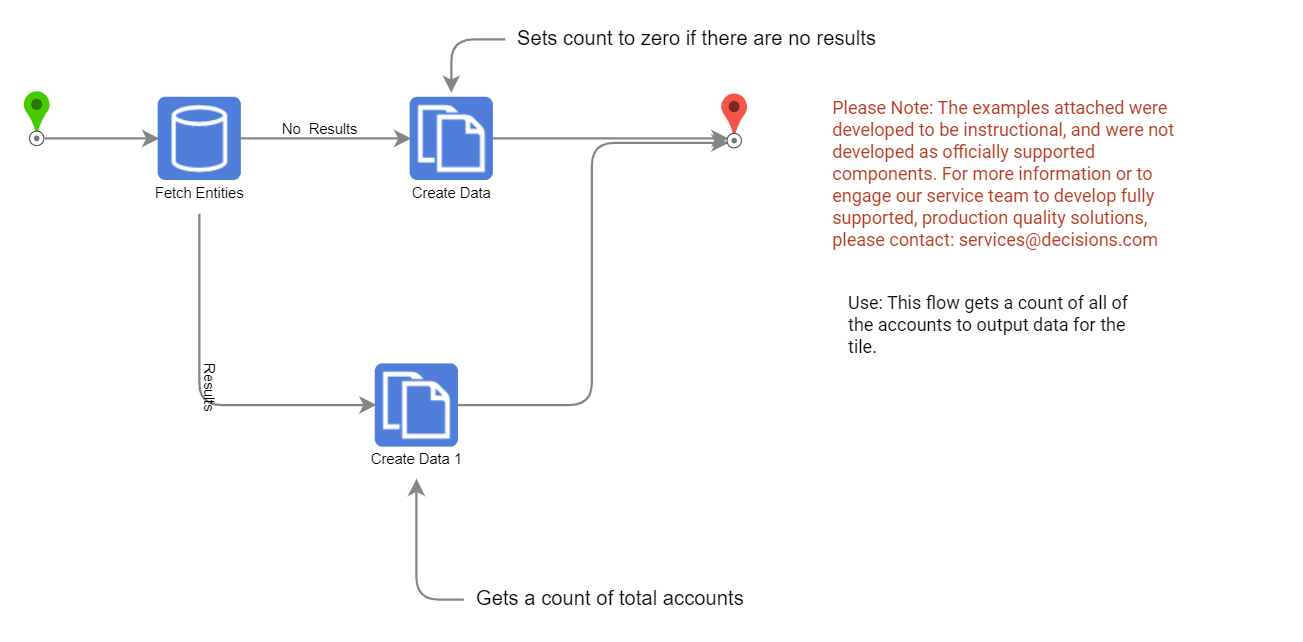
The actual count displayed in the middle of the tile is acquired using the Dash Page Input Flow. This Flow again uses the Fetch Entities step to acquire the user's account data. The Flow will then continue to the Create Data step. Whether the Fetch Entities step acquired results or not, the Create Data step will either pass the count of all accounts or the default value of zero as the output of the Flow. The Flow's output is then populate the text in the Example Tile displayed on the Page.
