Overview
Diagram Tiles are components on a Page/Dashboard, and controls on Forms that are used to present data with infographics. These Tiles have a unique Designer Studio that resembles a Flow Designer but uses visual Charts, Shapes, Labels, Images, and more to create the content displayed on the Tile.
Diagram Tiles require both a Diagram Tile Flow as well as an Input Flow to supply the Tile Flow with source data. The following document demonstrates how to create a Diagram Tile that displays an image as well as a Label of the number of Accounts within a Decisions environment.
Utilizing Diagram Tiles on a Page/Dashboard
- Create a new Page in a Project.
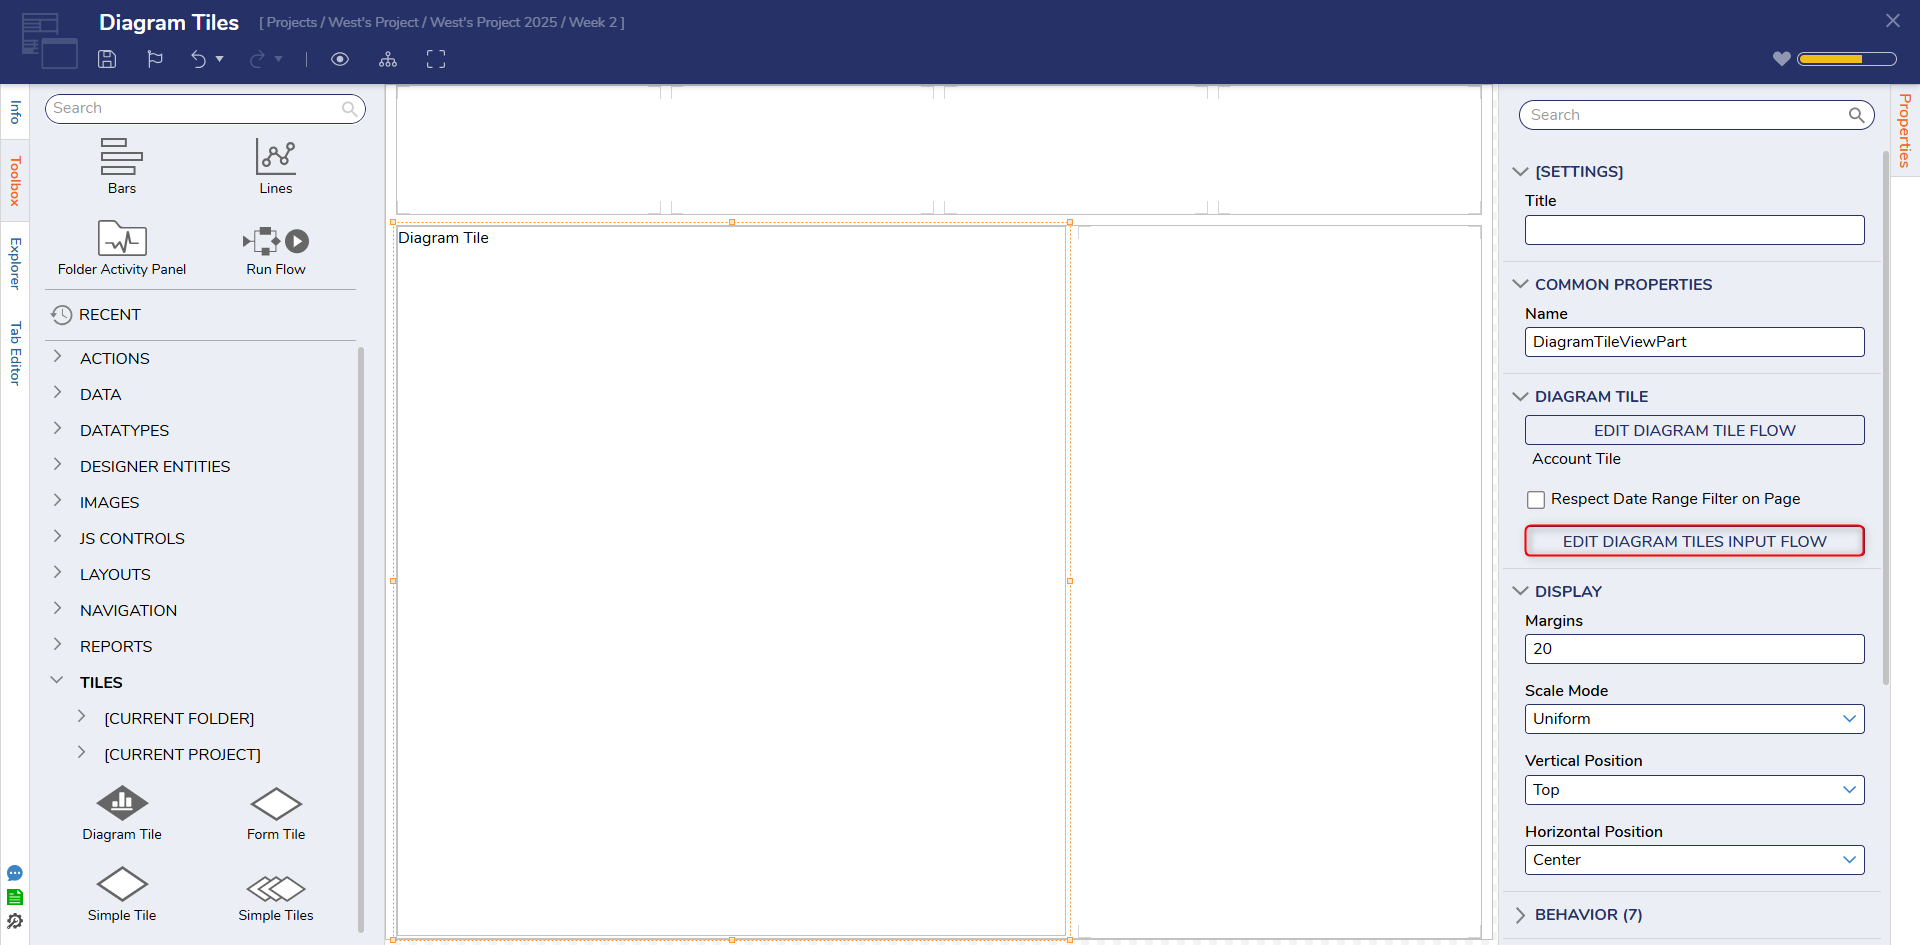
- From the Page Designer, under Toolbox > TILES, add a Diagram Tile to the workspace.
From the Properties tab of the Diagram Tile, select PICK OR CREATE DIAGRAM TILE FLOW. Then, CREATE a new Diagram Tile.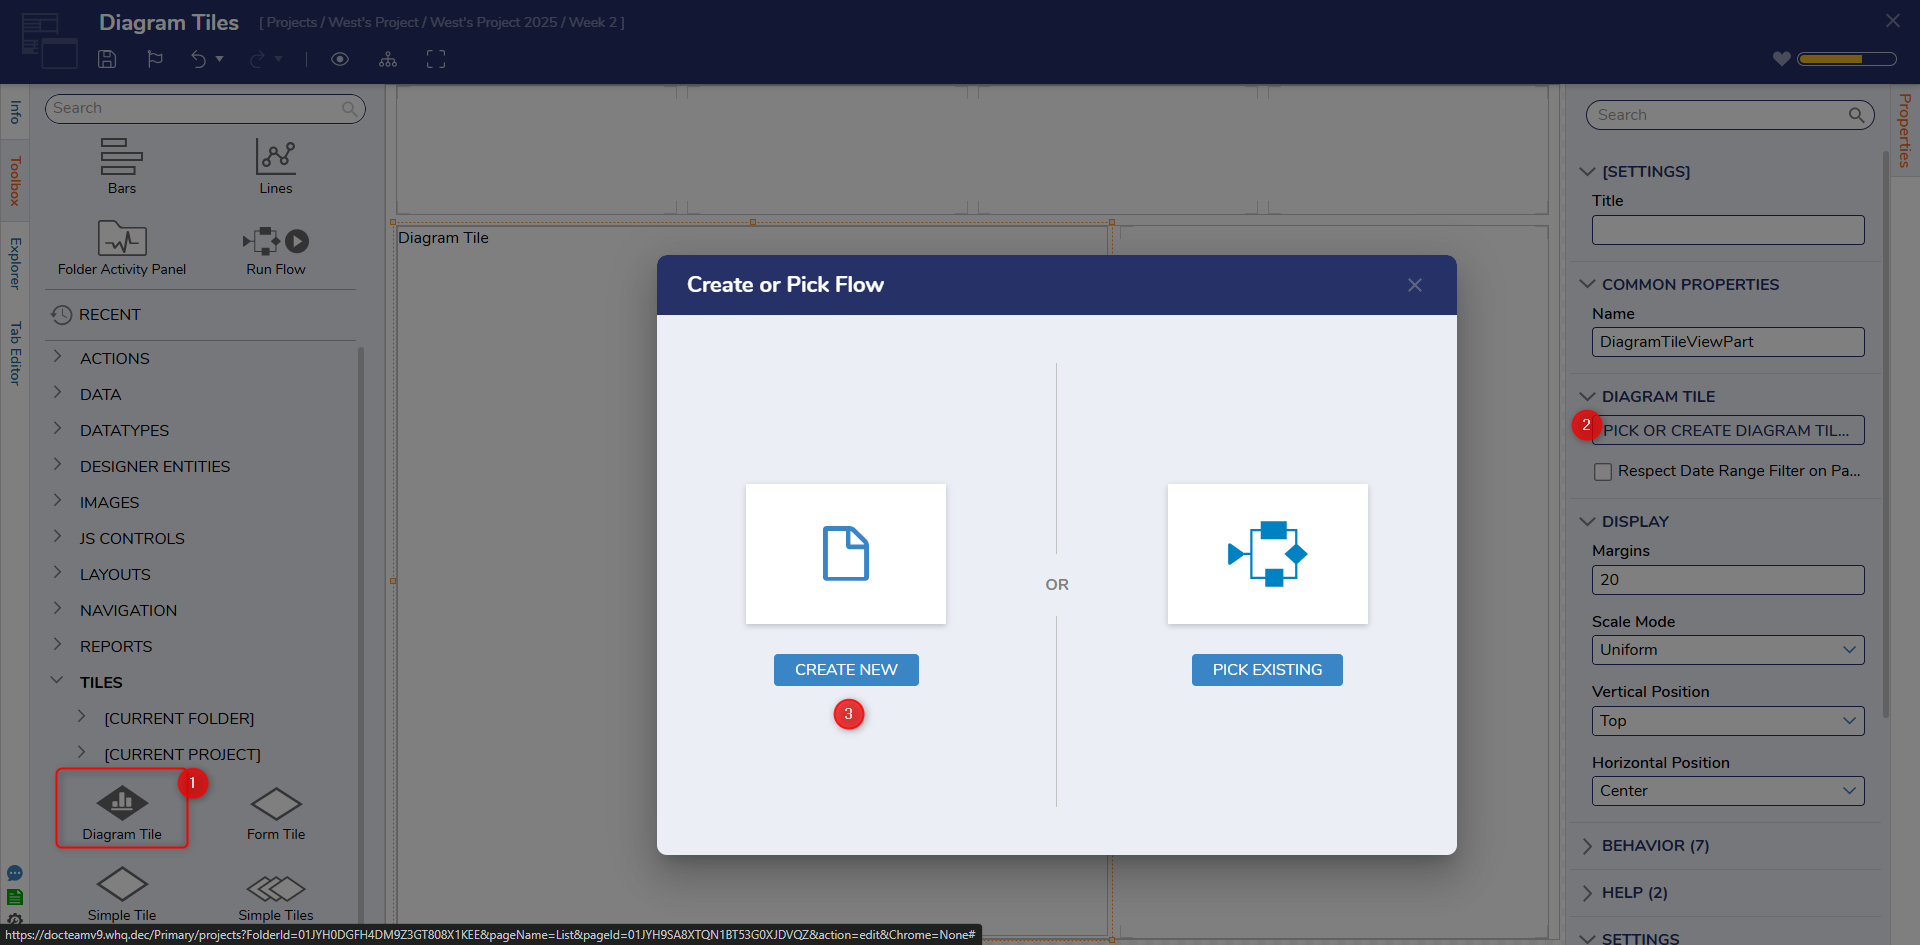
- From the Diagram Tile Designer, under the top Action Bar, click SETUP INPUT DATA. From the Input Data window, provide a NAME for the data.
Then, select Int32 from the TYPE dropdown, and Save and close the window.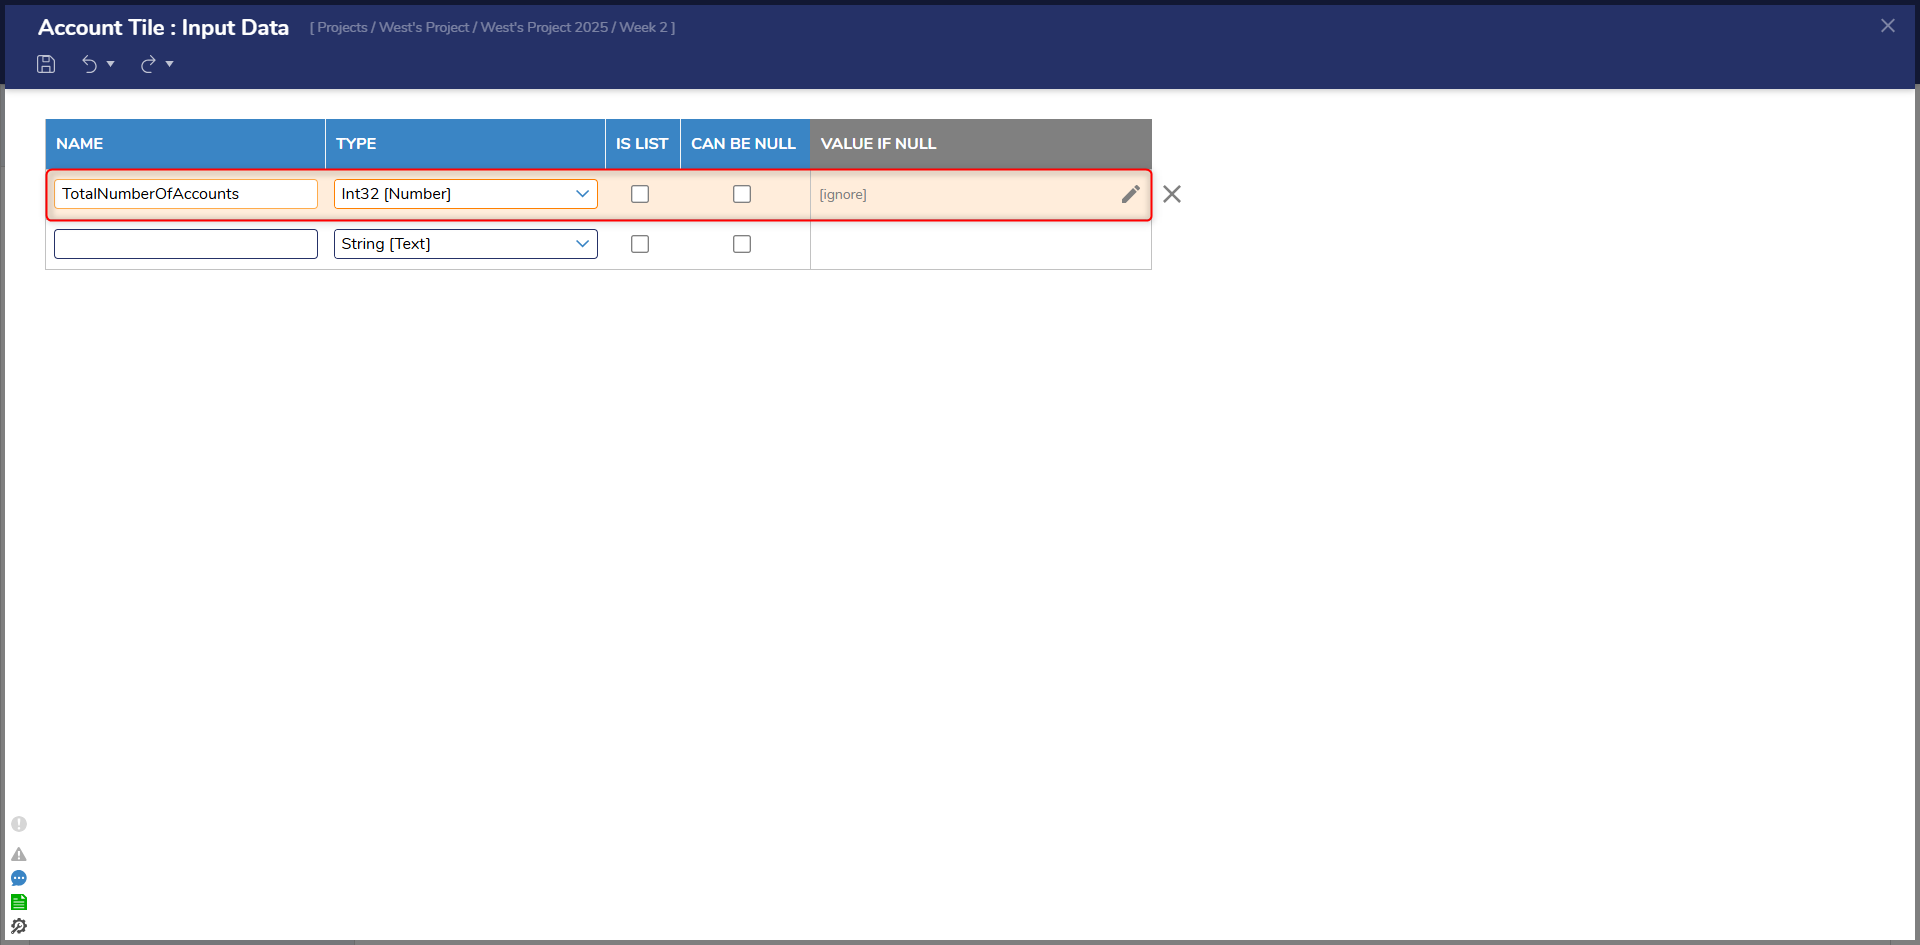
- Under Toolbox > ANNOTATION, drag an Image component into the workspace. If desired, under CONFIGURATION DEFAULTS, adjust the Background Color, Border Width, Z-Order, and/or provide a Label.
Then, under IMAGE, select the Edit button and the Pick Image window to select the desired Image.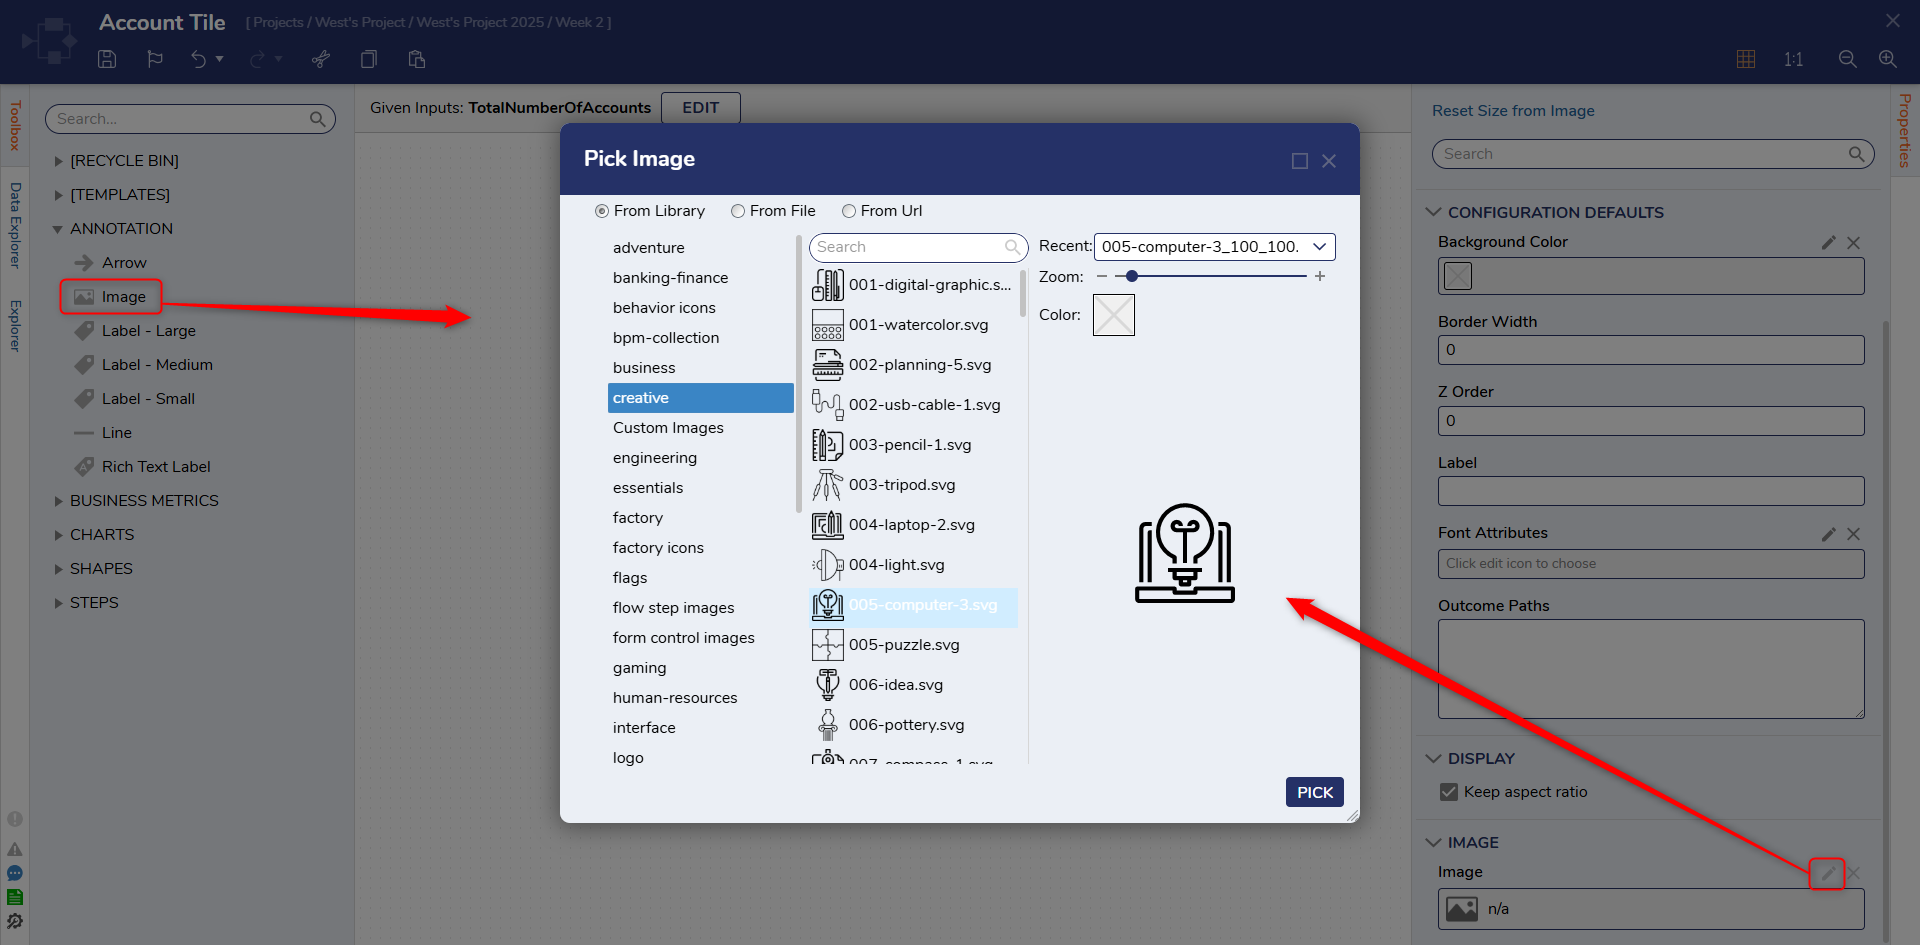
- While still in the ANNOTATION category, add a Label - Medium to the workspace.
From the Properties tab of the Label, under CONFIGURATION RULES, enable Label From Data.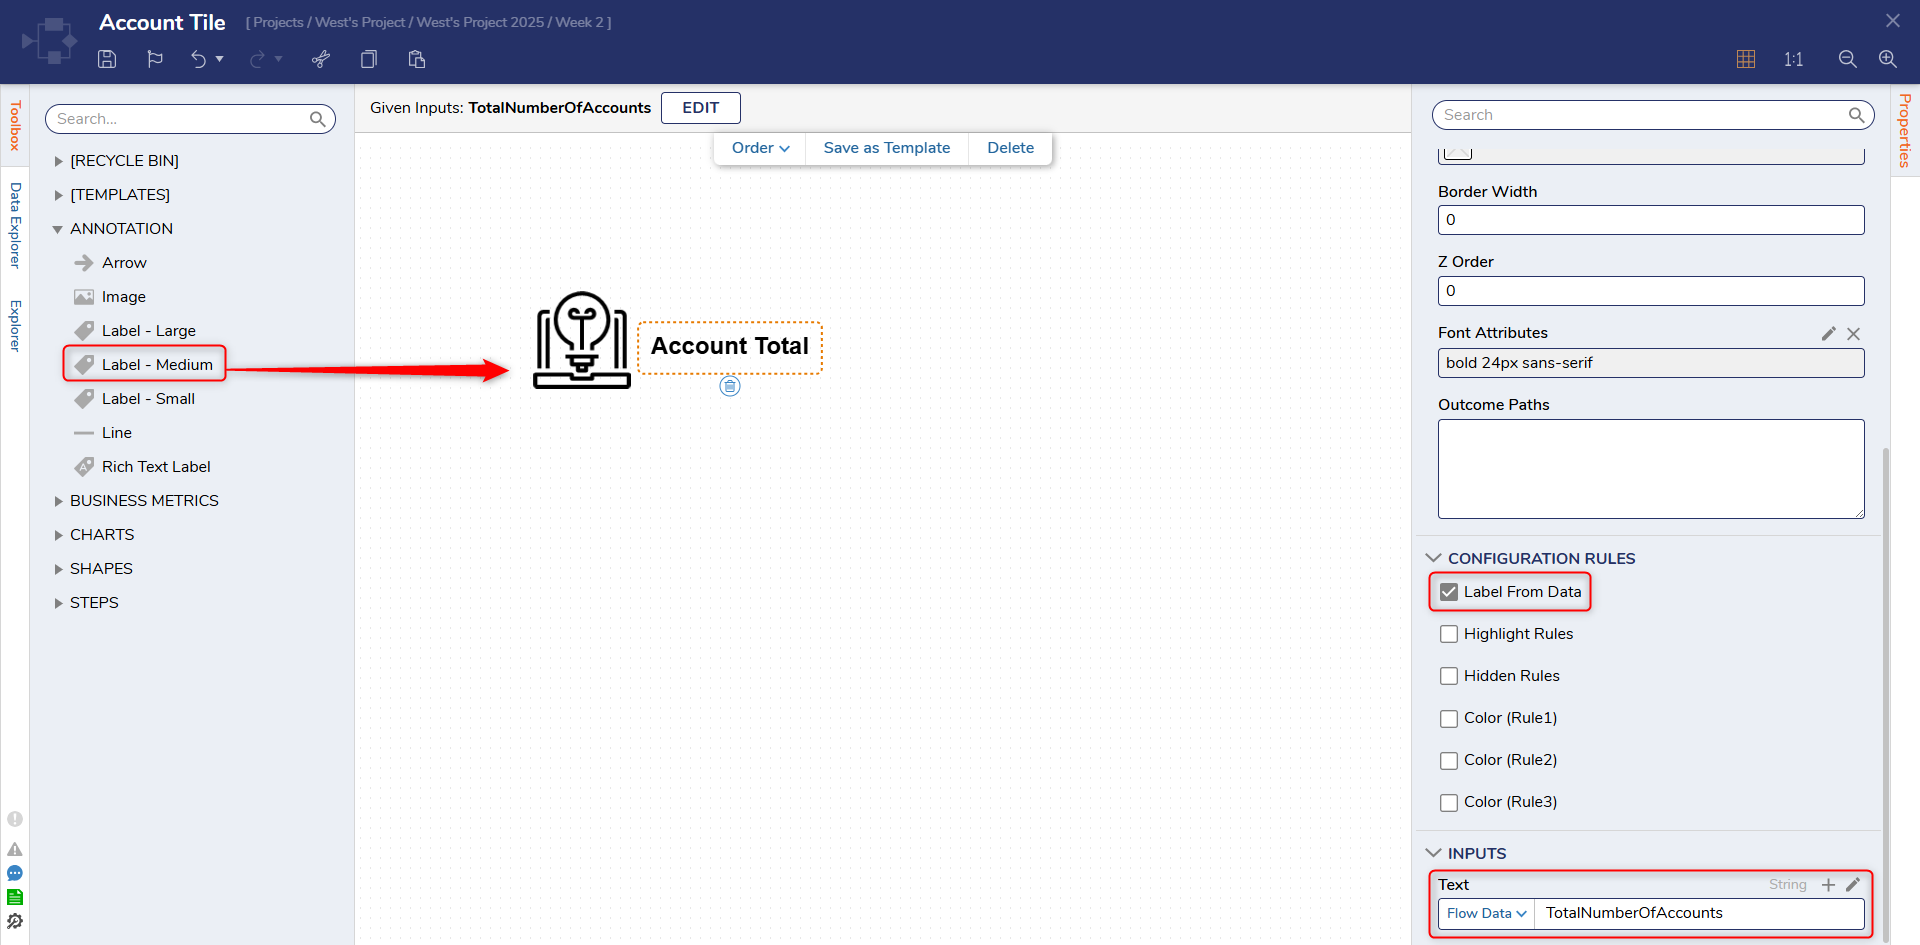
- Save the Diagram Tile Flow, then close via X.
- Back in the Page Designer, under the Properties for the Diagram Tile, select EDIT [PAGE NAME] INPUT FLOW.
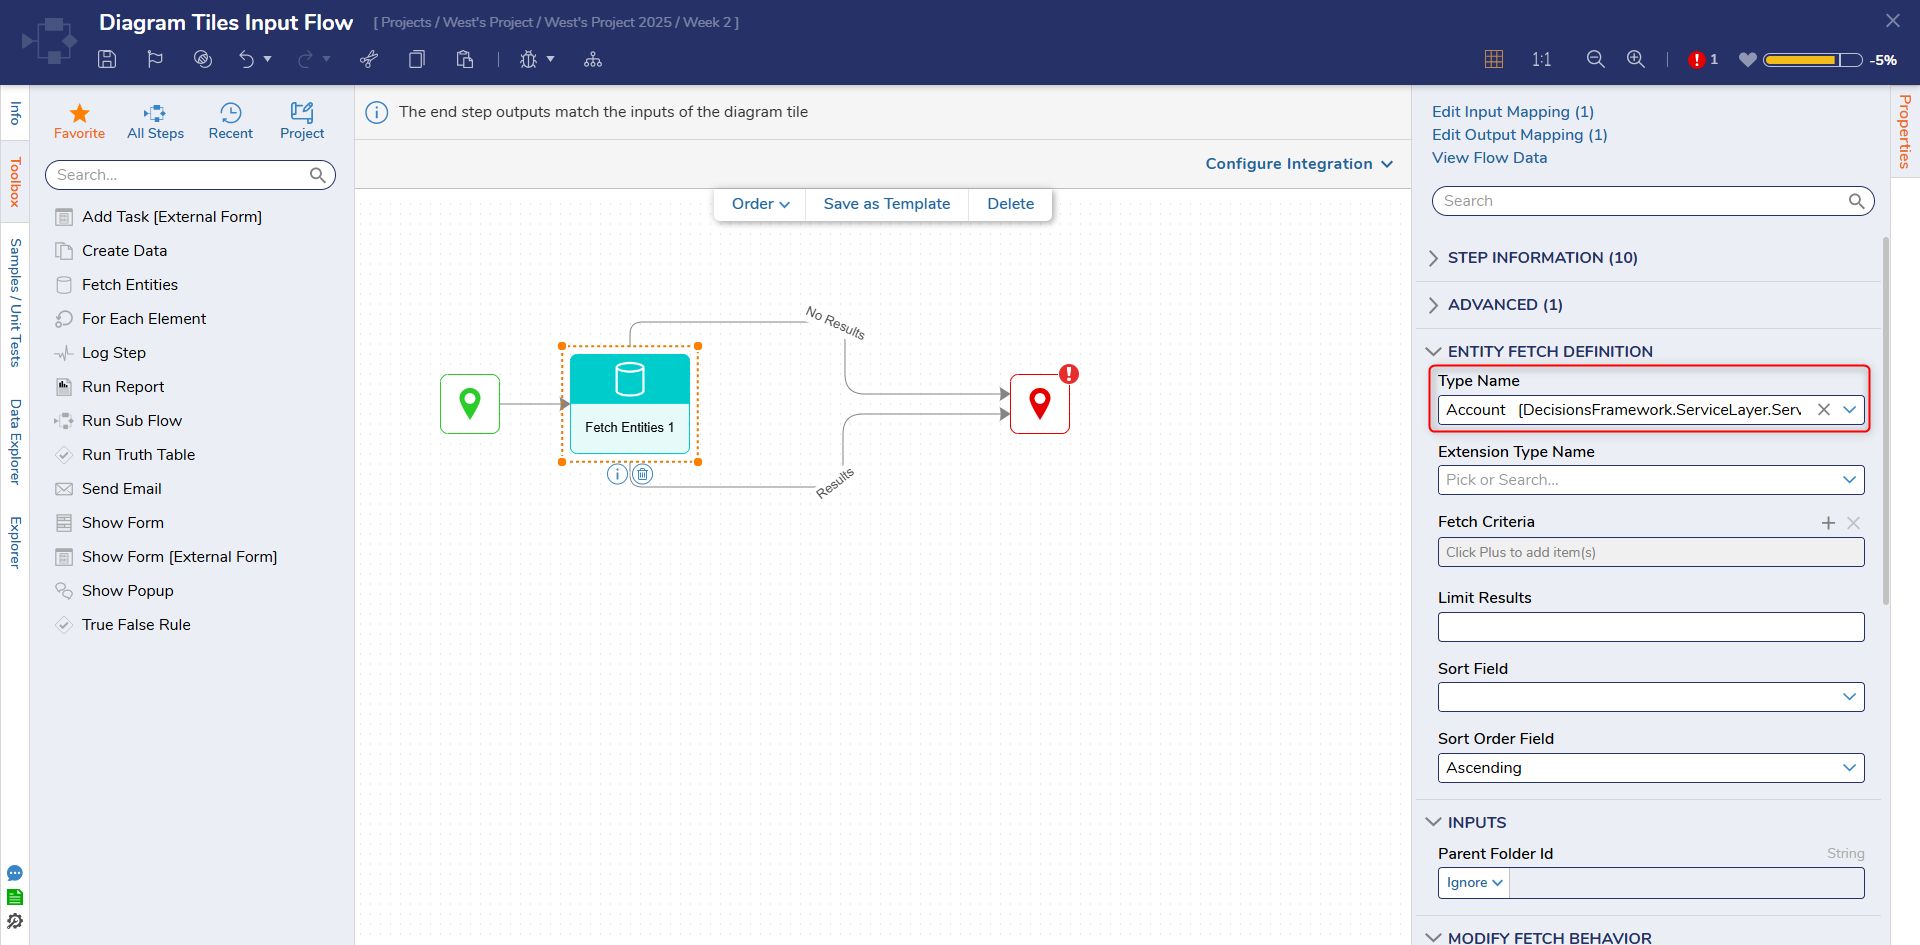
- From the Flow Designer for the Input Flow, attach a Fetch Entities step from FAVORITE STEPS to the Start step. Then connect both Outcome Paths to the End step.
- From the Properties tab of the Fetch Entities step, under ENTITY FETCH DEFINITION, search for and select Account from the Type Name dropdown. Account cannot be selected from the initial dropdown list, it has to be searched for first.
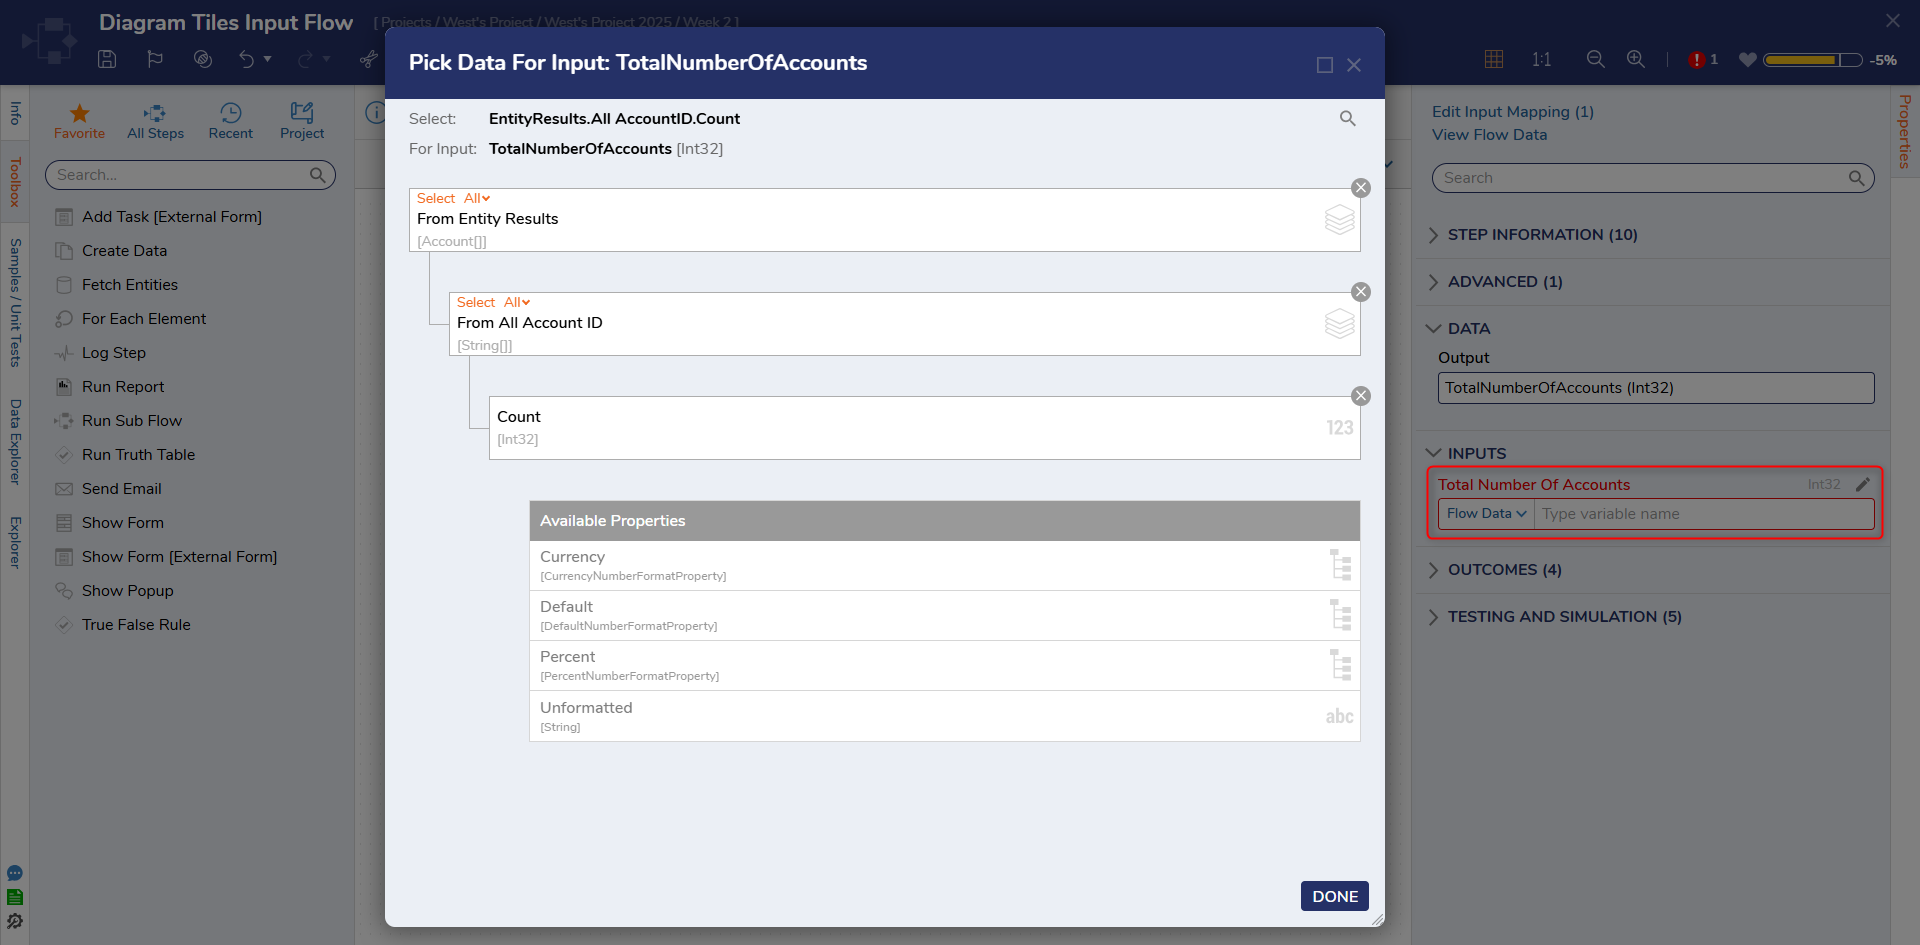
- From the Properties of the End step, map EntityResults.All AccountID.Count to the Input Data.End Step Input DataMapping the Output Entity Results.All AccountID.Count to the Input Data of the End step will allow the Tile to display a count of the retrieved Account ID's in the environment.
- Save and close the Flow Designer.
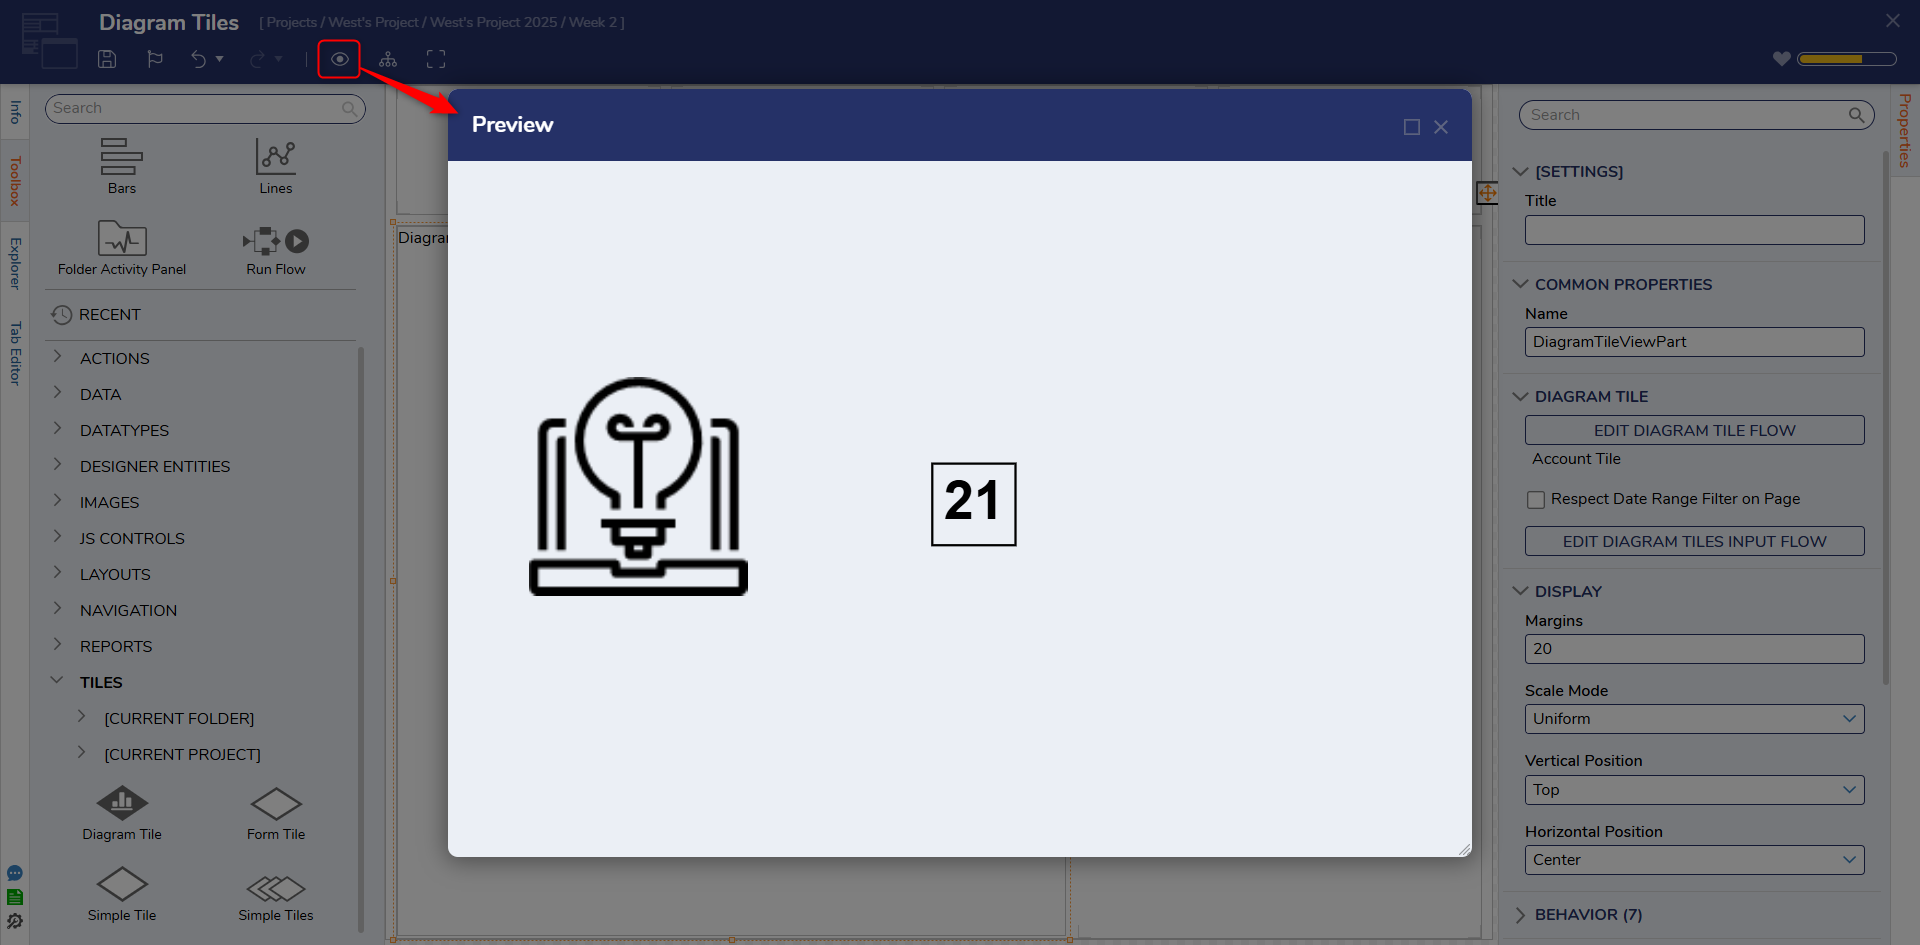
- Back in the Page Designer, select the Preview button on the top Action Bar; verify that the Diagram is displaying the Image and Label text as configured.
Utilizing Diagram Tiles on a Form
The following example demonstrates how to utilize Diagram tiles within a Form. The example will produce a tile that displays a name, date of birth, and their age.
- Start by creating a Form with a Diagram Tile Control and Button(change the name to Close)
- Both of these controls can be found in the Toolbox.
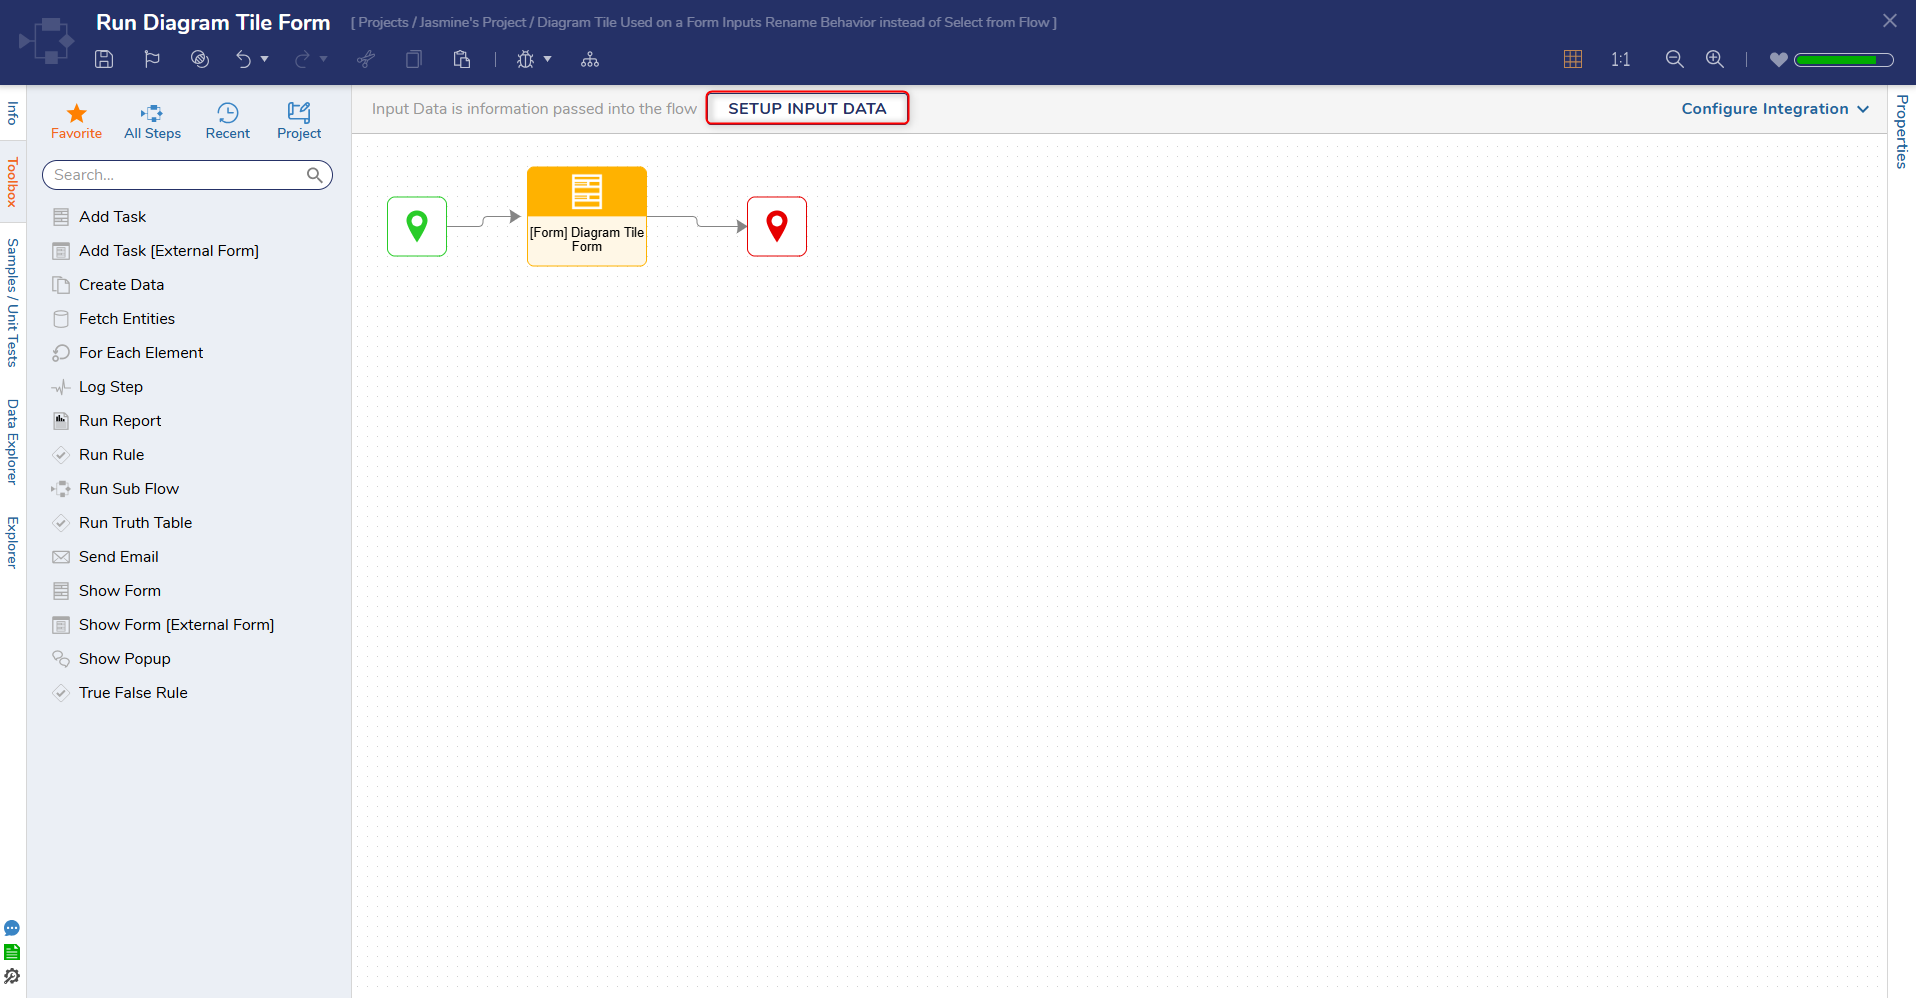
- Navigate to the Properties Panel and select Edit Diagram Tile Flow under Diagram Tile.
.png)
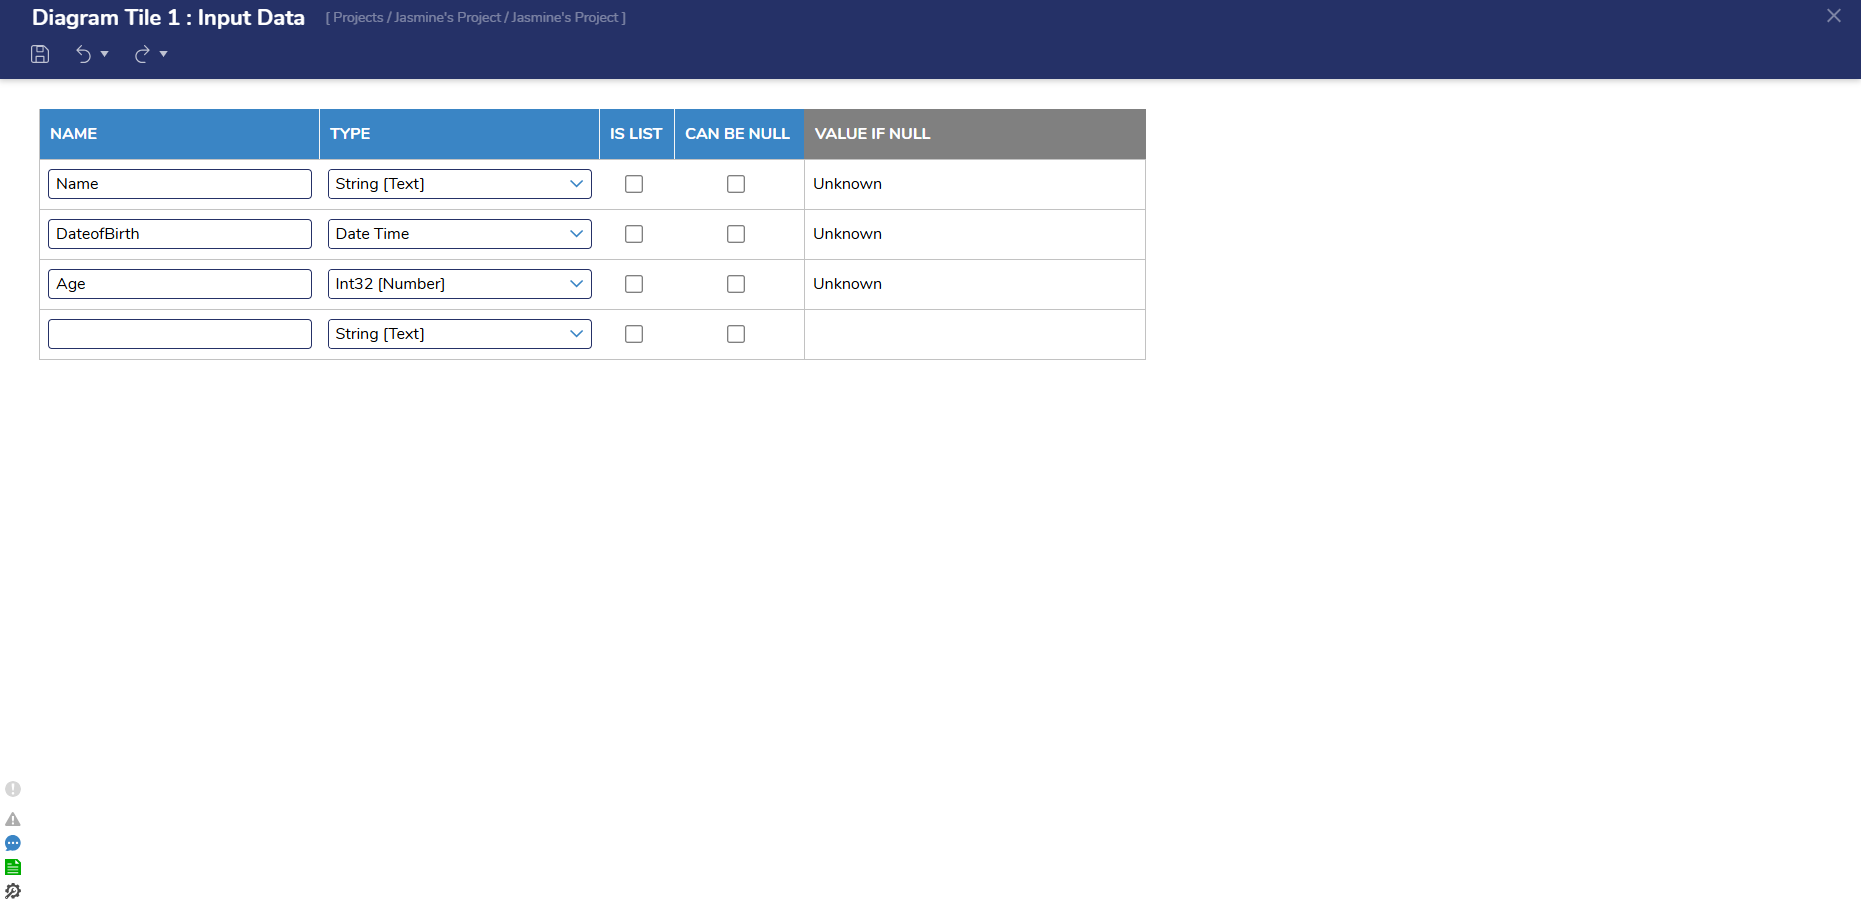
- From here, click Setup Input Data.
- This action will display the Input Data Form. Add the following Inputs to the table:
- Name(String)
- DateofBirth(DateTime)
- Age(Int32)
- String(Text)
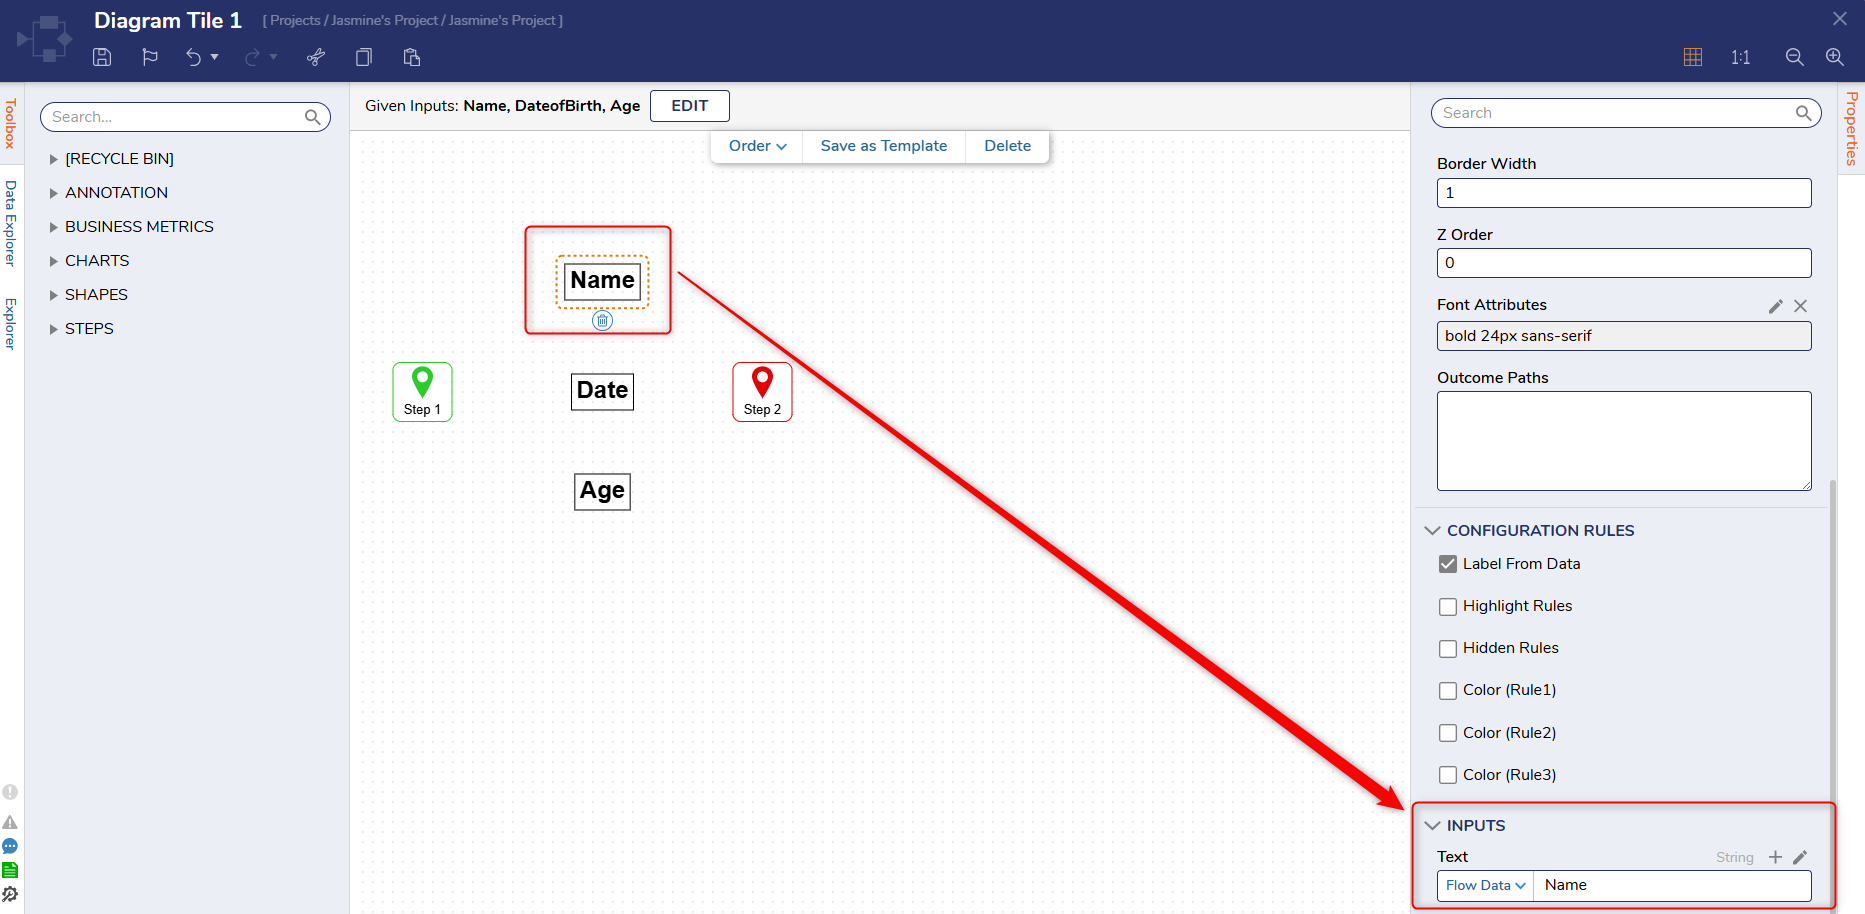
4. Then, navigate to the Annotation category and drag three Label-Medium Steps to the workspace.
5. Navigate to the Steps category and place a Start and End Step onto the workspace.
6. Once all the Steps have been added to the workspace, add the following Input information. These inputs will be what is displayed on the Diagram Tiles once the Form is debugged.
| Step Name | Inputs | Mapping |
|---|---|---|
| Name | Text (String) | Name |
| Date | Text(String) | DateofBirth.Formatting.ShortDate |
| Age | Text(String) | Age.Default.AllDecimals |
7. Once all the Inputs have been added, click Debug to run the Flow. Inputs that were mapped on the Form will be displayed on the Diagram Tiles.