Overview
Calculated Fields transform the values of other fields to create entirely new values. Report Matrixes display a count of how many records match each value reported in a column or Calculated Column. Each column in a Report Matrix is referred to as a dimension and multiple dimensions can be compared along the x- and y-axes of the Report matrix.
Example
For this example, add a Calculated Column to a Report, configure the Matrix view to include the new column, then run the Report to view.
Prerequisite
The Report Matrix used in this example was created in the Creating and Drilling Down into Report Matrix Data article.
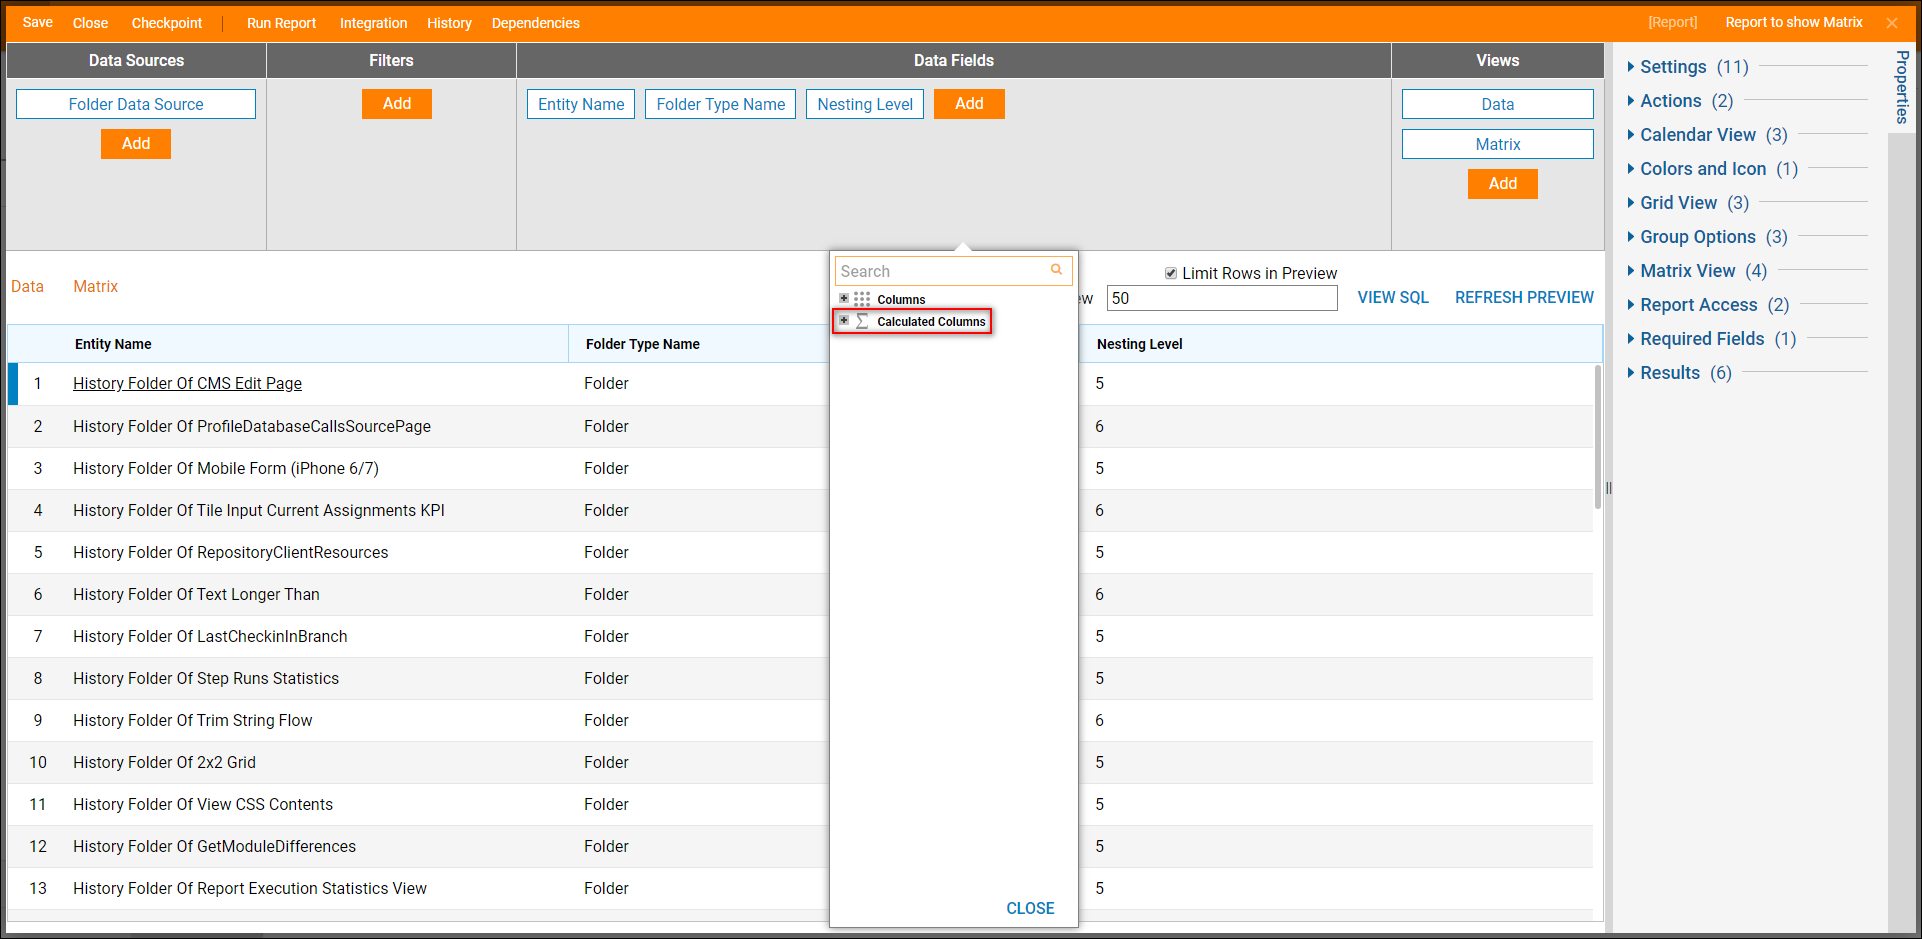
- Begin in the Report Designer, expand the Calculated Columns category under Data Fields.
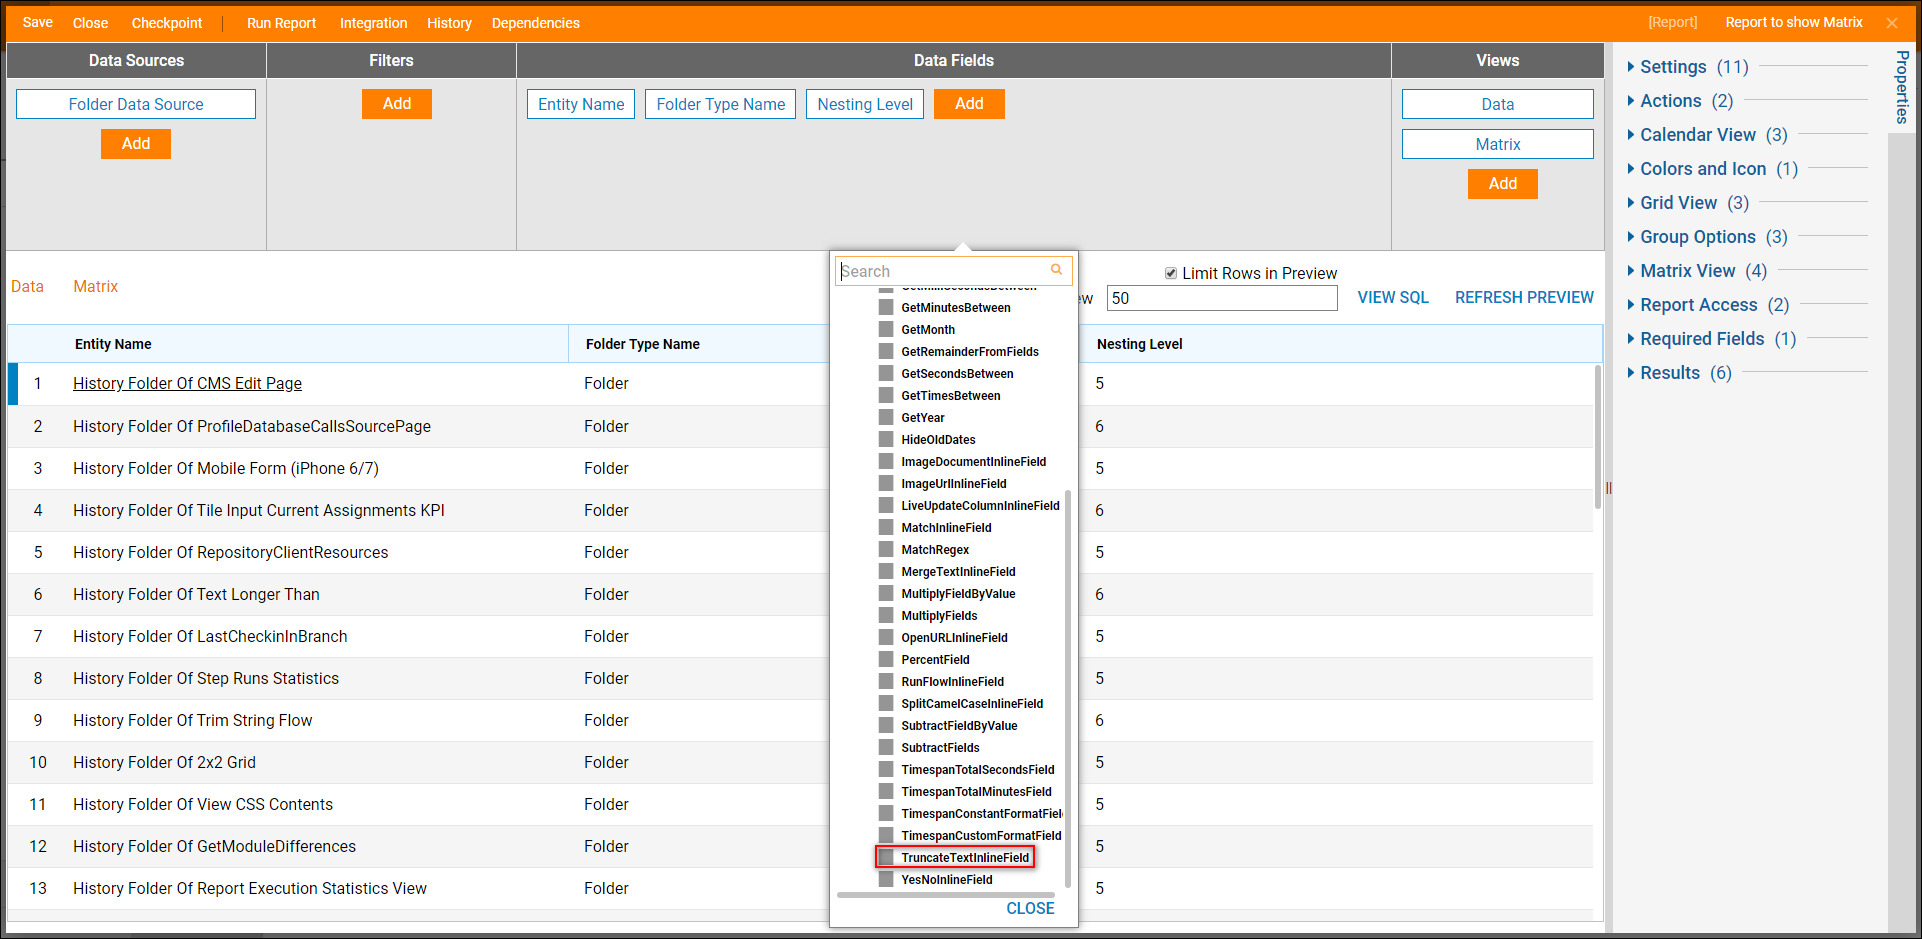
- Select the TruncateTextInlineField option and add it to the workspace.
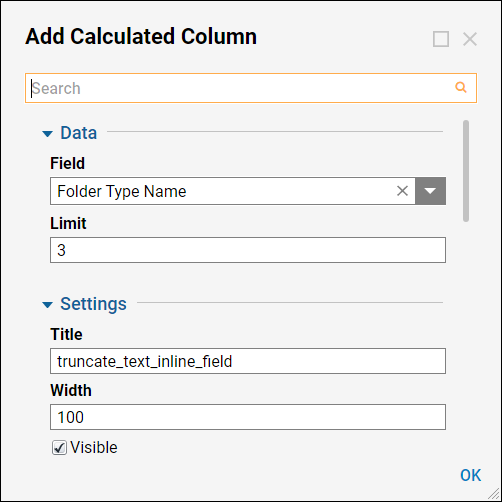
- In the resulting Add Calculated Column dialog, configure the Calculated Column. This column will display the truncated value of another column.
- For this example, configure the column to display the first three letters of the Folder Type Name column.
- Select Folder Type Name in the Field drop-down list and type “3” in the Limit field.
- Select OK to finish the Calculated Column.
- The new Calculated Column, truncate_text_inline_field, appears in the workspace.
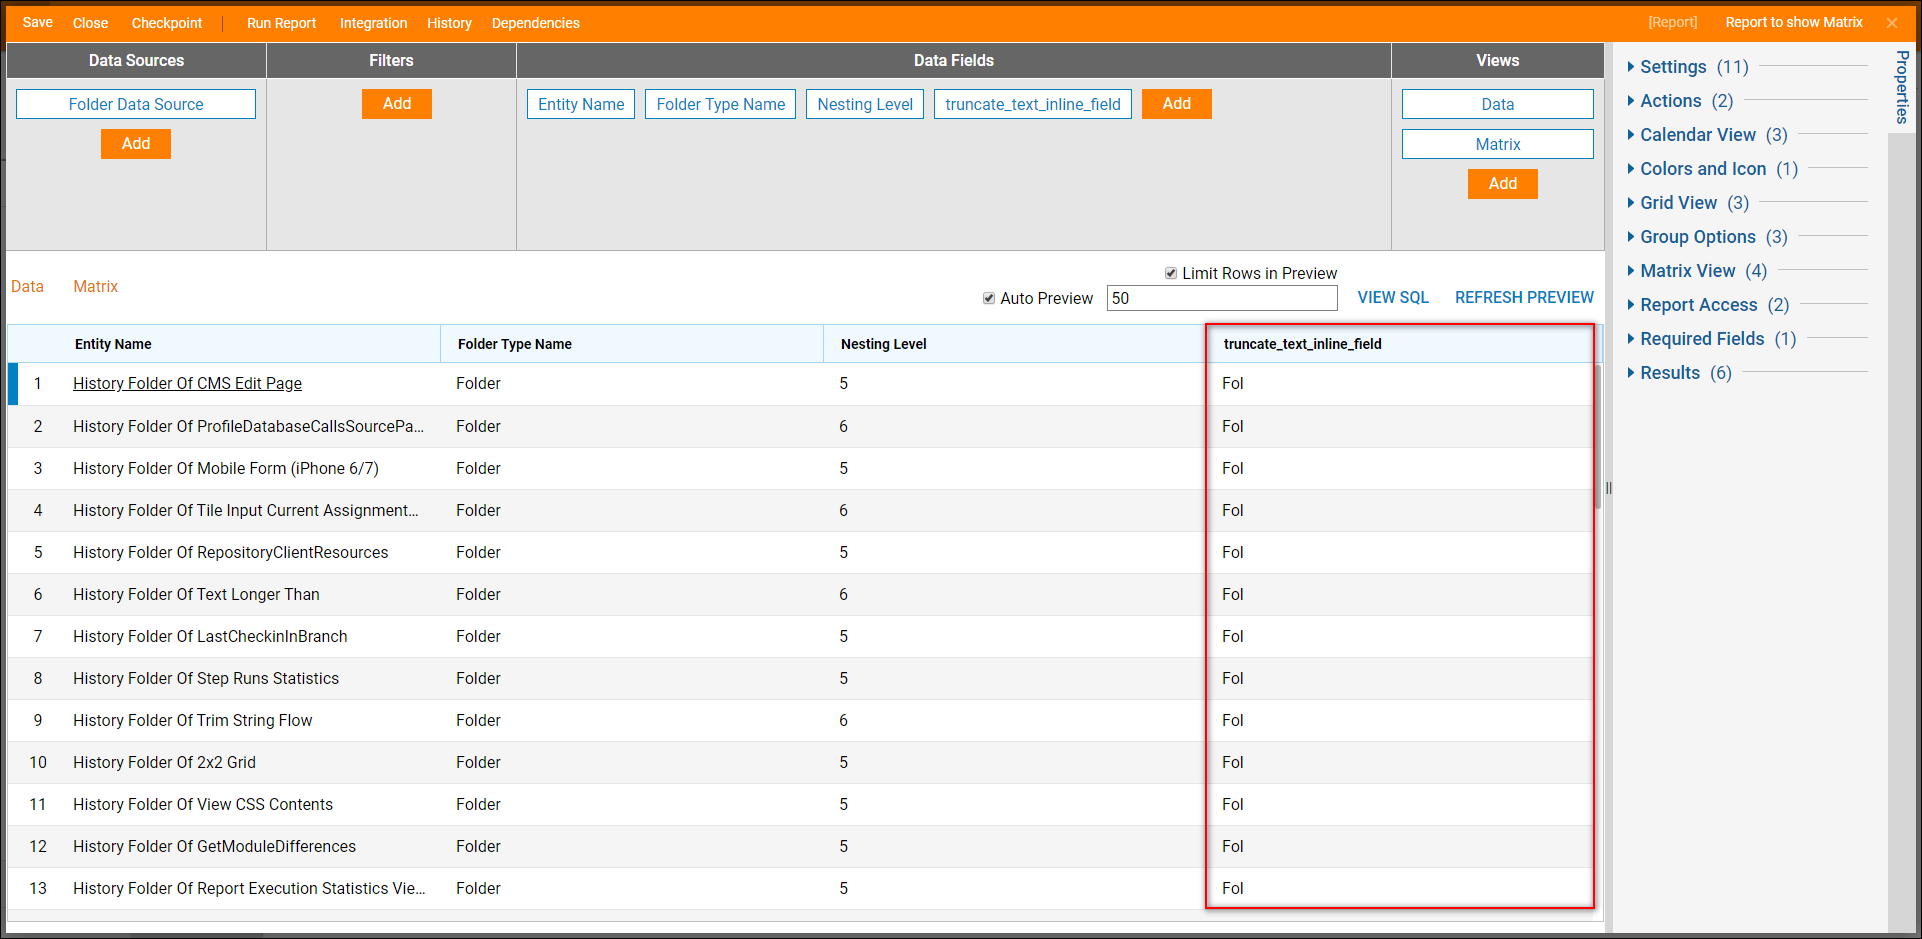
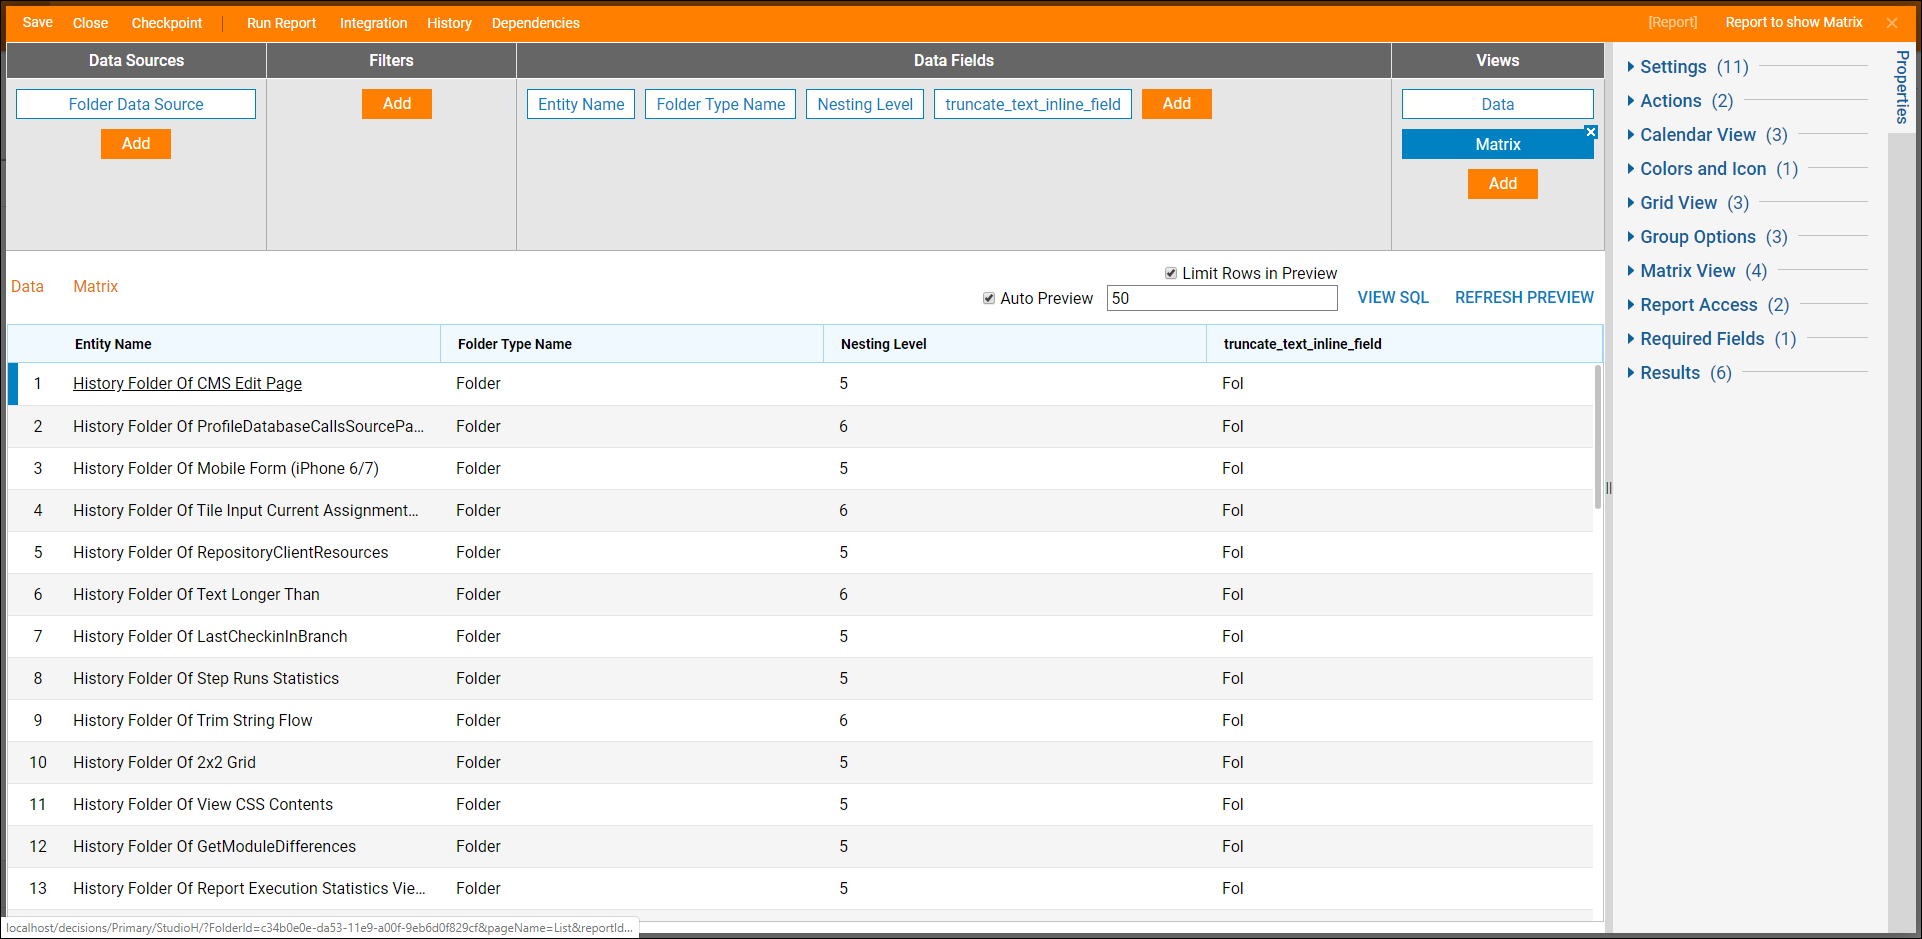
- Select the Matrix view to edit the existing Matrix.To learn how to add a Matrix view to the Report navigate to Creating and Drilling Down into Report Matrix Data.
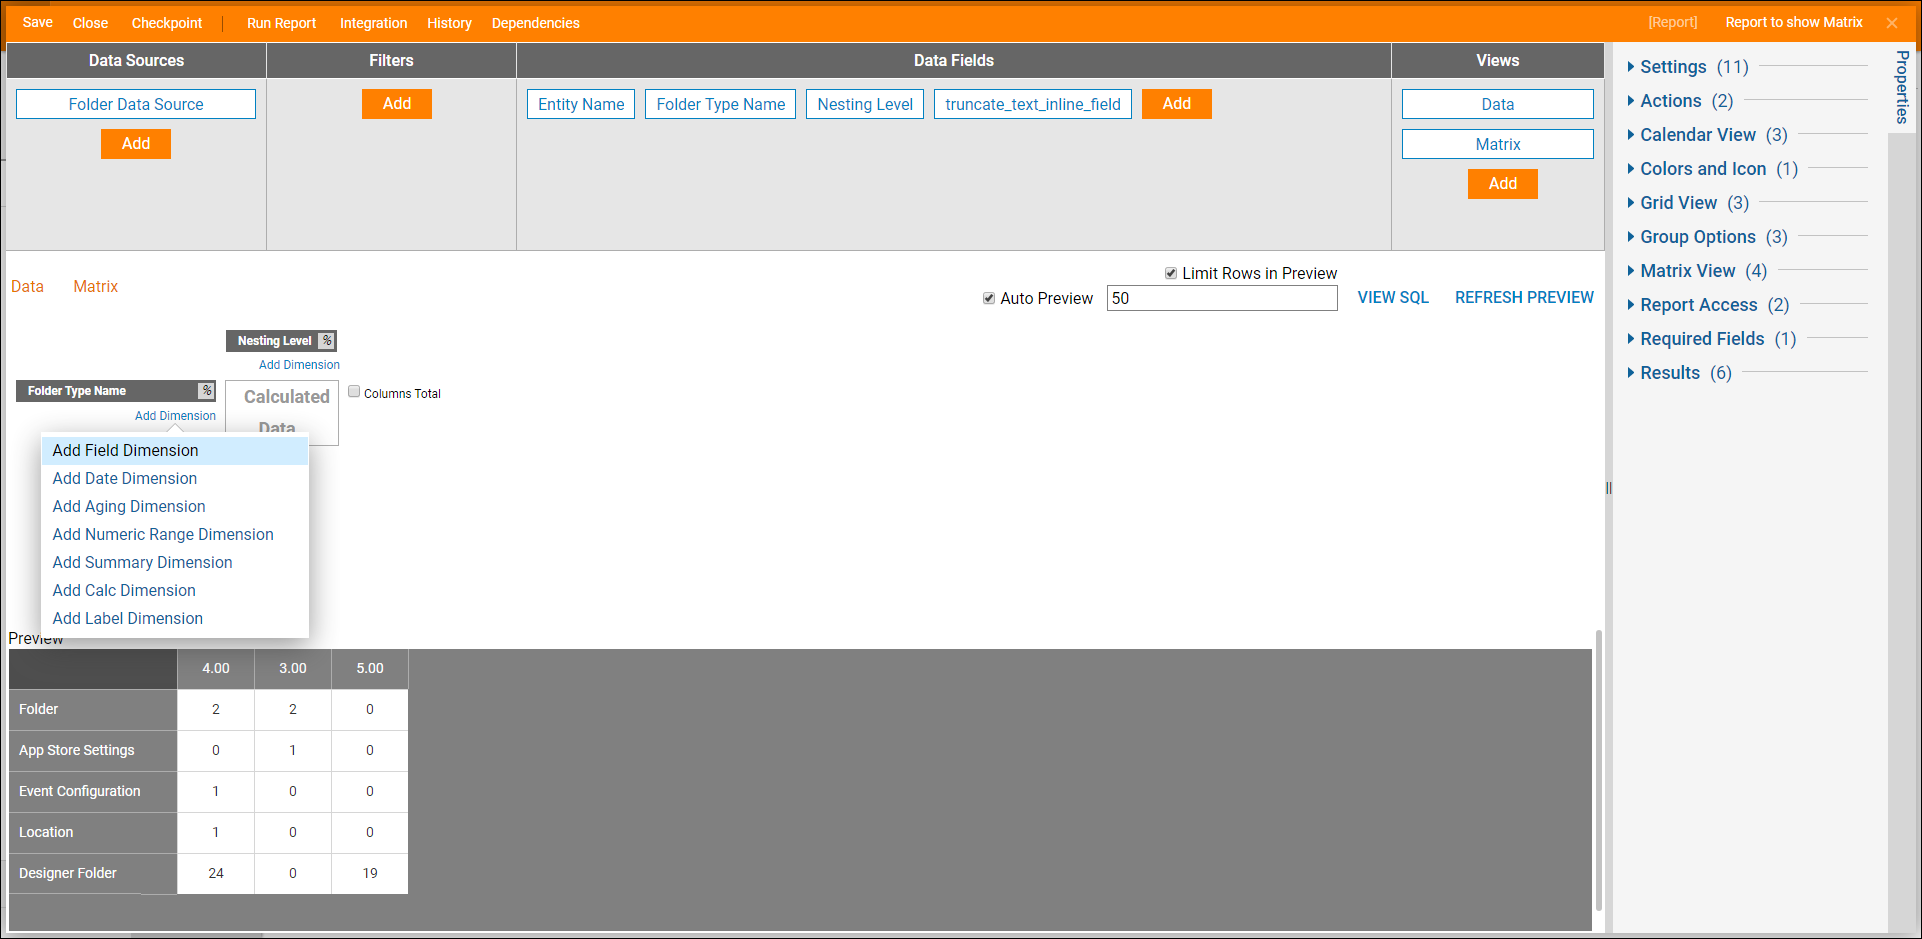
- When the Matrix view opens, select the Add Dimension link corresponding under the already configured Folder Type Name on the y-axis and select Add Field Dimension.
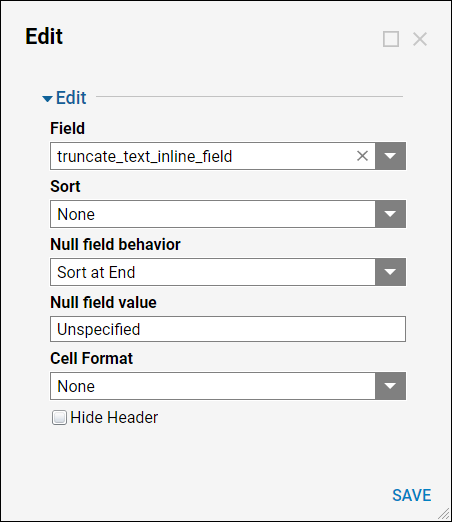
- In the Edit dialog, select truncate_text_inline_field in the Field drop-down list and select Save.
- Select Run Report in the top action panel in the Report Designer.
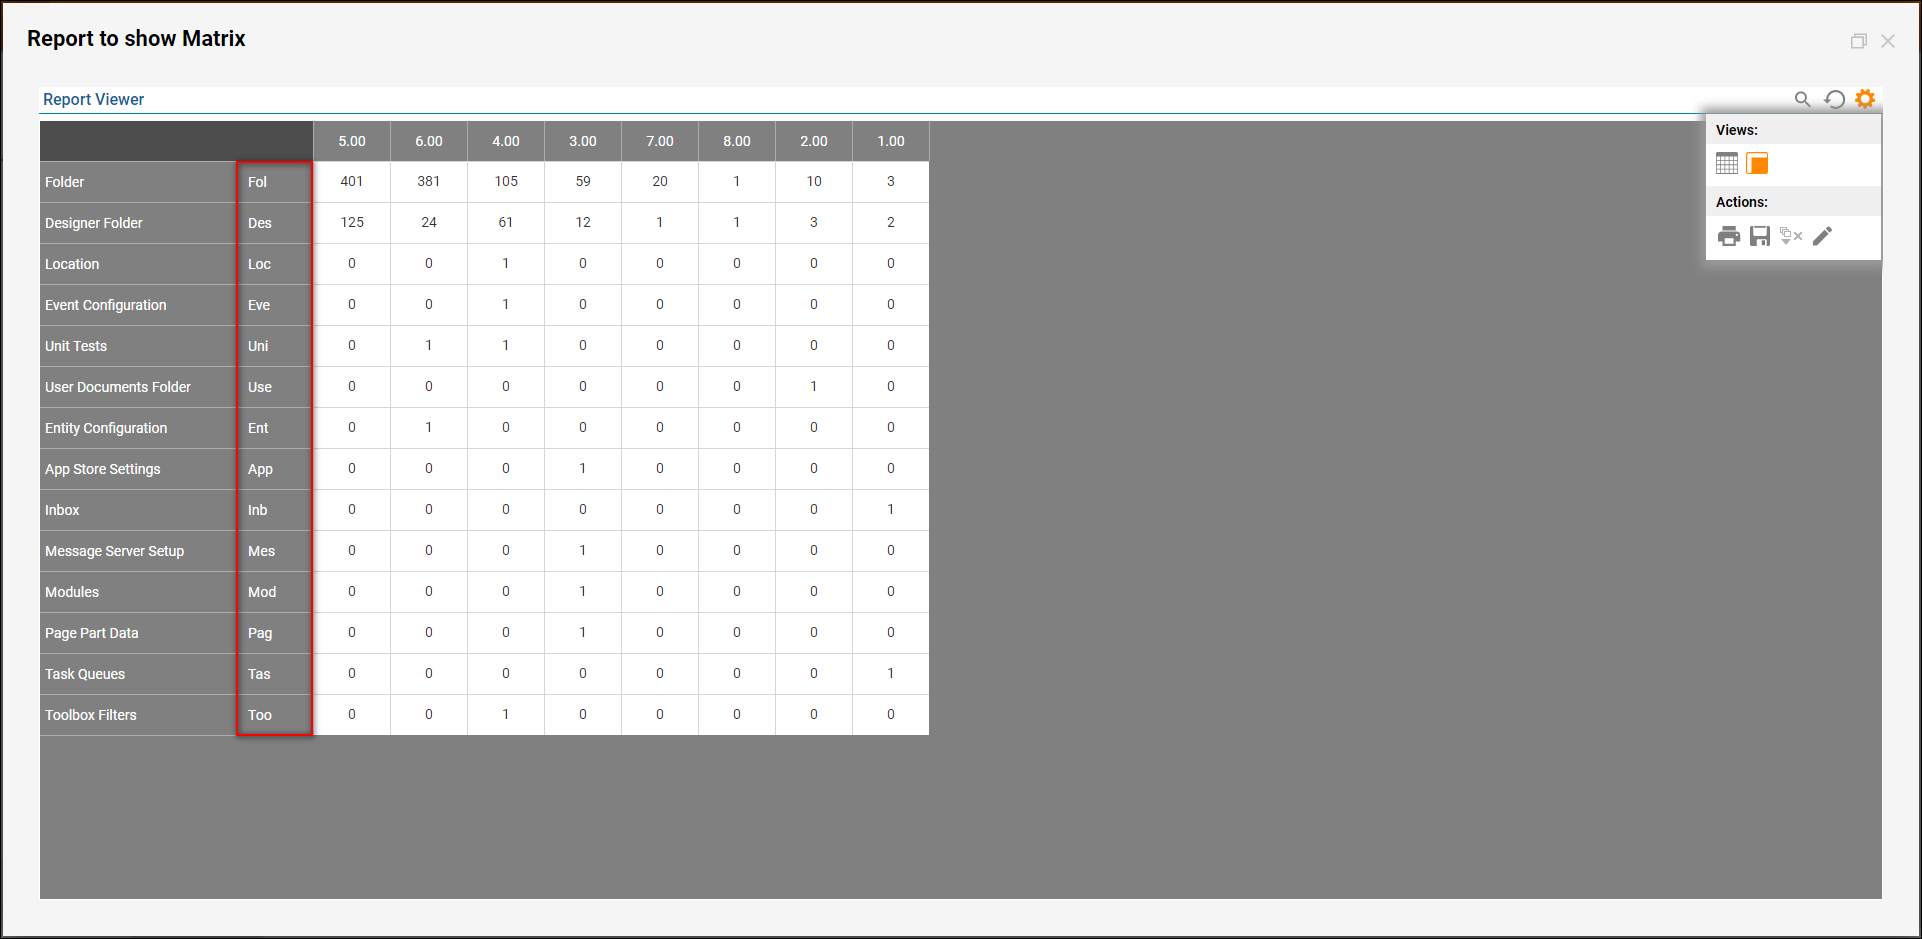
- The Report will appear in a new window. All of the columns, including the Calculated Column, will be displayed under the Data icon.
- Select the Matrix icon to see the Report matrix.
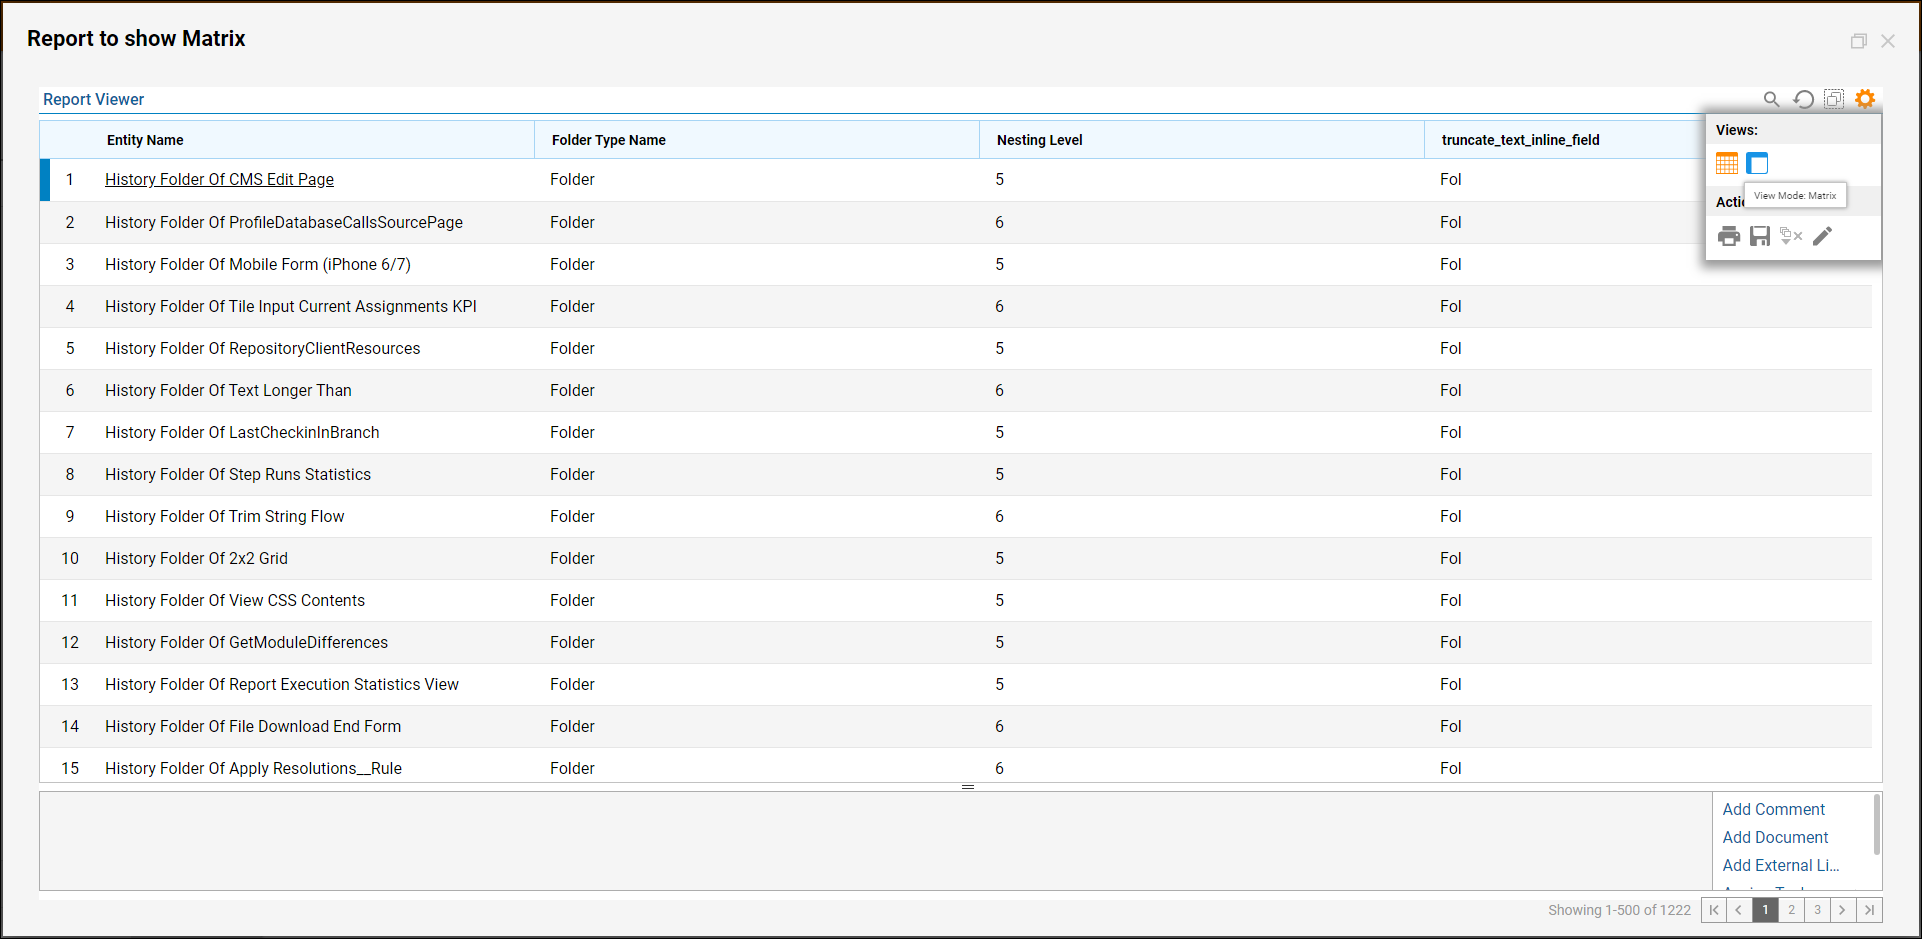
- The Matrix view shows the matrix Report and the Calculated Column that was just added.
