Overview
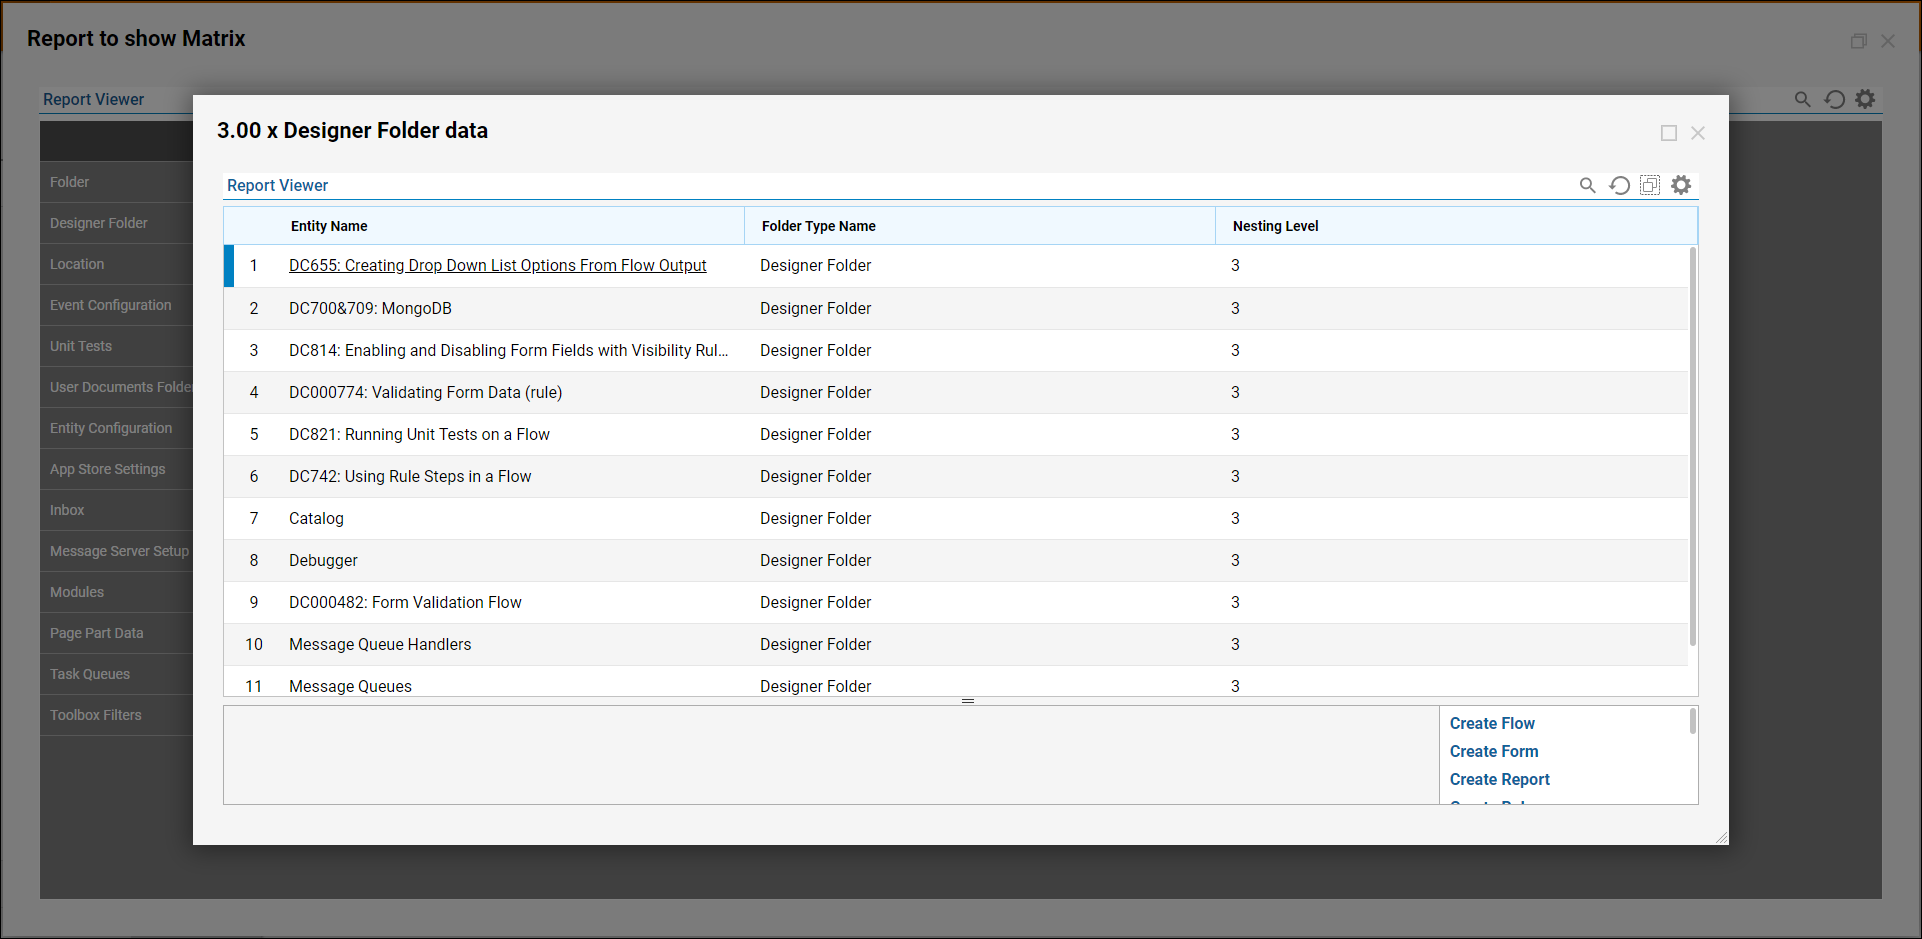
Report matrixes display totals of how many records match each value reported in a column. Each cell in the matrix doubles as a link to a drill-down Report. A drill-down Report breaks down the total and displays the column values for each matching entity. To view a drill-down Report, run the Report, then click on any cell in the Report matrix.
Example
In this example, add a matrix to a Report, run the Report to view the matrix. Then, select a cell in the matrix to view the drill-down Report.
- Begin by navigating to a Designer Folder.
- Select the CREATE REPORT button in the bottom action panel.
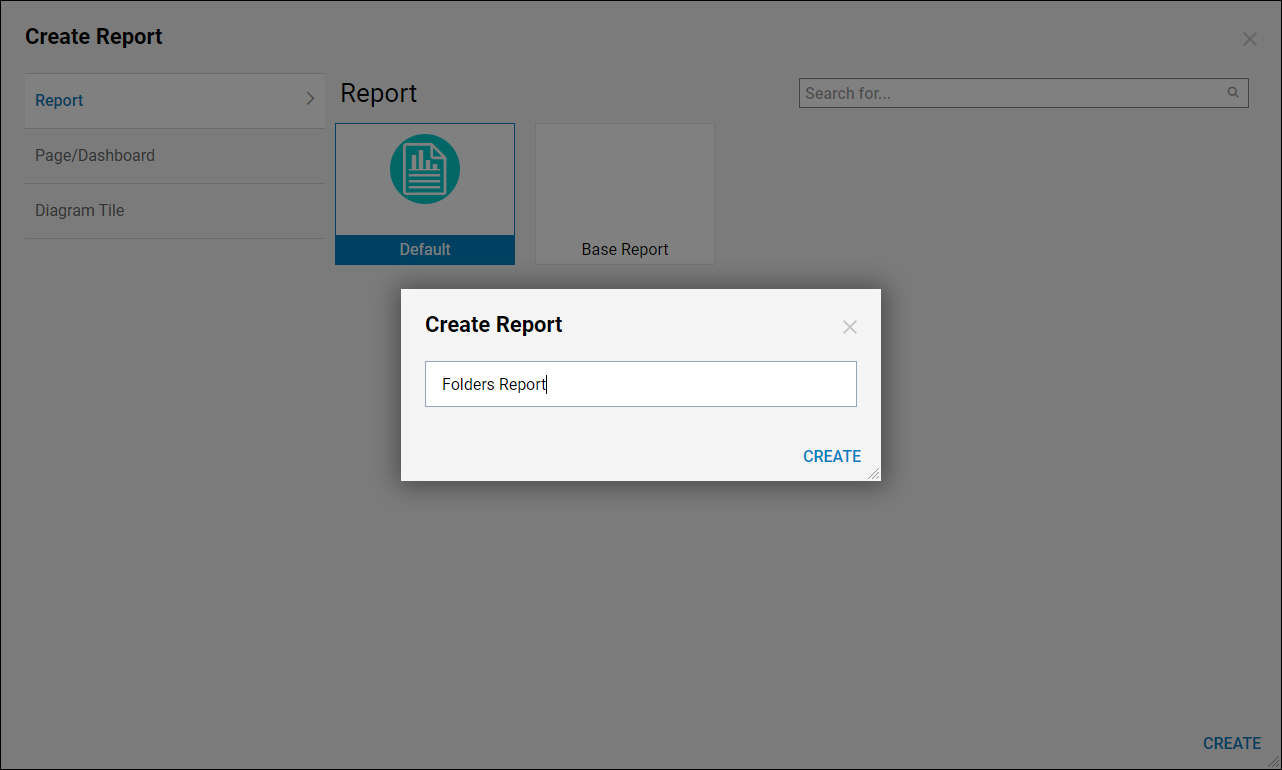
- In the resulting Create Report dialog, give the Report a name, then select Create.
- In the Report Designer, define the data source from Data Sources > Common then choose Folder Data Source.
- Then, under the Data Fields column and add Entity Name, Folder Type Name, and Nesting Level to the report.
Please navigate to the Create a Report article for more information on building Reports.
Create a Matrix
- To add a Matrix view to the Report, select Add in the Views column, then select Matrix.
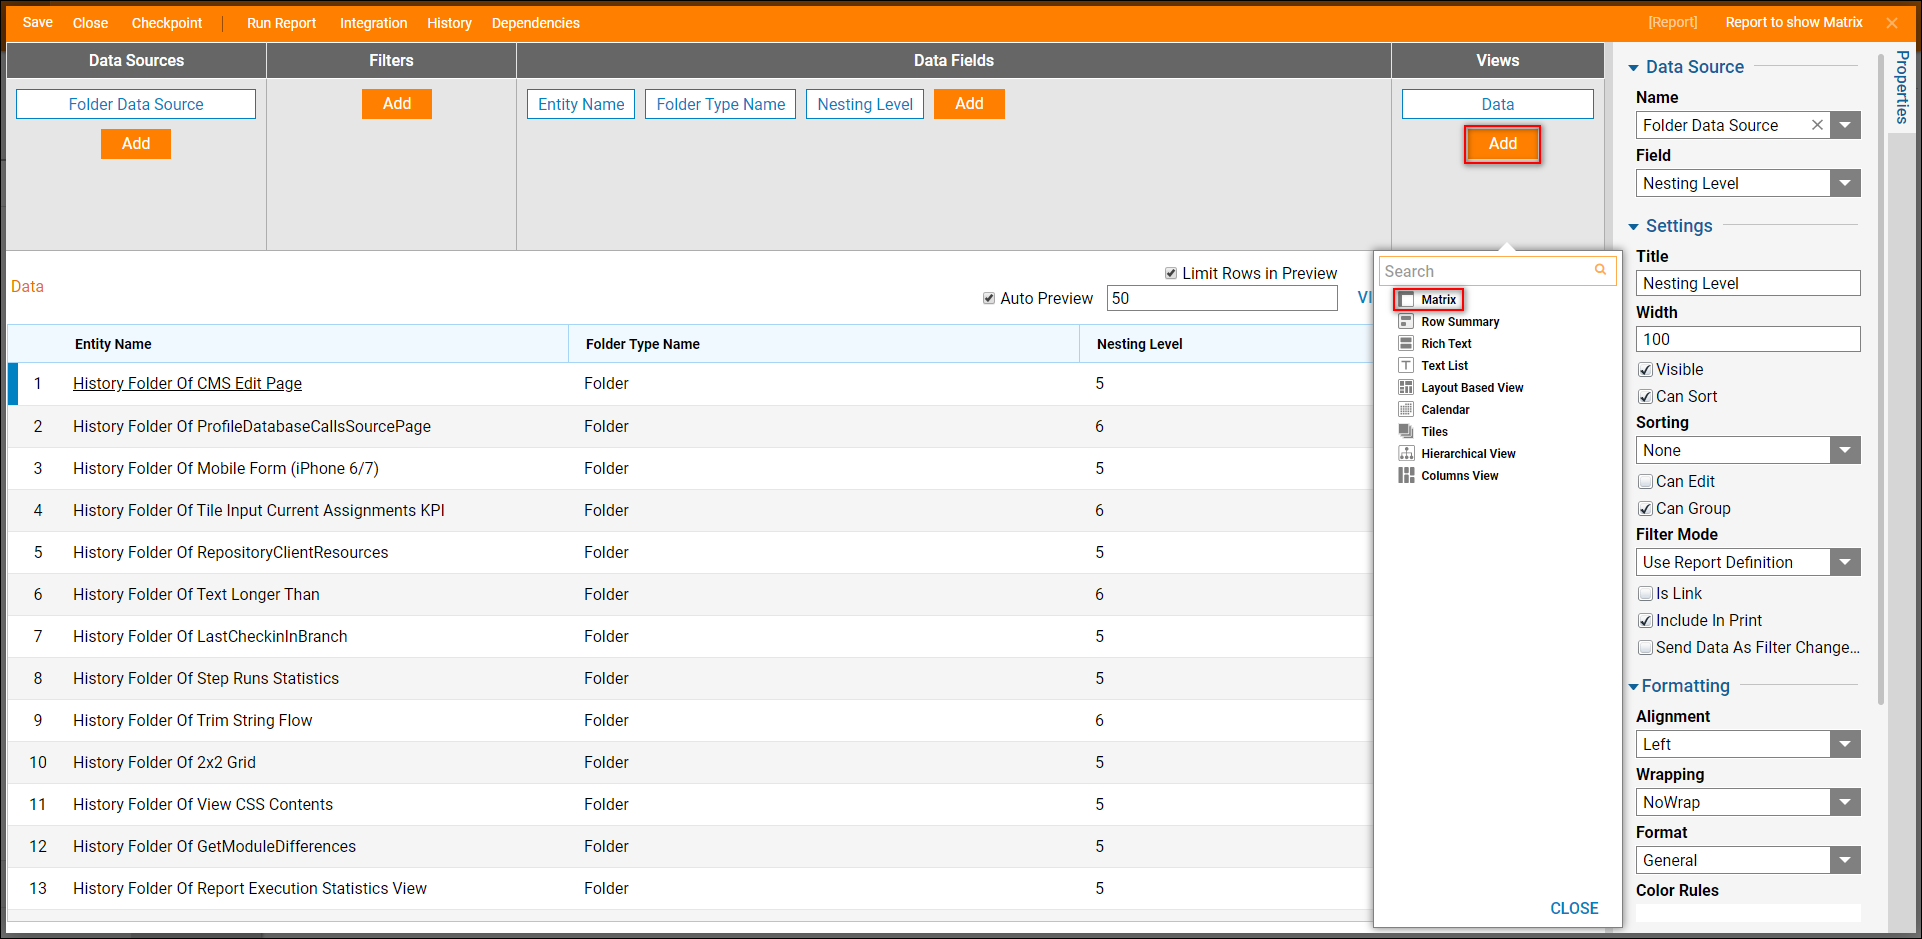
- This will add a Matrix view to the Report. This Matrix view will automatically open.
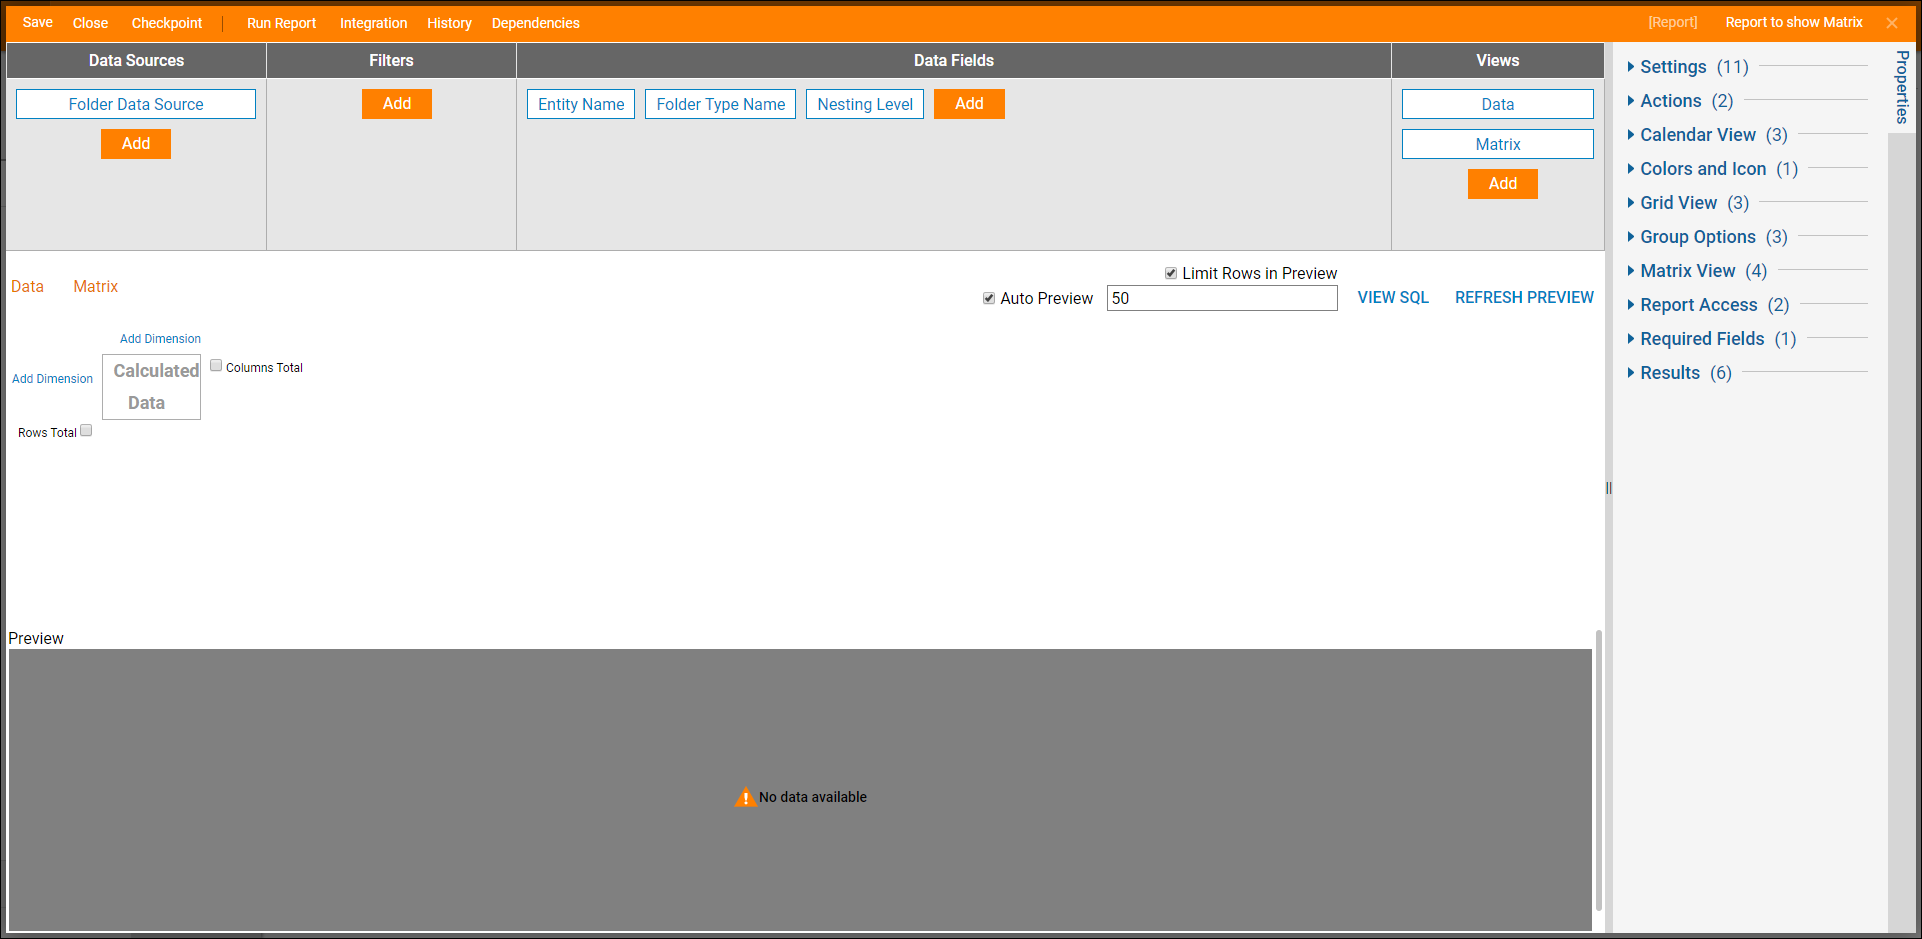
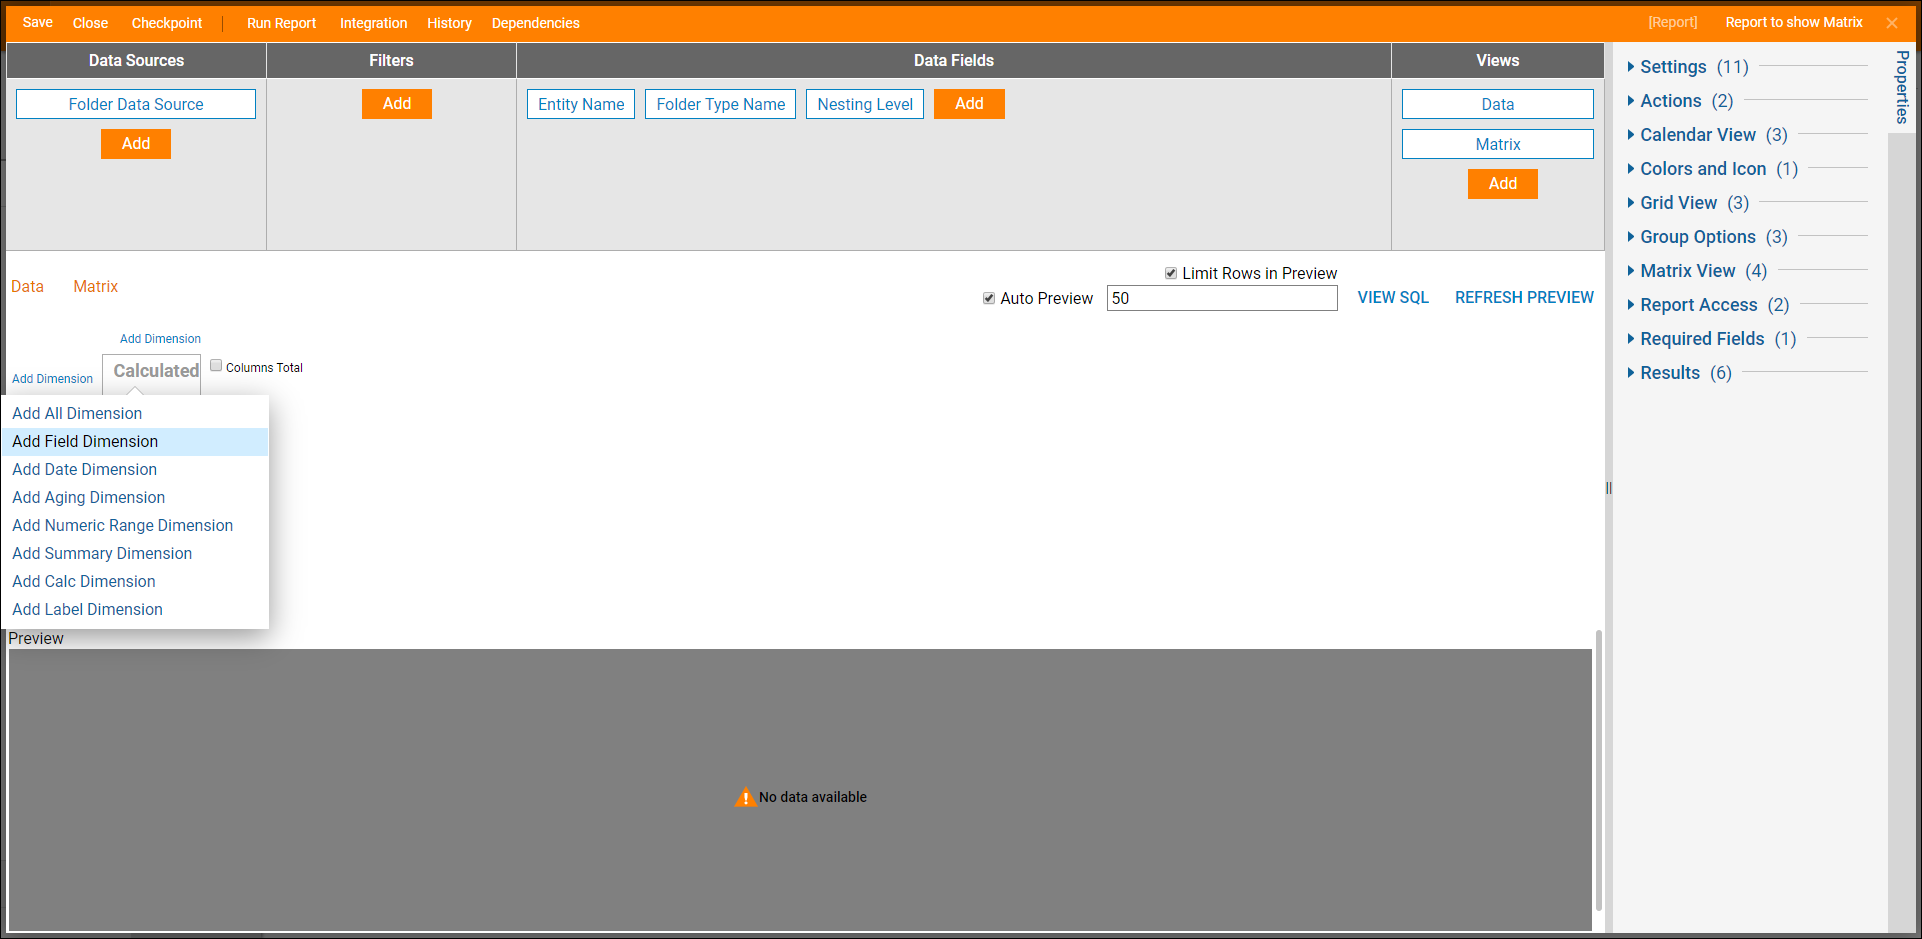
- To build the Report matrix, select the Add Dimension link corresponding to the y-axis and select Add Field Dimension.
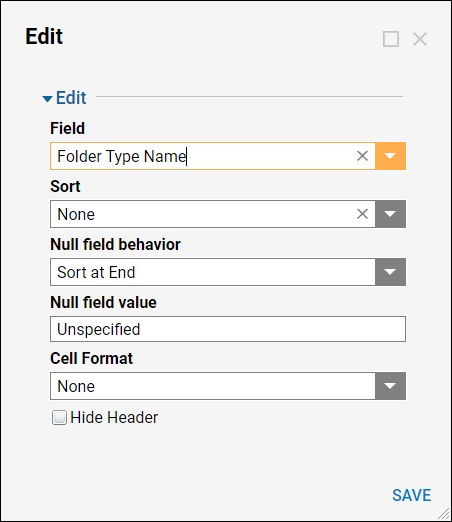
- In the Edit dialog, select Folder Type Name in the Field drop-down list and select SAVE.
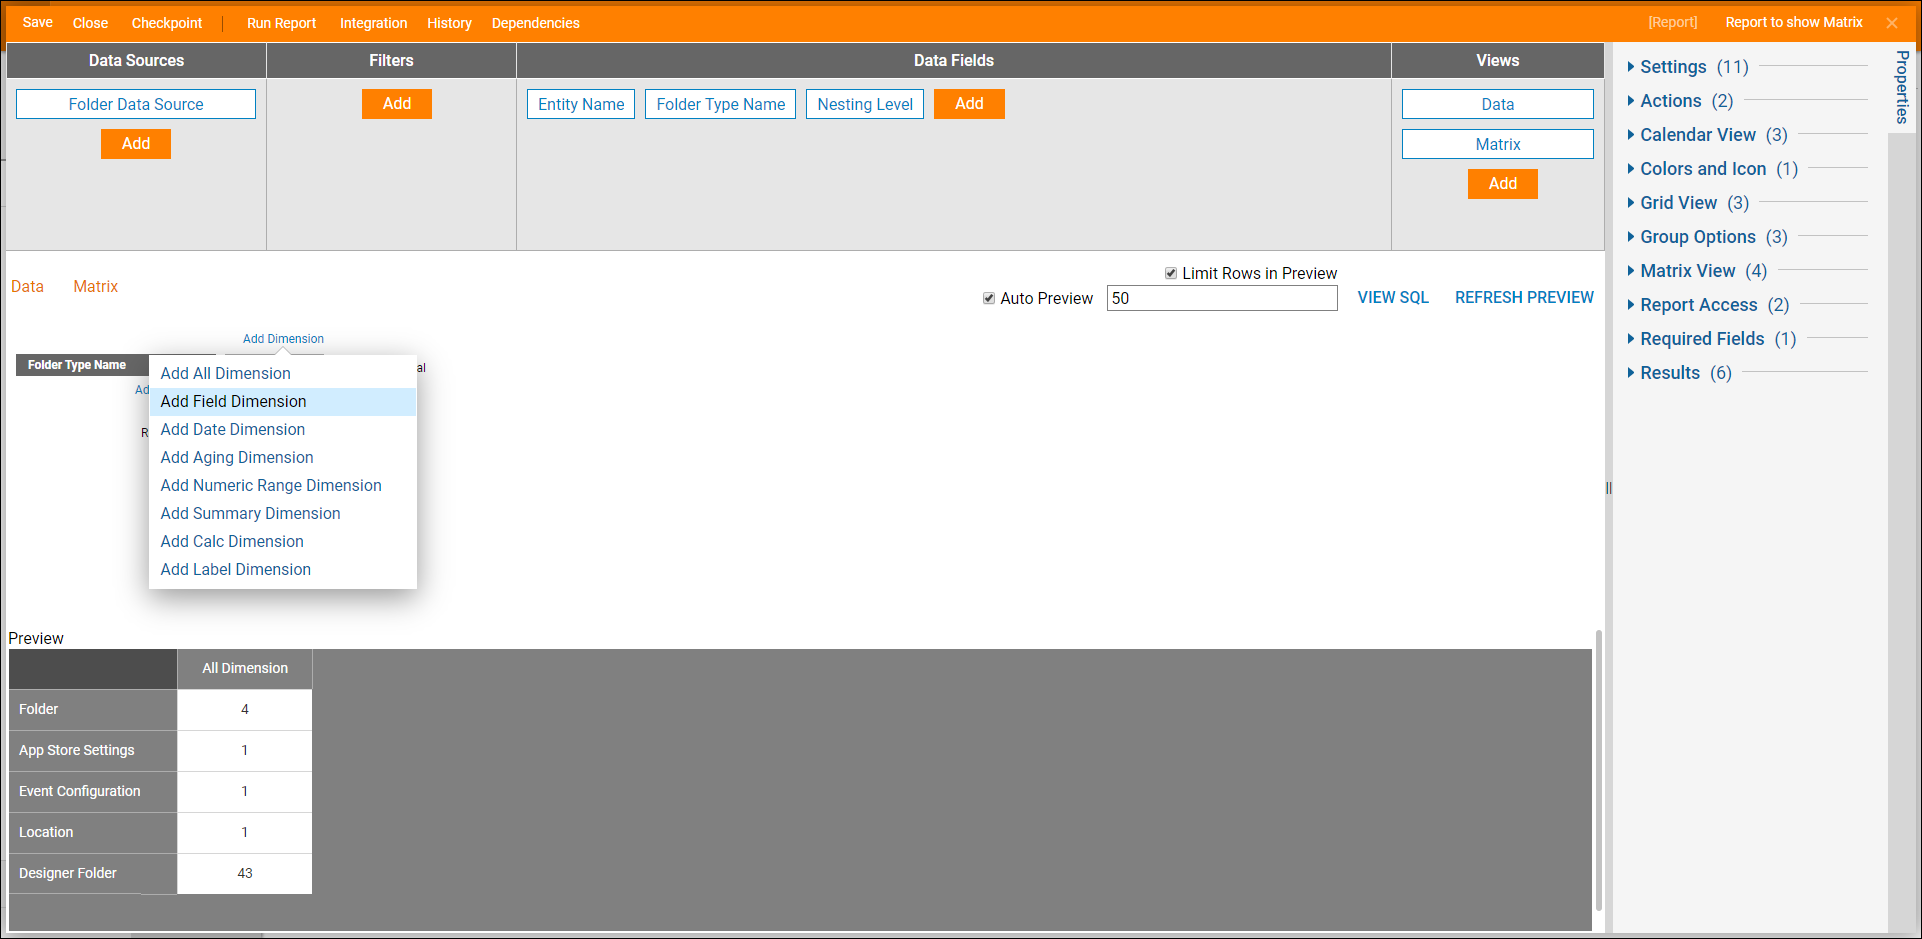
- Next, select the Add Dimension link corresponding to the x-axis (horizontal) and select Add Field Dimension.
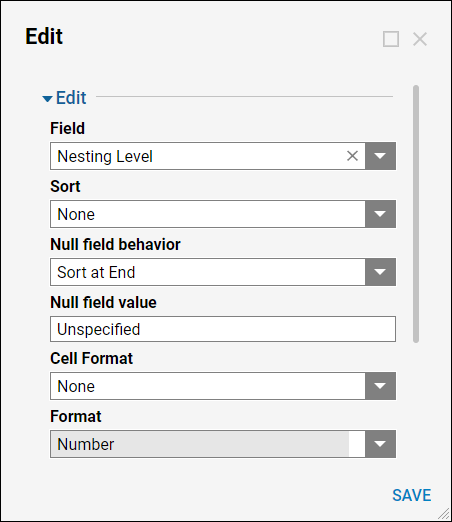
- In the Edit dialog, select Nesting Level in the Field drop-down list and select SAVE.
- Select Run Report in the top action panel. The Report will open in a new window.
- Click on the Matrix view to see the Report matrix.
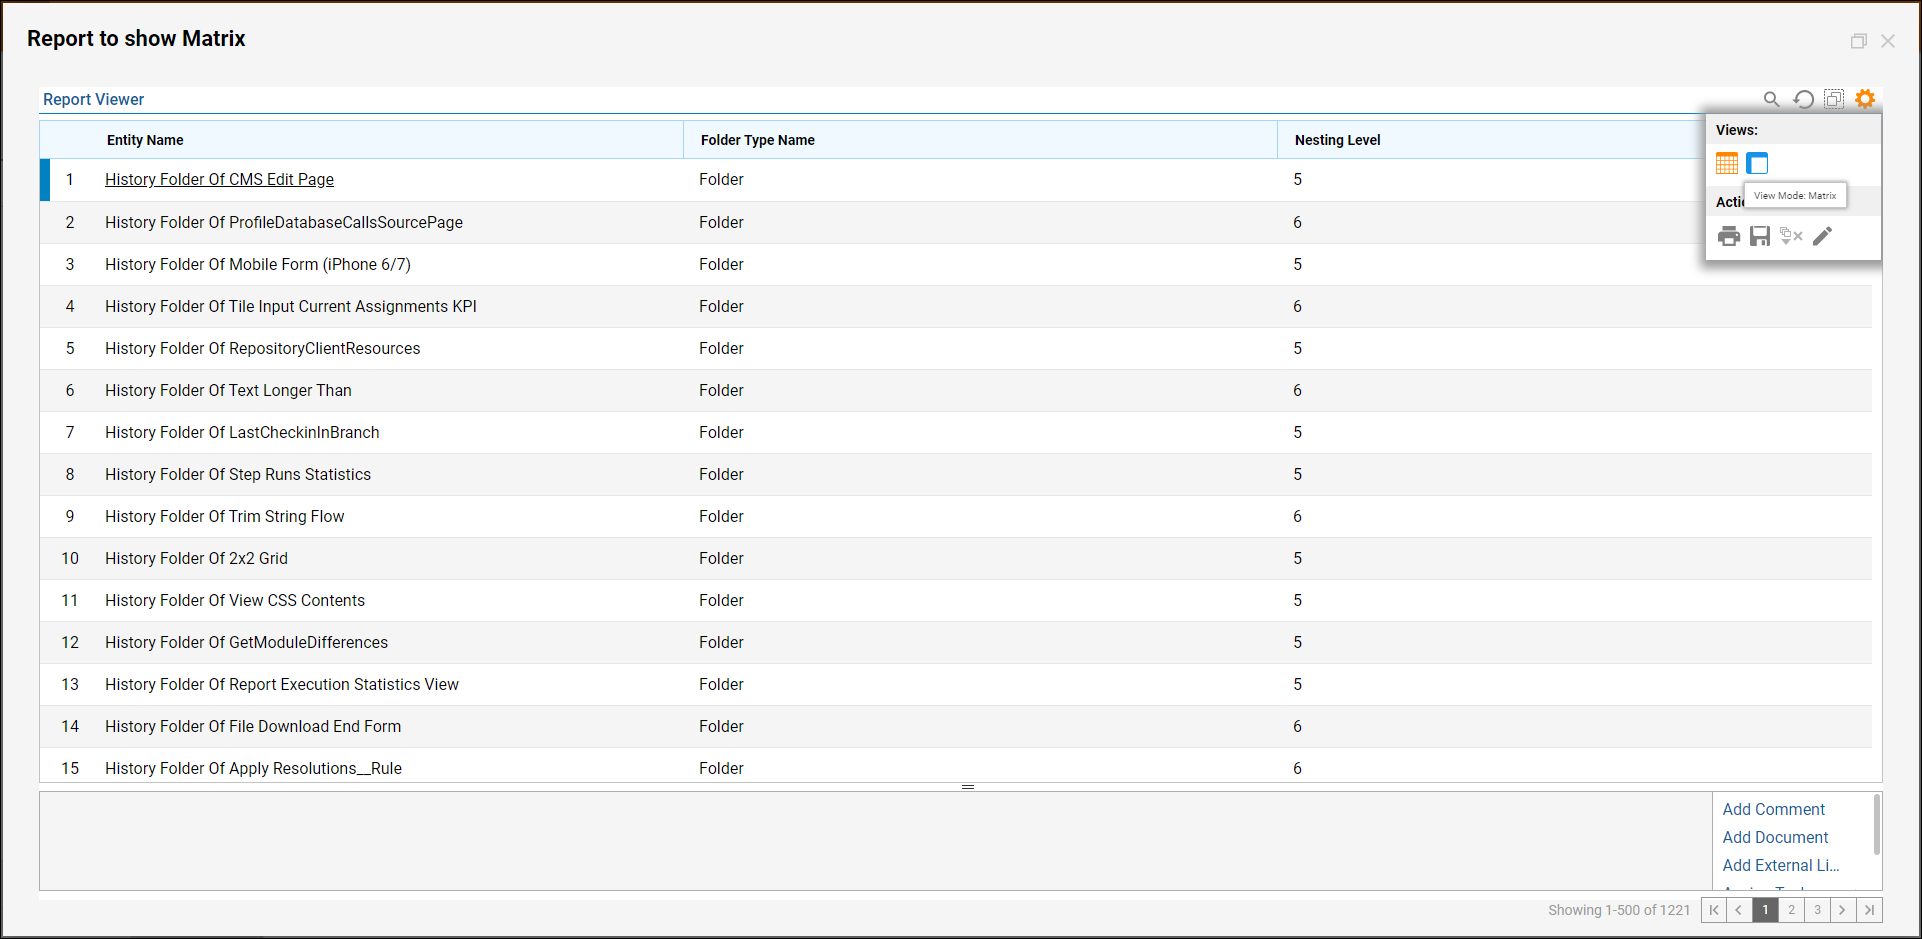
Drill Down Report
- To drill down into the Report data, click on one of the matrix cells.
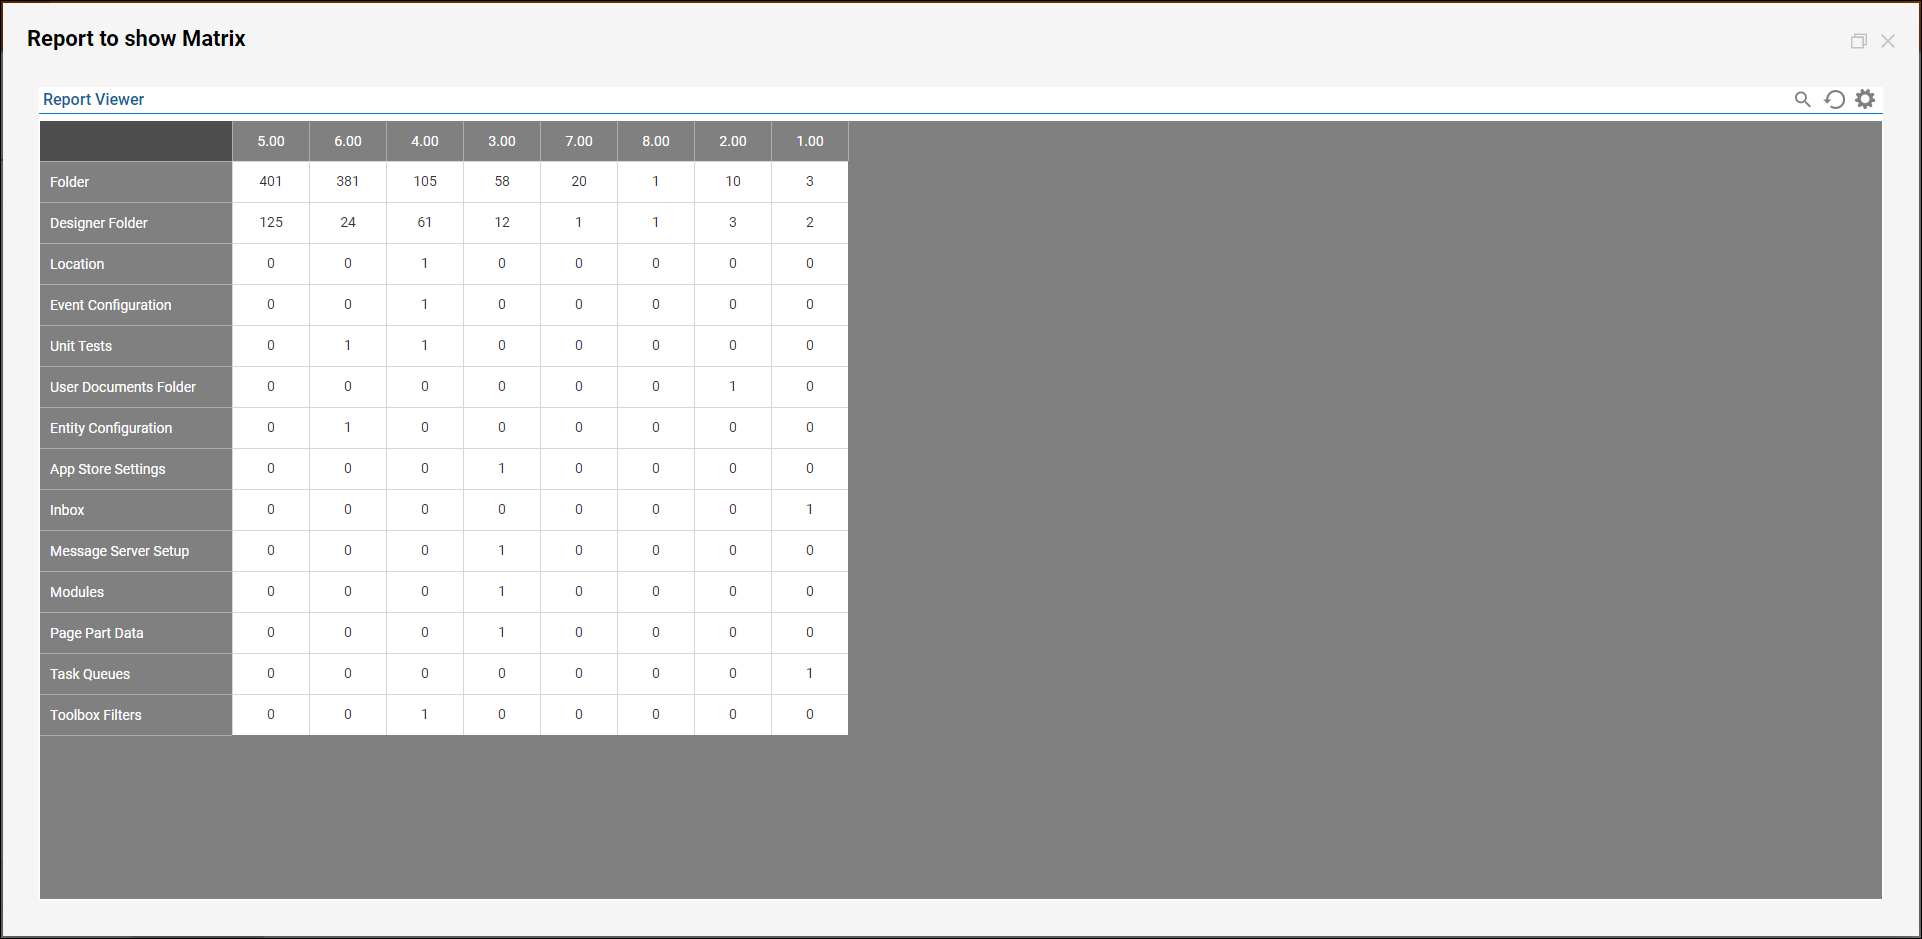
- In the resulting dialog, there is a Report of the entities comprising the total of that cell.
