Overview
Diagram Tiles are a way to capture data and present it in an attractive manner using info-graphics. Charts, Shapes, Steps, Labels and more are available to add to diagram tiles to display data in a relevant manner. Configuring Diagram Tiles to refresh on Selection Bus allows the Diagram Tile to change when selecting different items in a report.
For more information on Diagram Tiles navigate here.
Example
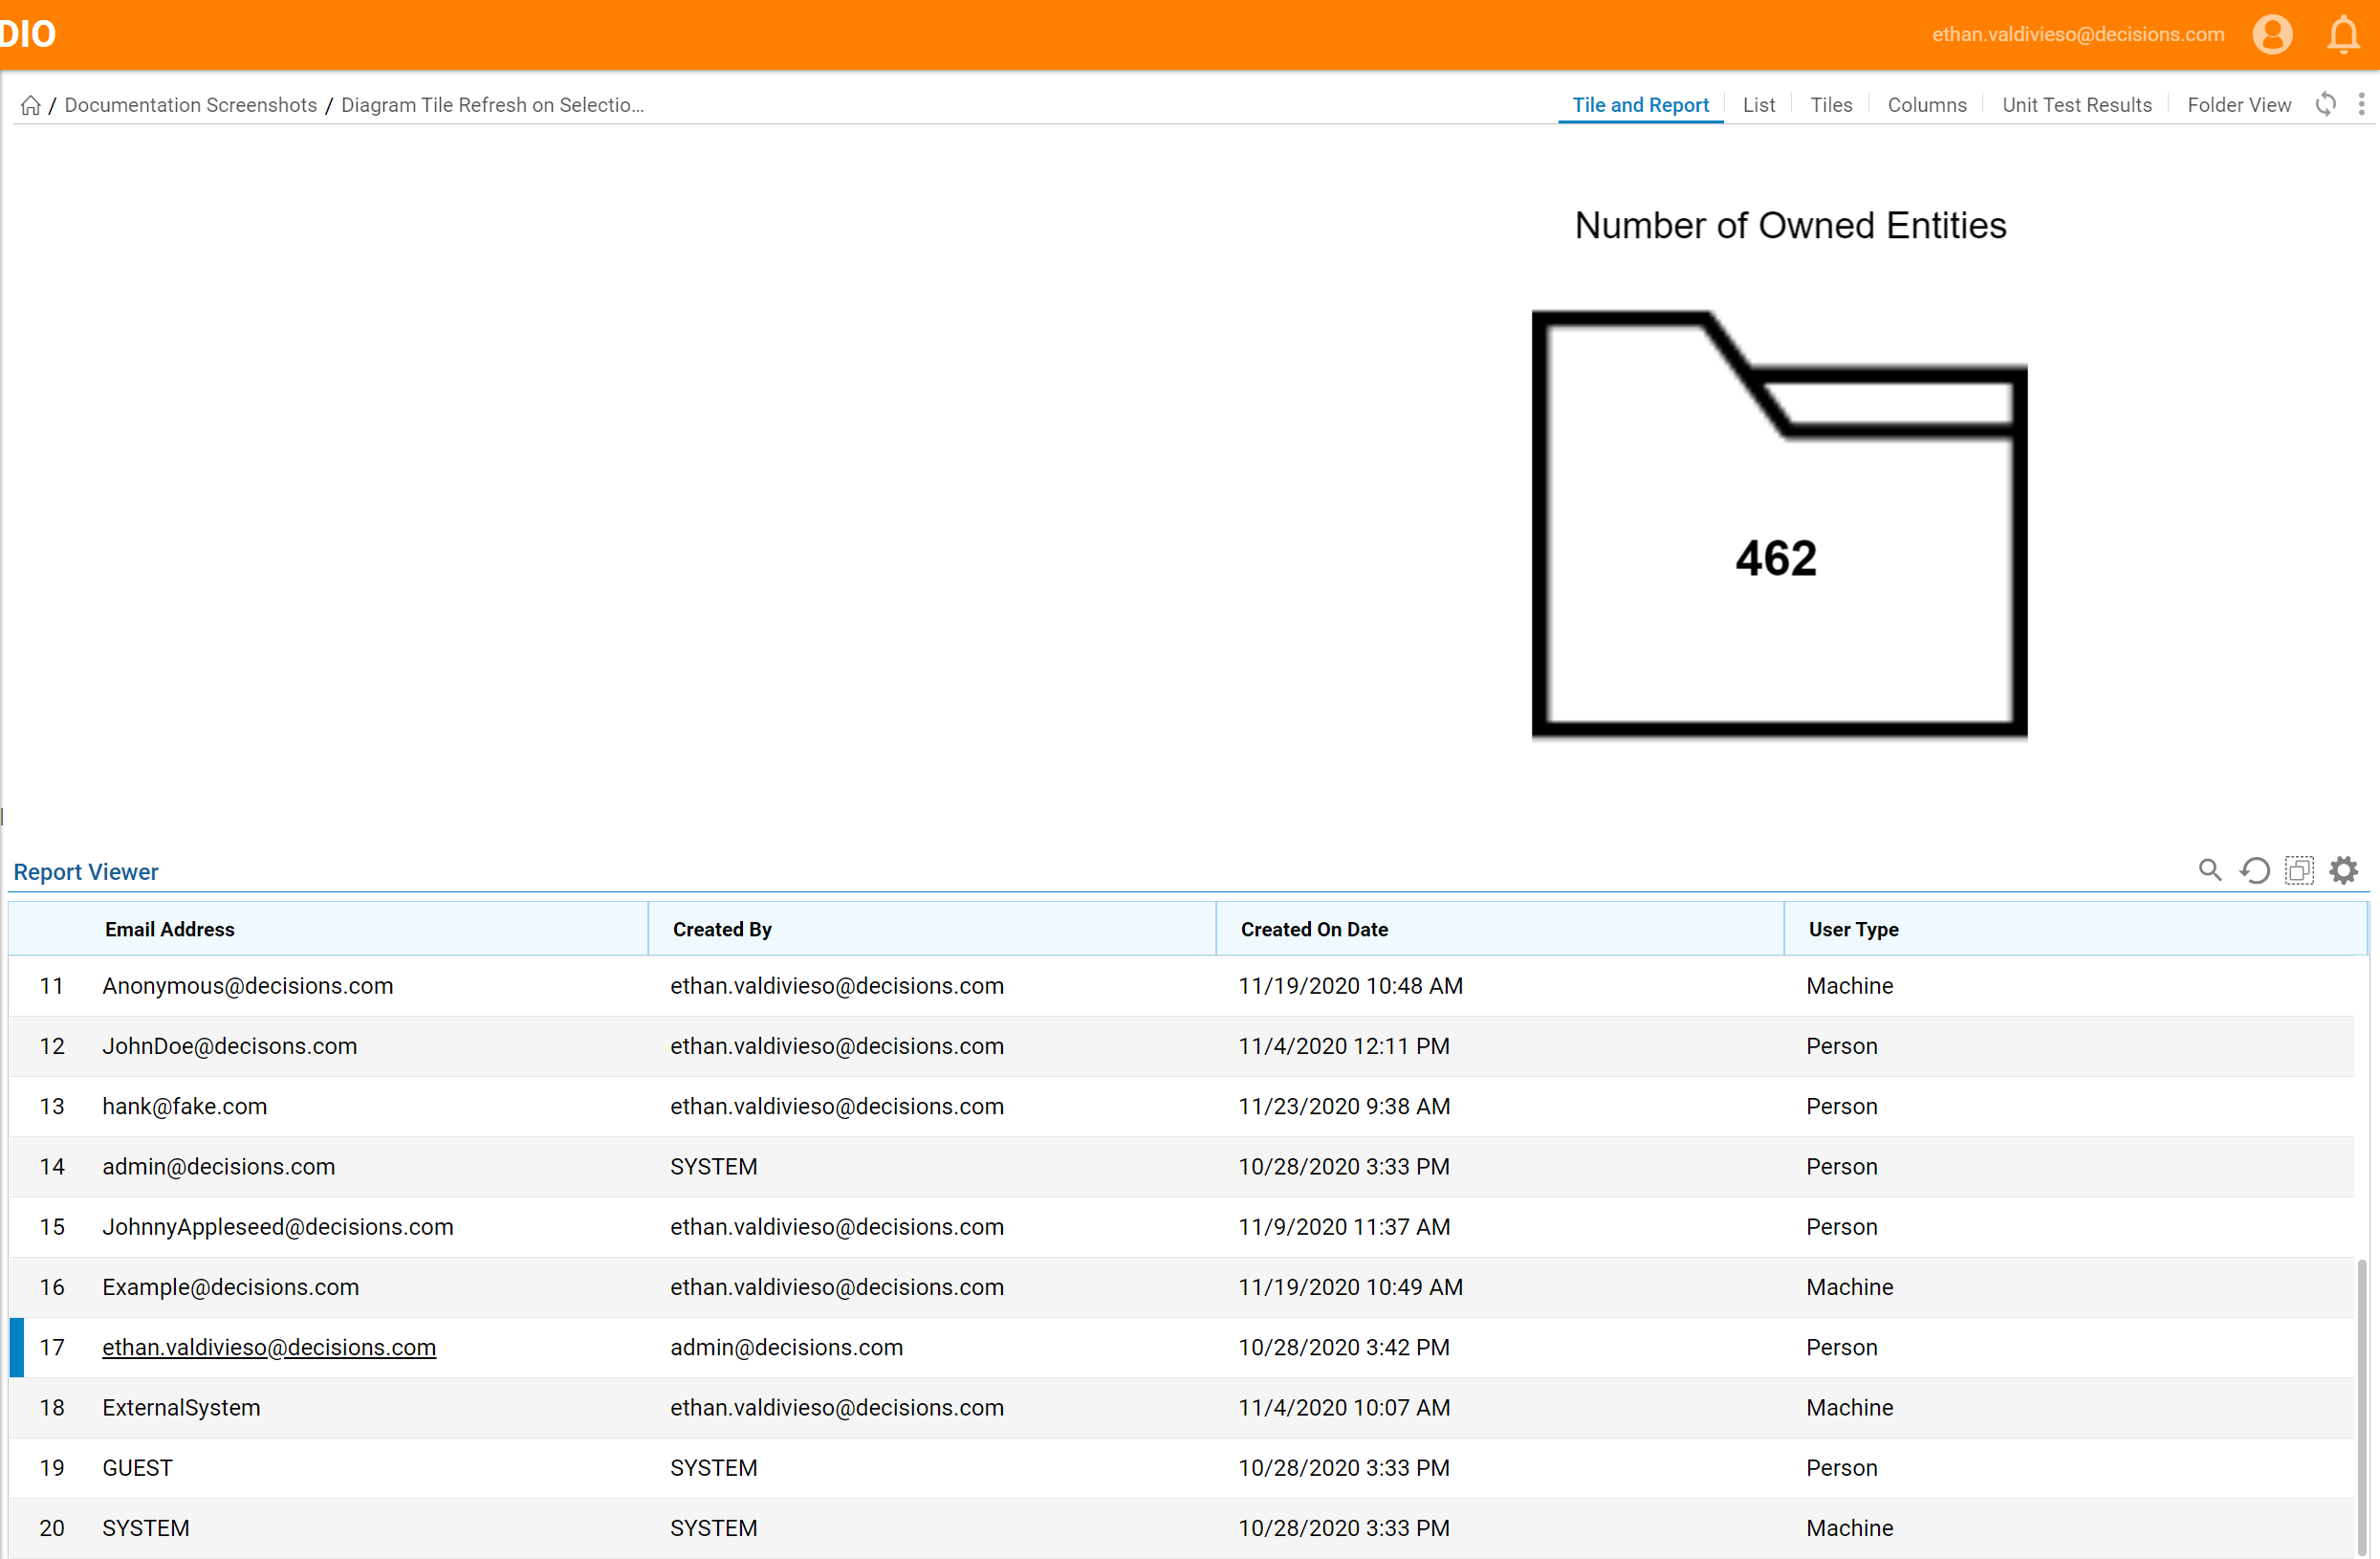
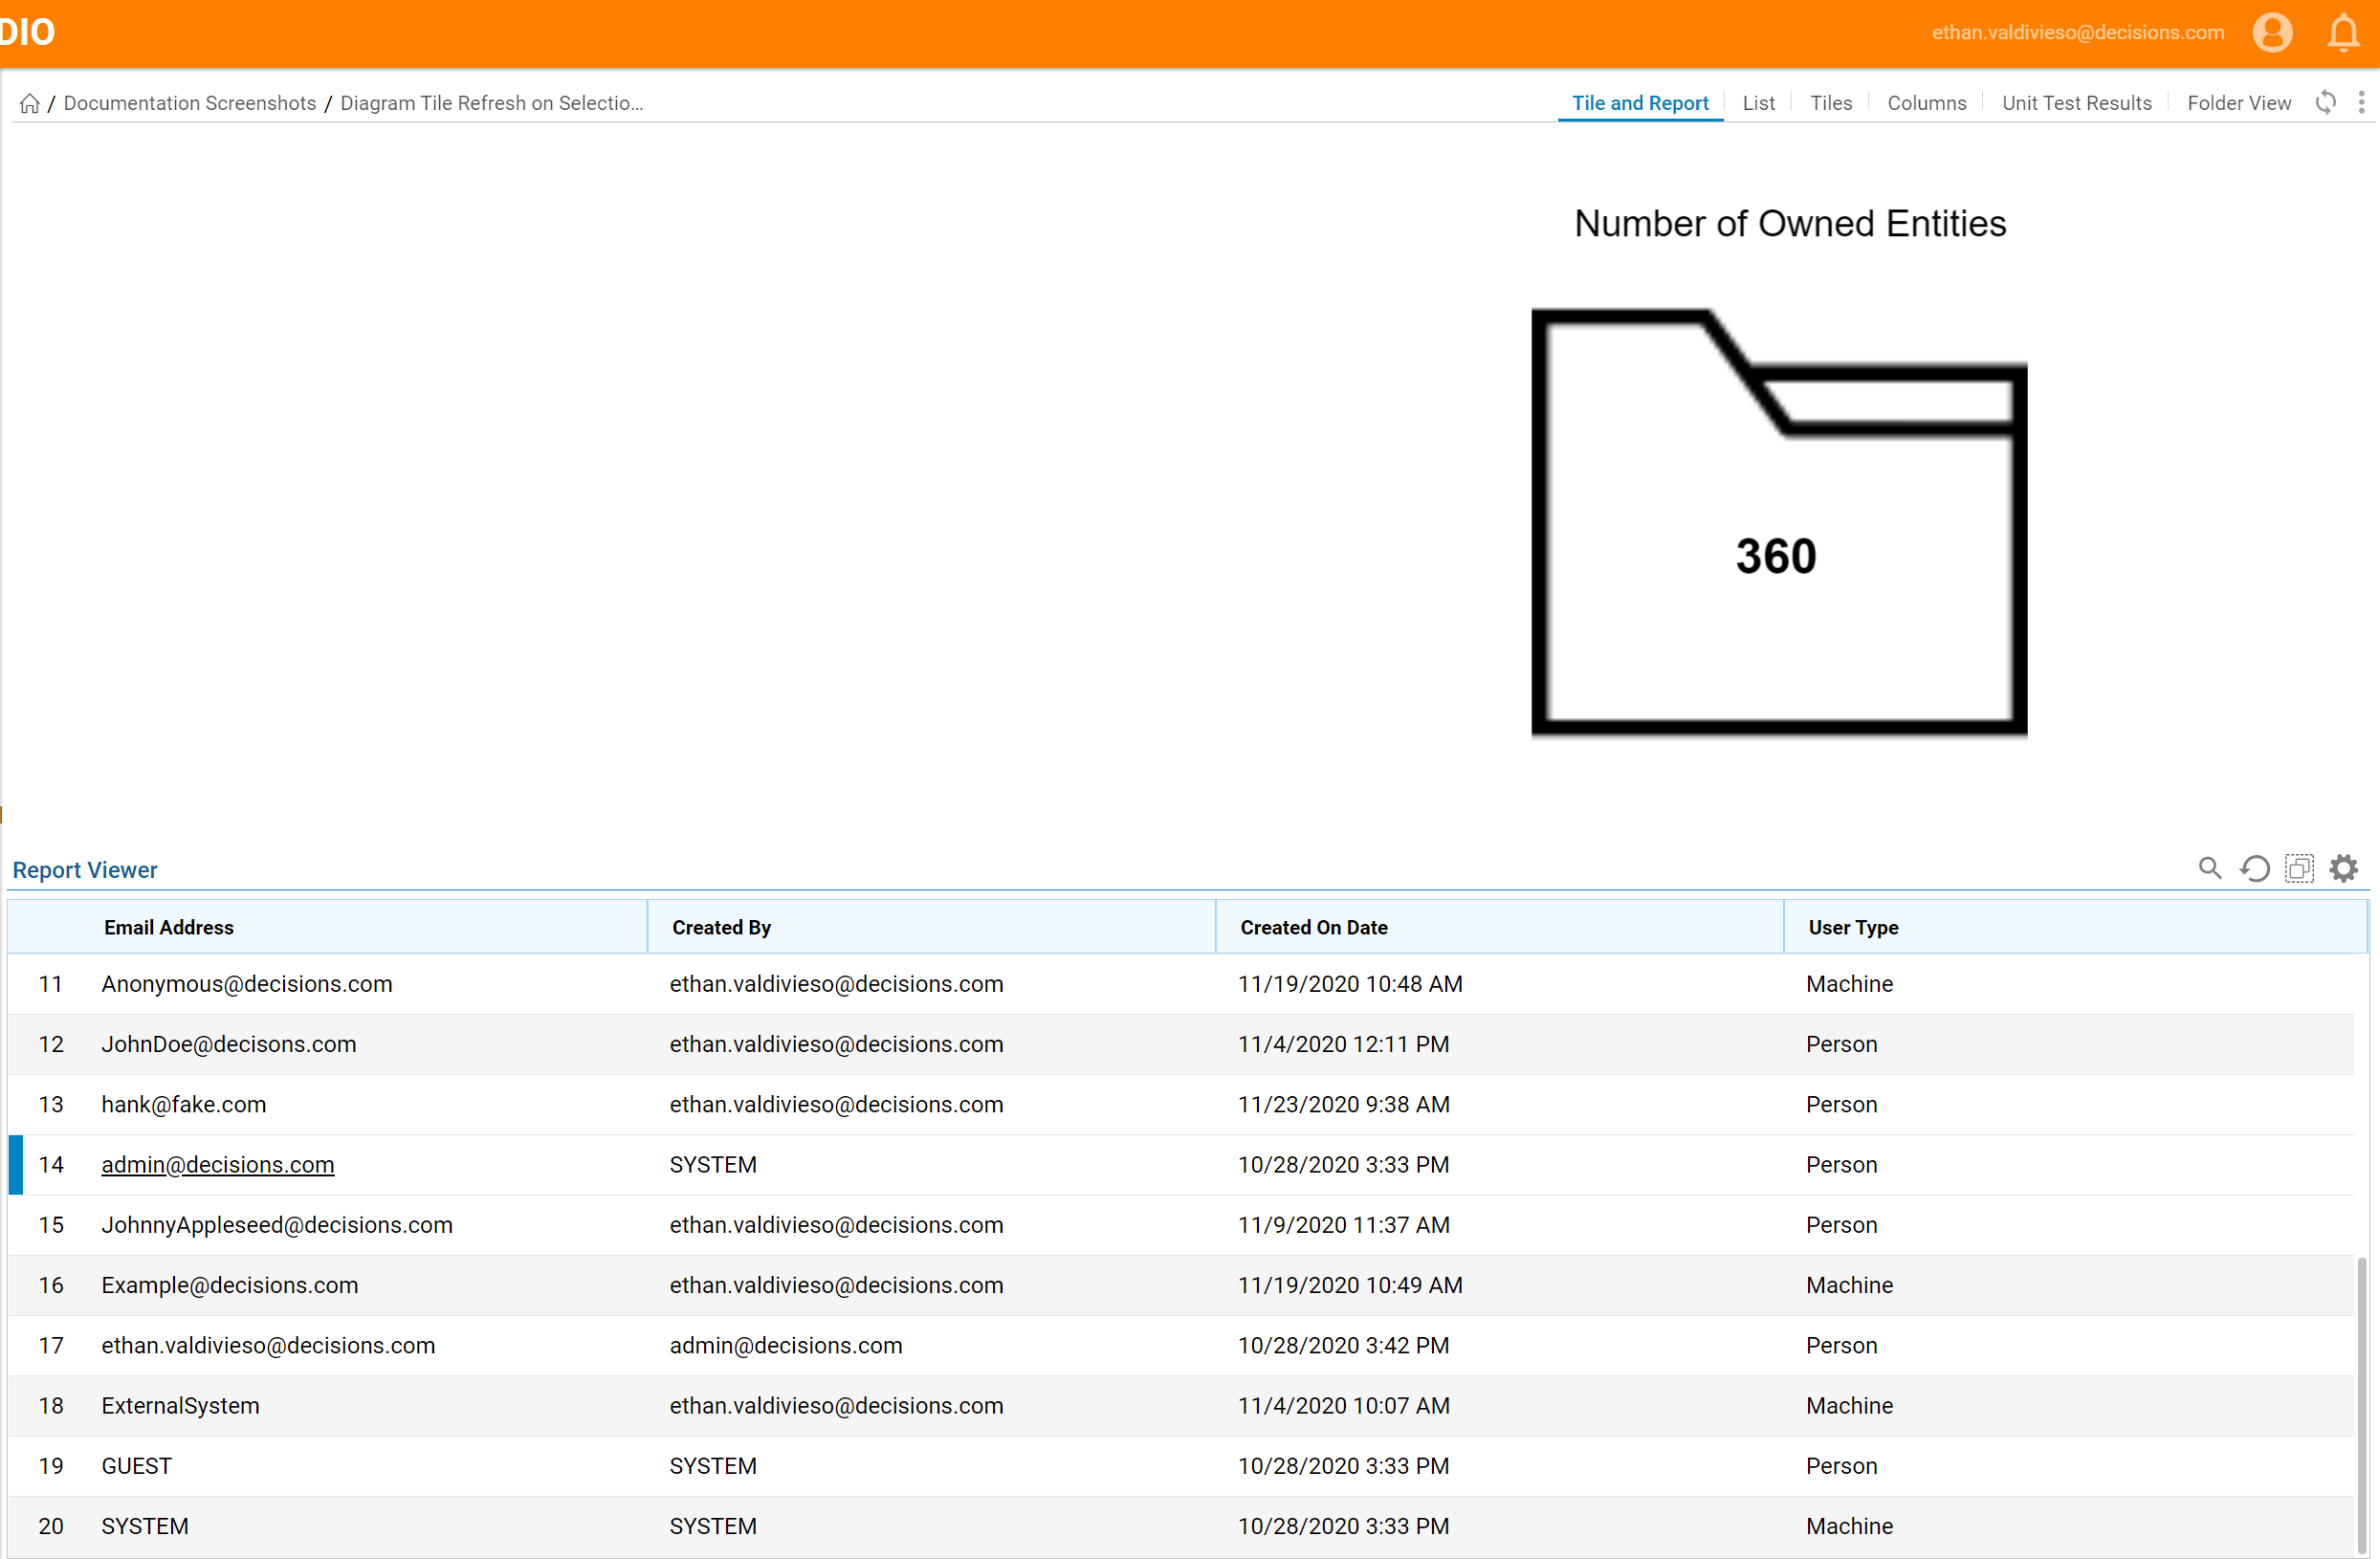
This example will create a Page that houses a Report and Diagram Tile. The Diagram Tile will show Owned Entities for the Account selected on the Report.
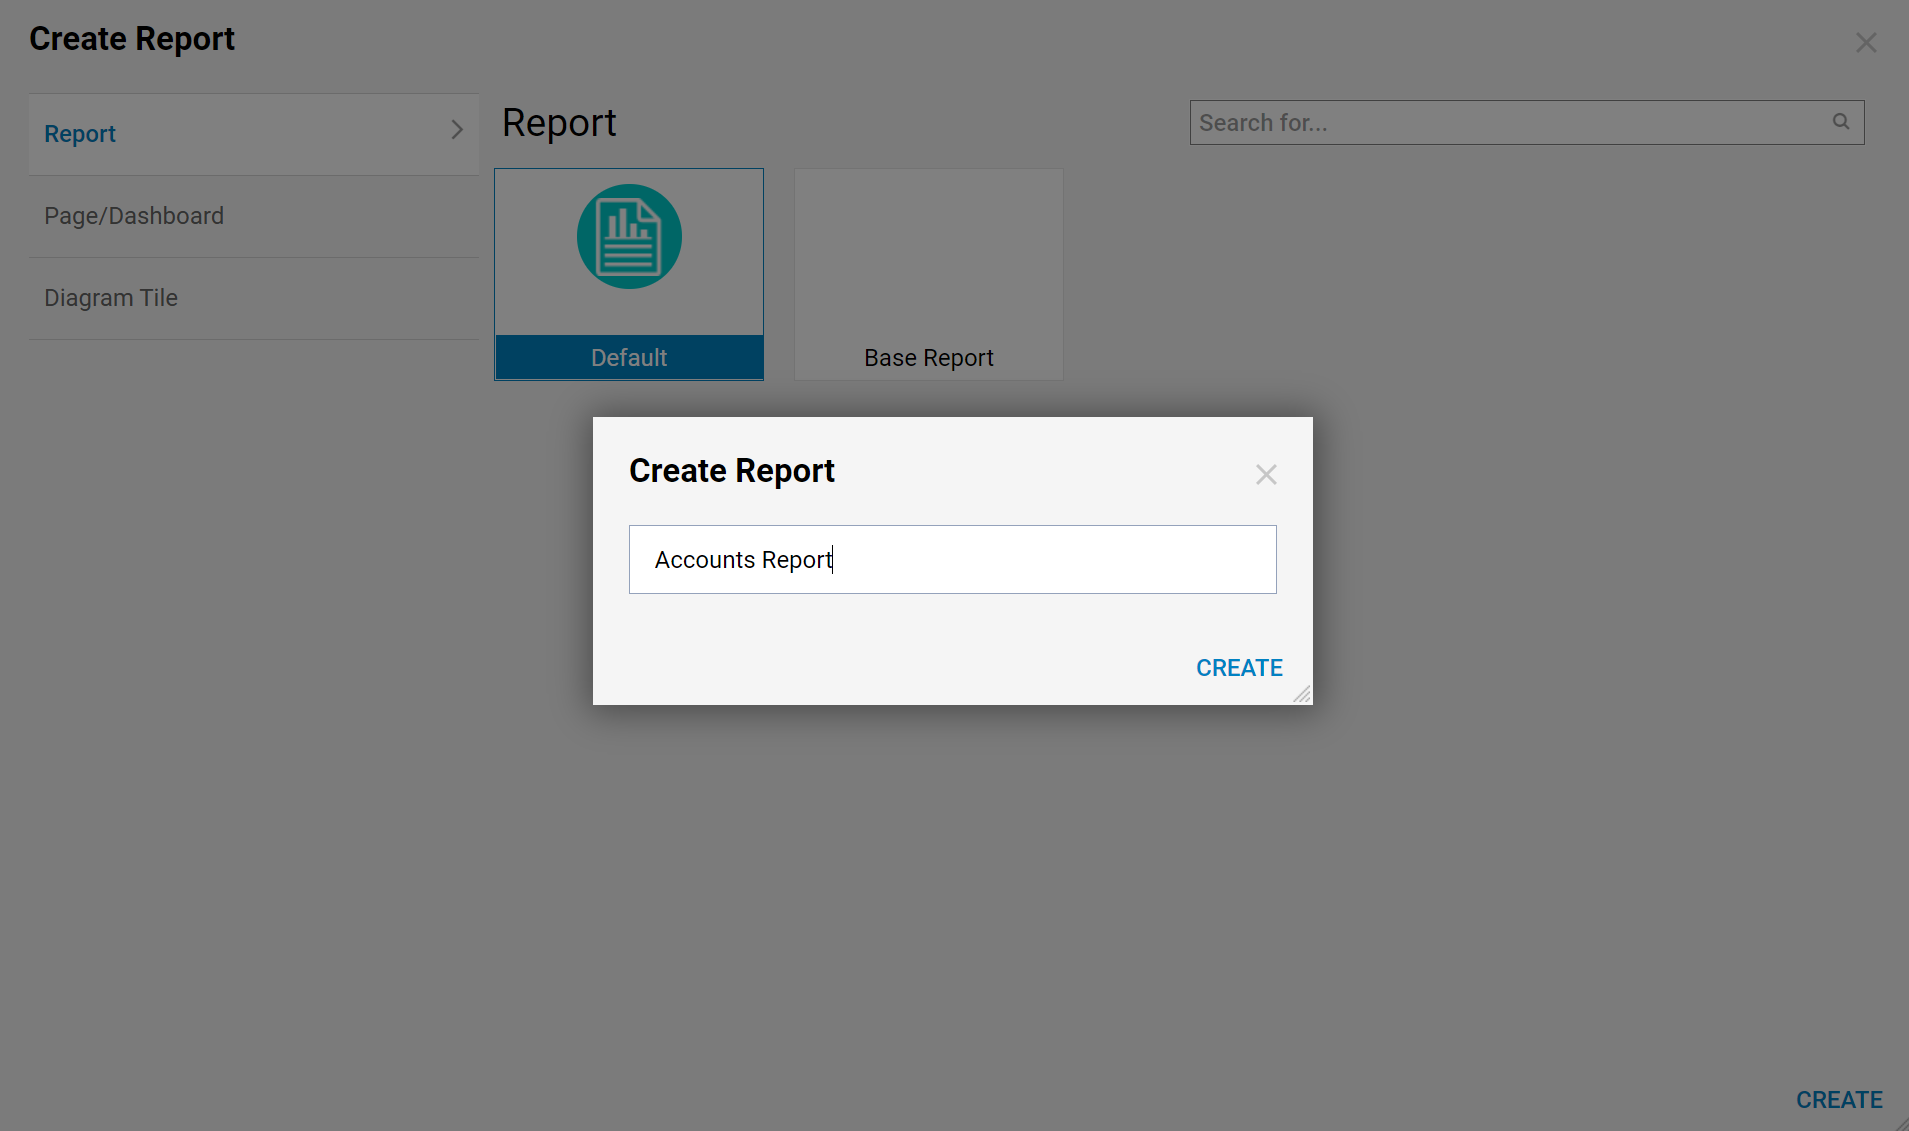
Begin in a Designer Folder, in the bottom action panel select Create Report. Name a Default Report then select Create.
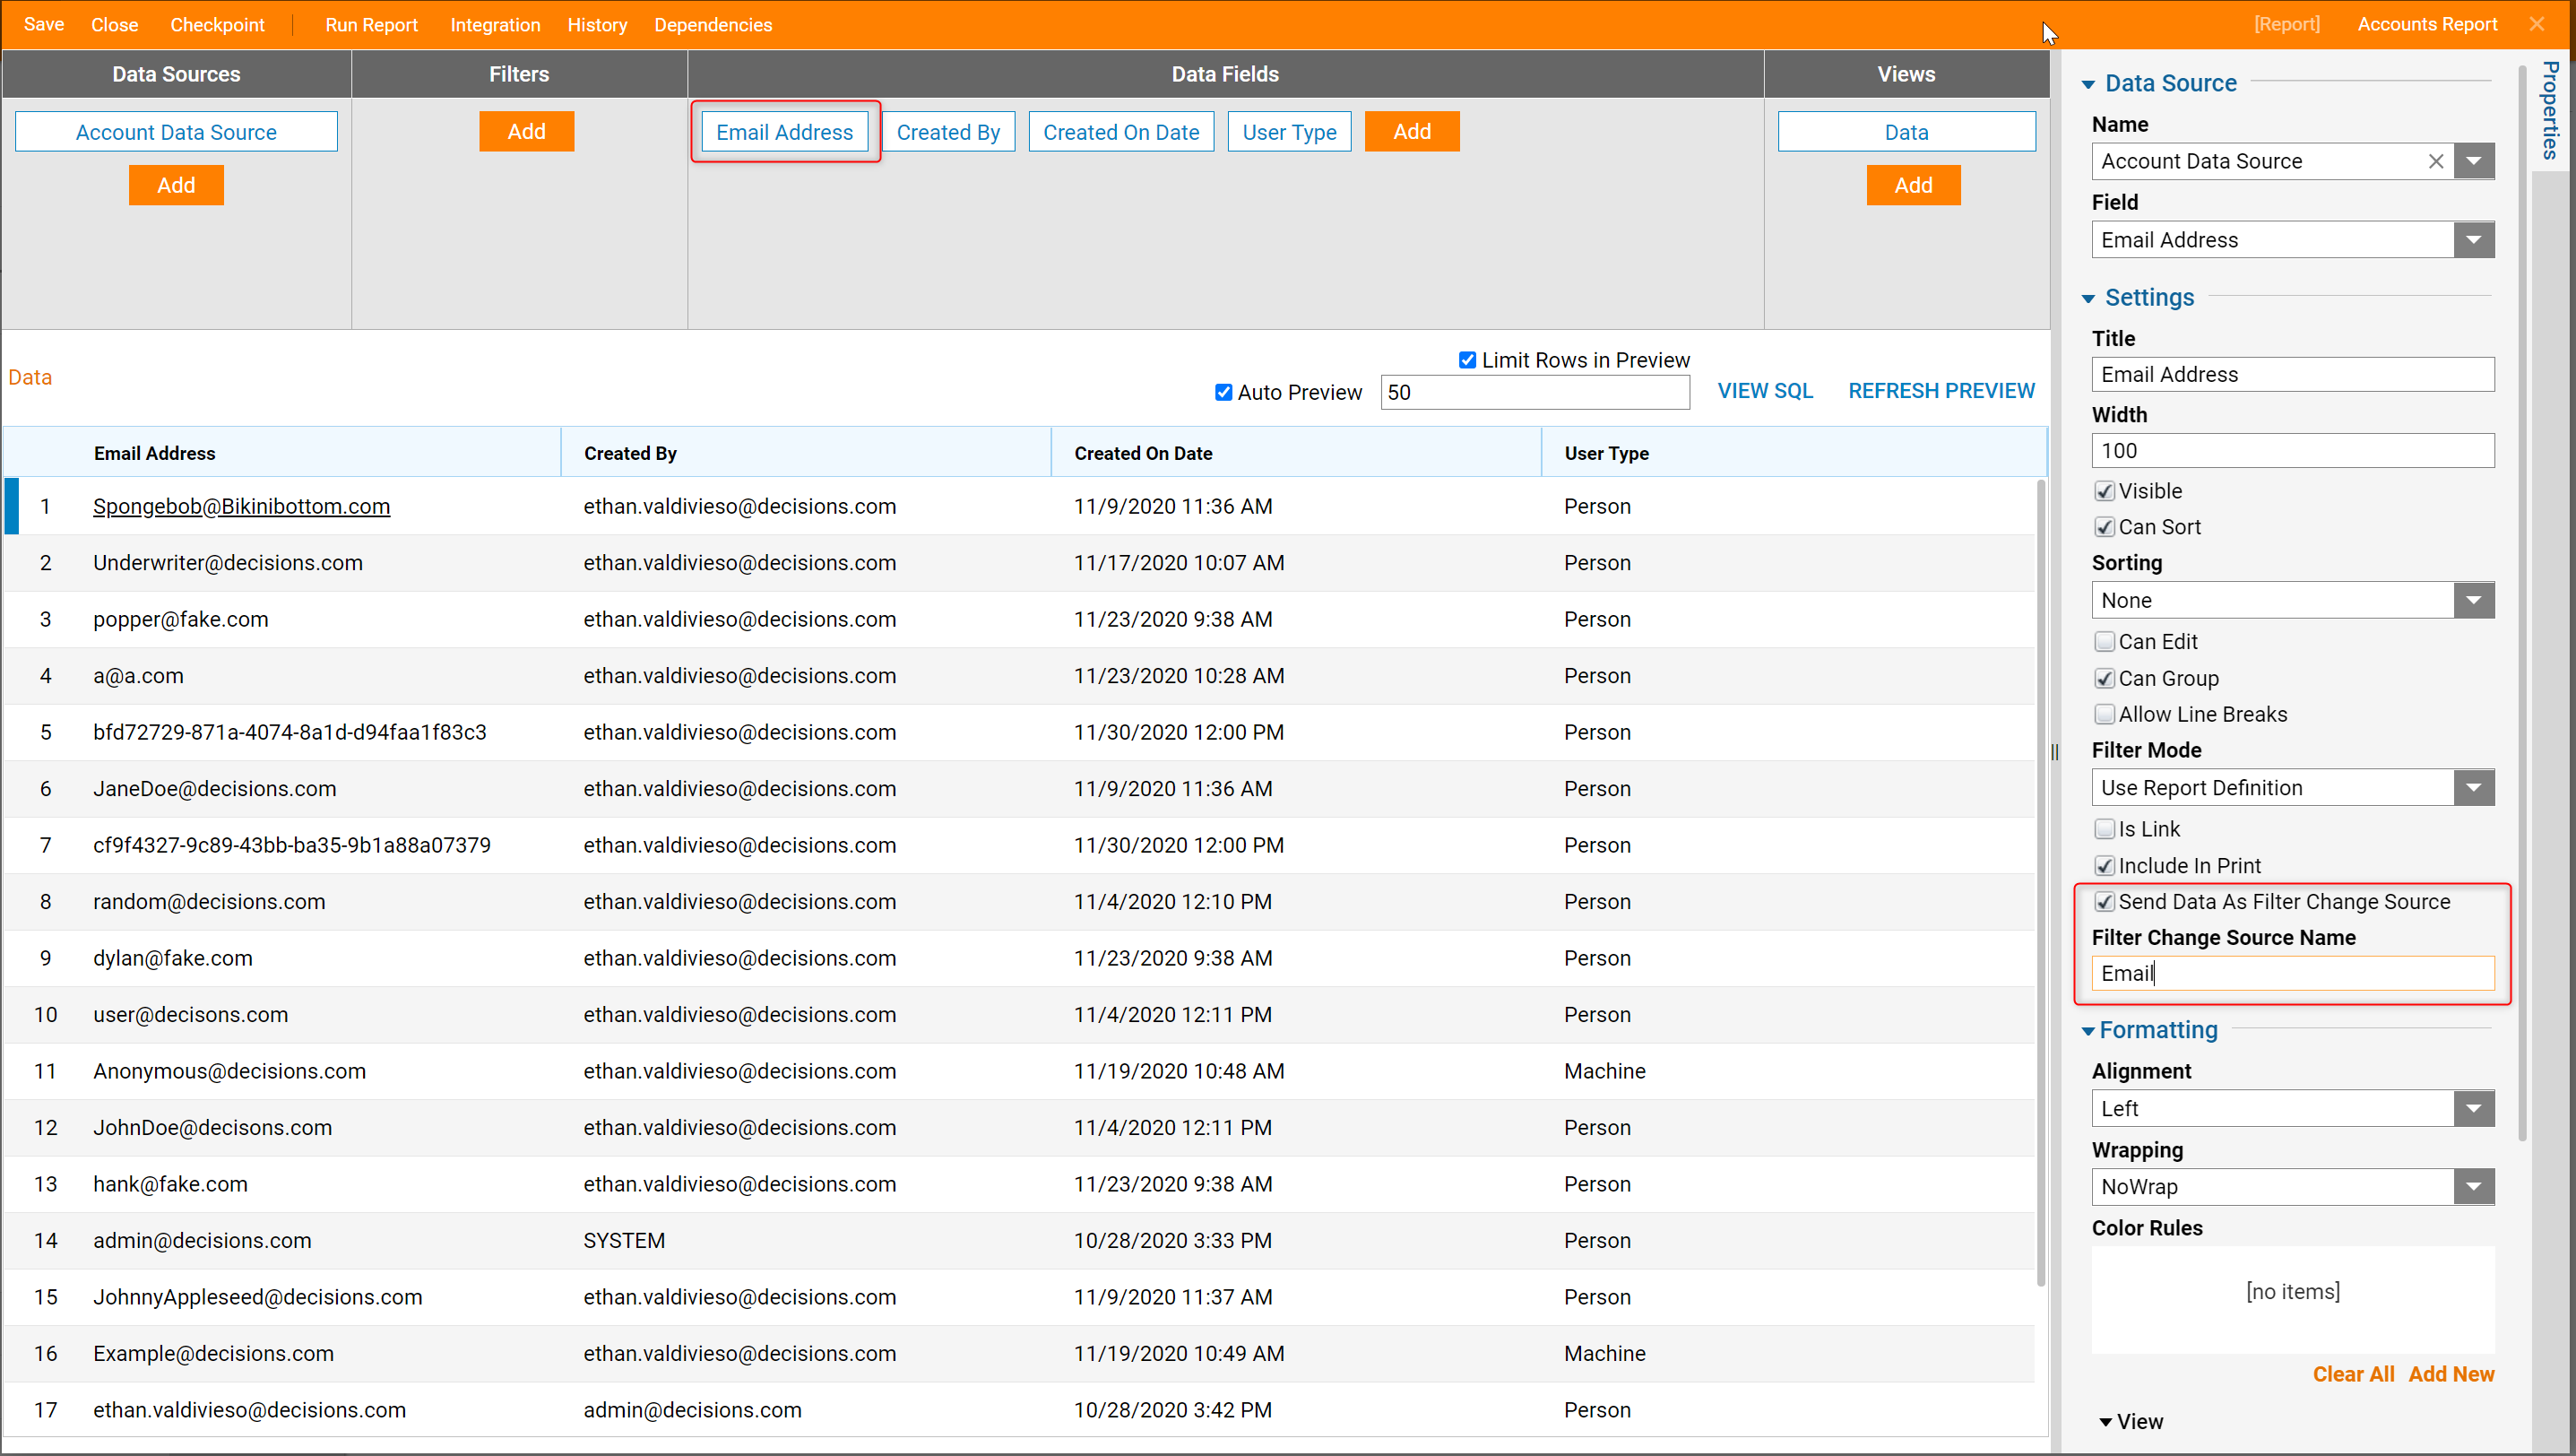
Within the Report Designer, under Data Sources add Common > Account Data Source. In the Data Fields column add Email Address, Created By, Created On Date, and User Type.
Select the Email Address Data Field. In the Properties panel expand Settings. Set the Set Data As Filter Change Source to true, a new text box labeled Filter Change Source Name will appear. Type "Email" in this text box.
Save and Close.
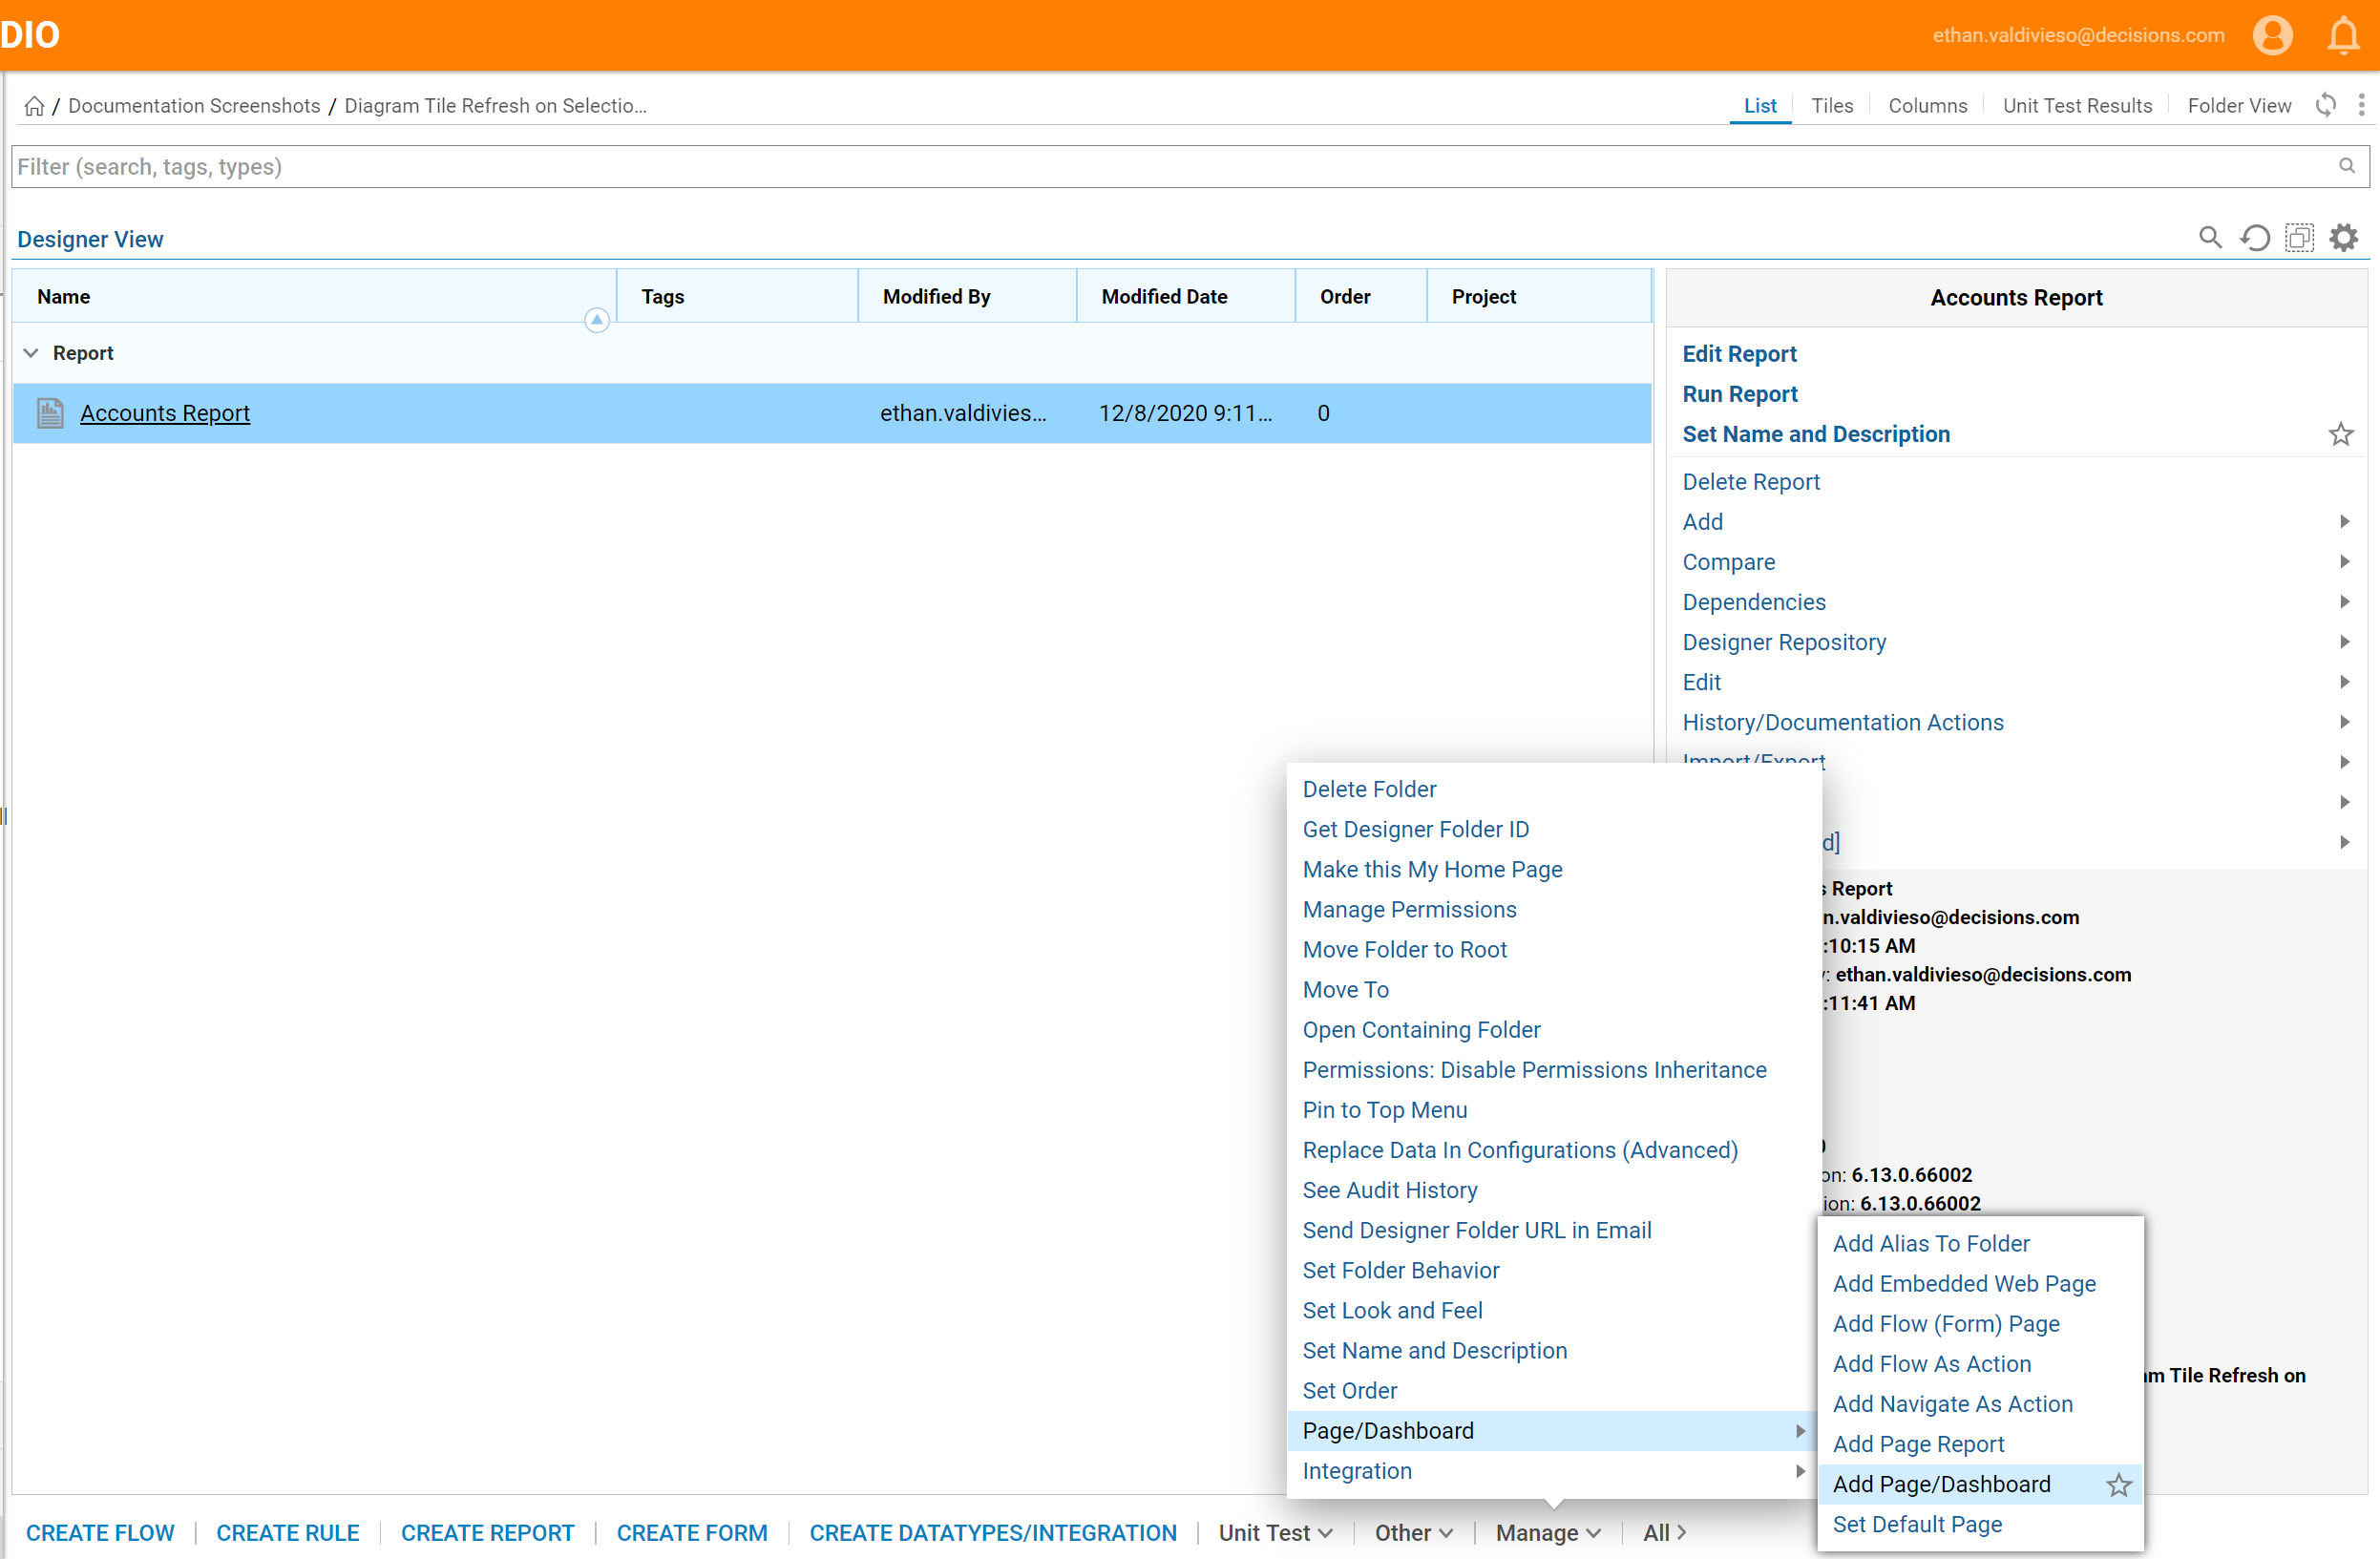
Back in the Designer Folder, in the bottom action panel add a Page by expanding Manage > Page/Dashboard > Add Page/Dashboard.
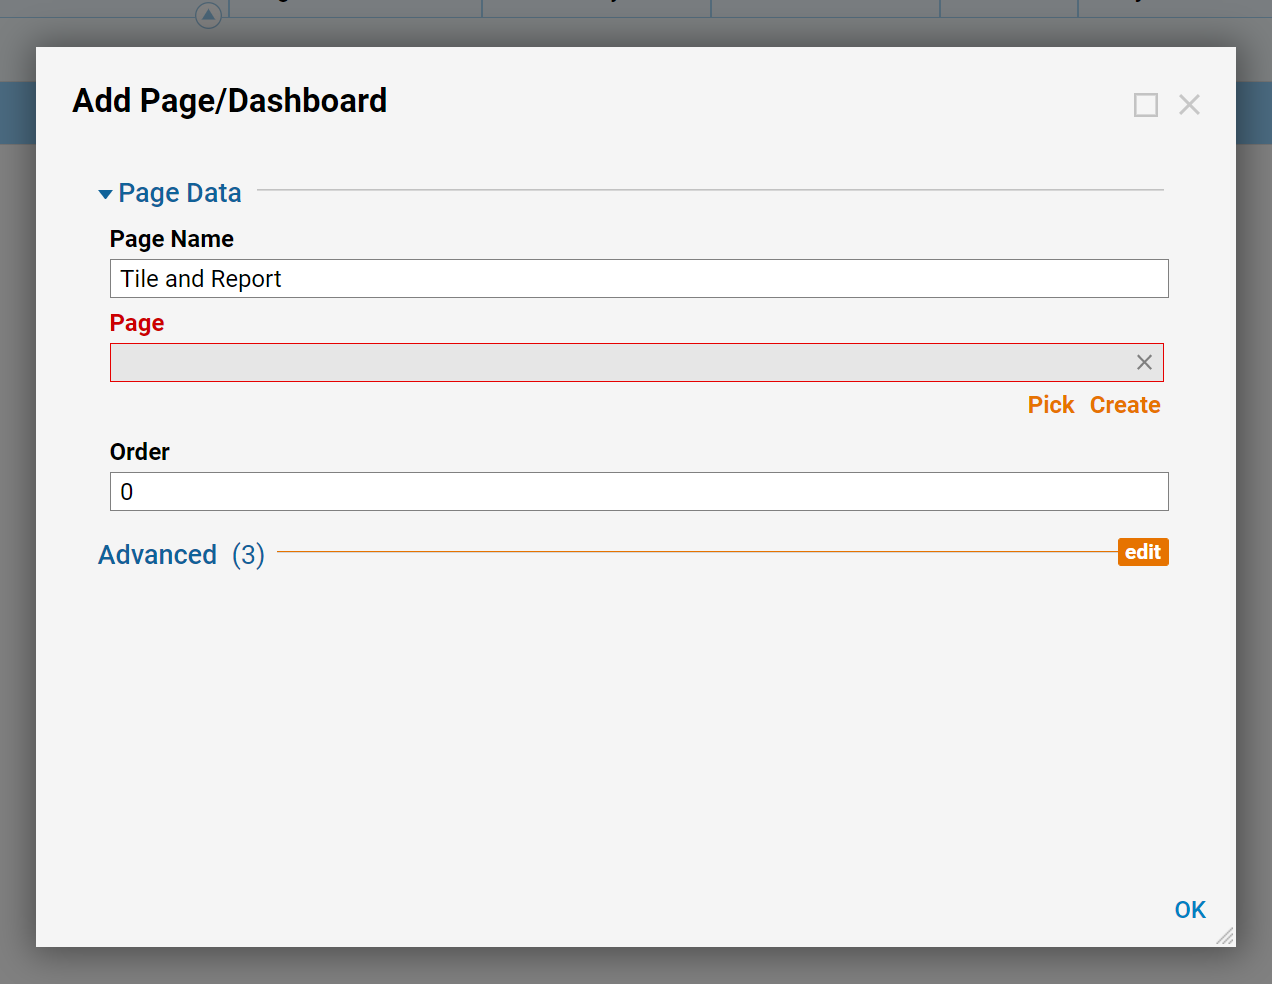
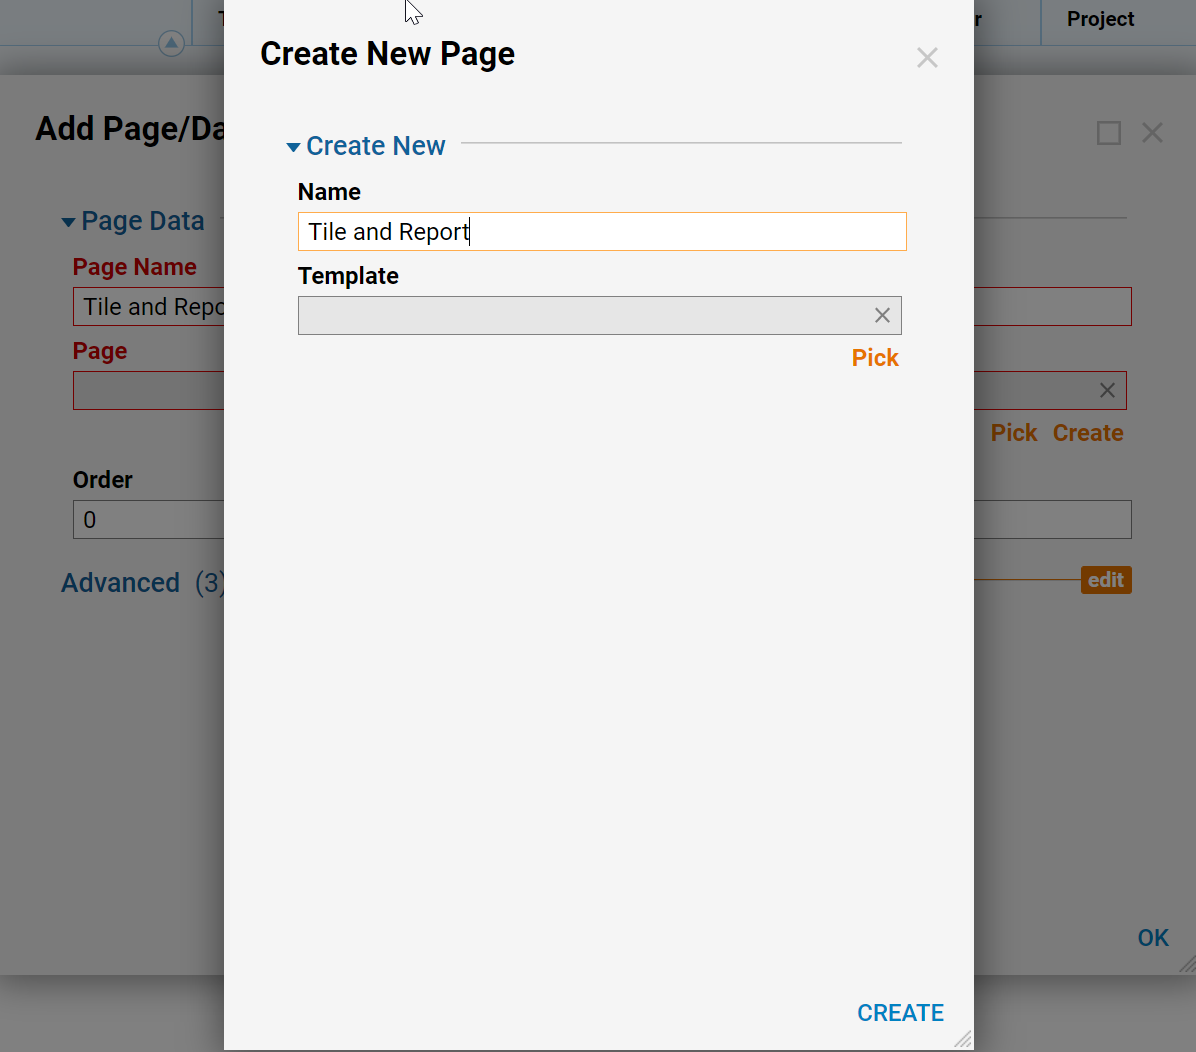
In the Add Page/Dashboard dialog give the Page Data a name then select Create.
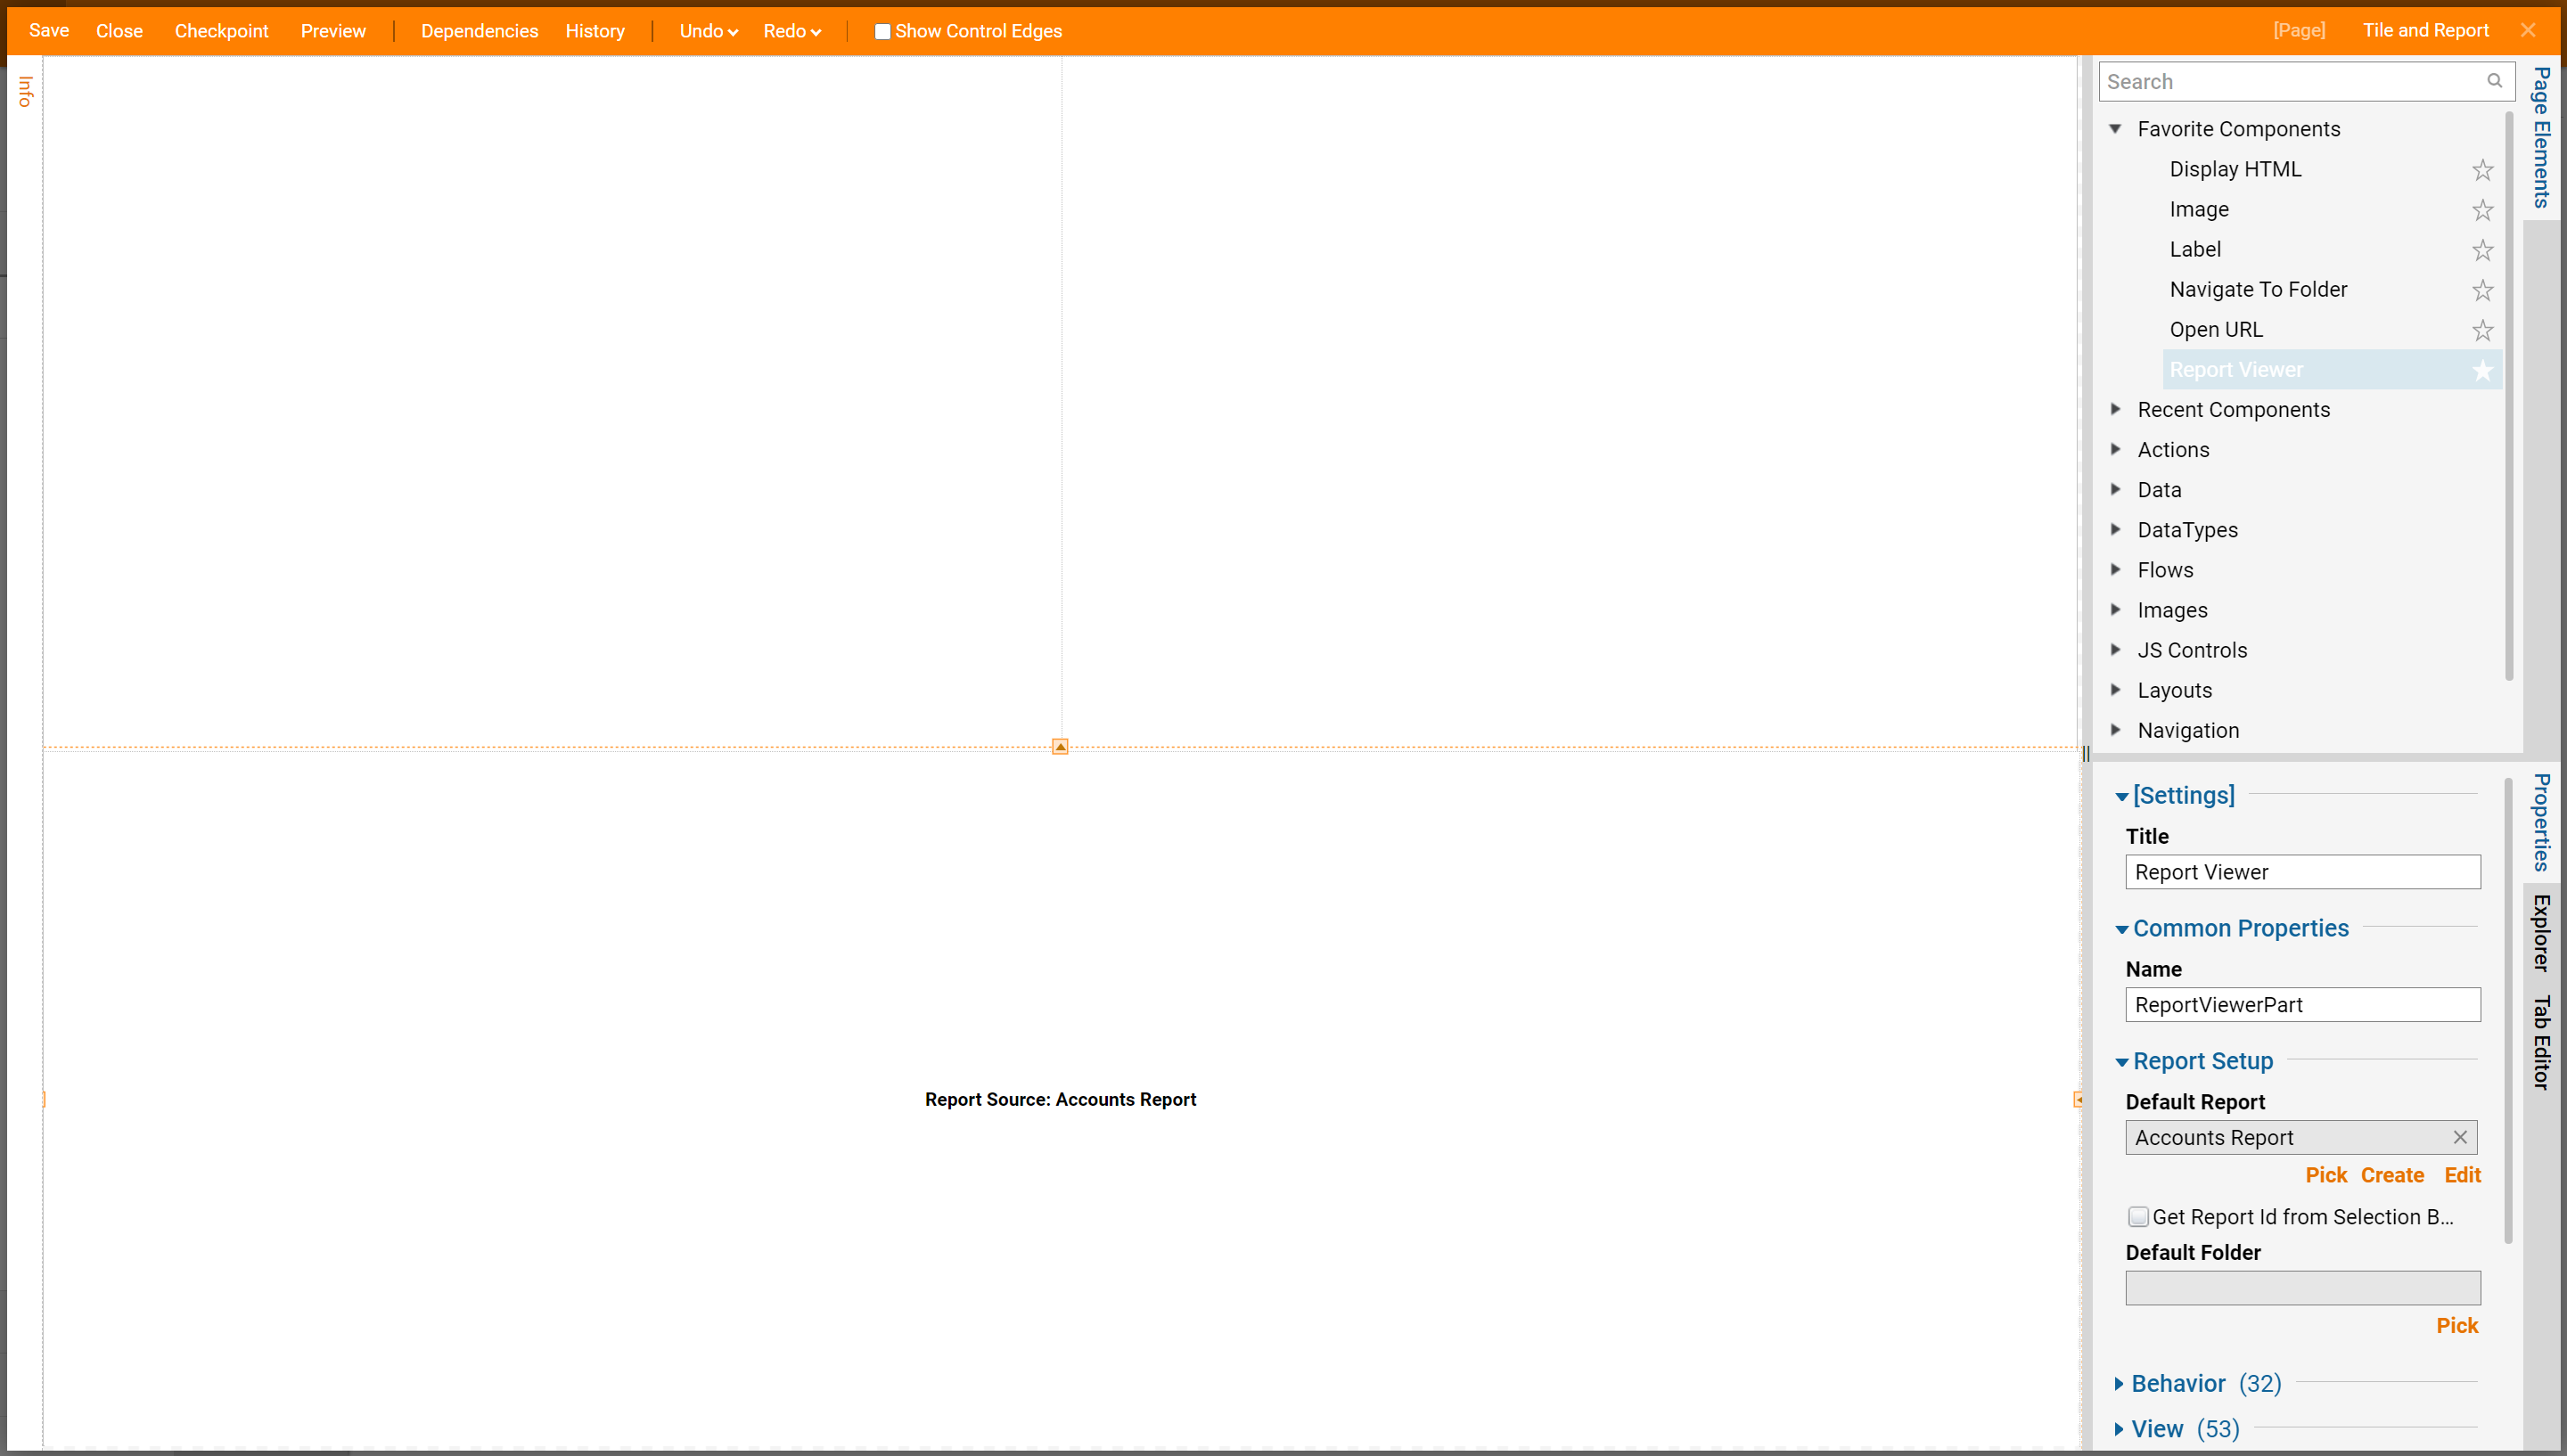
In the Page Designer, in the Page Elements panel add a Report Viewer component to the base of the page. With the Report Viewer selected, navigate to the Properties panel, under Report Setup > Default Report pick the Report that was just created.
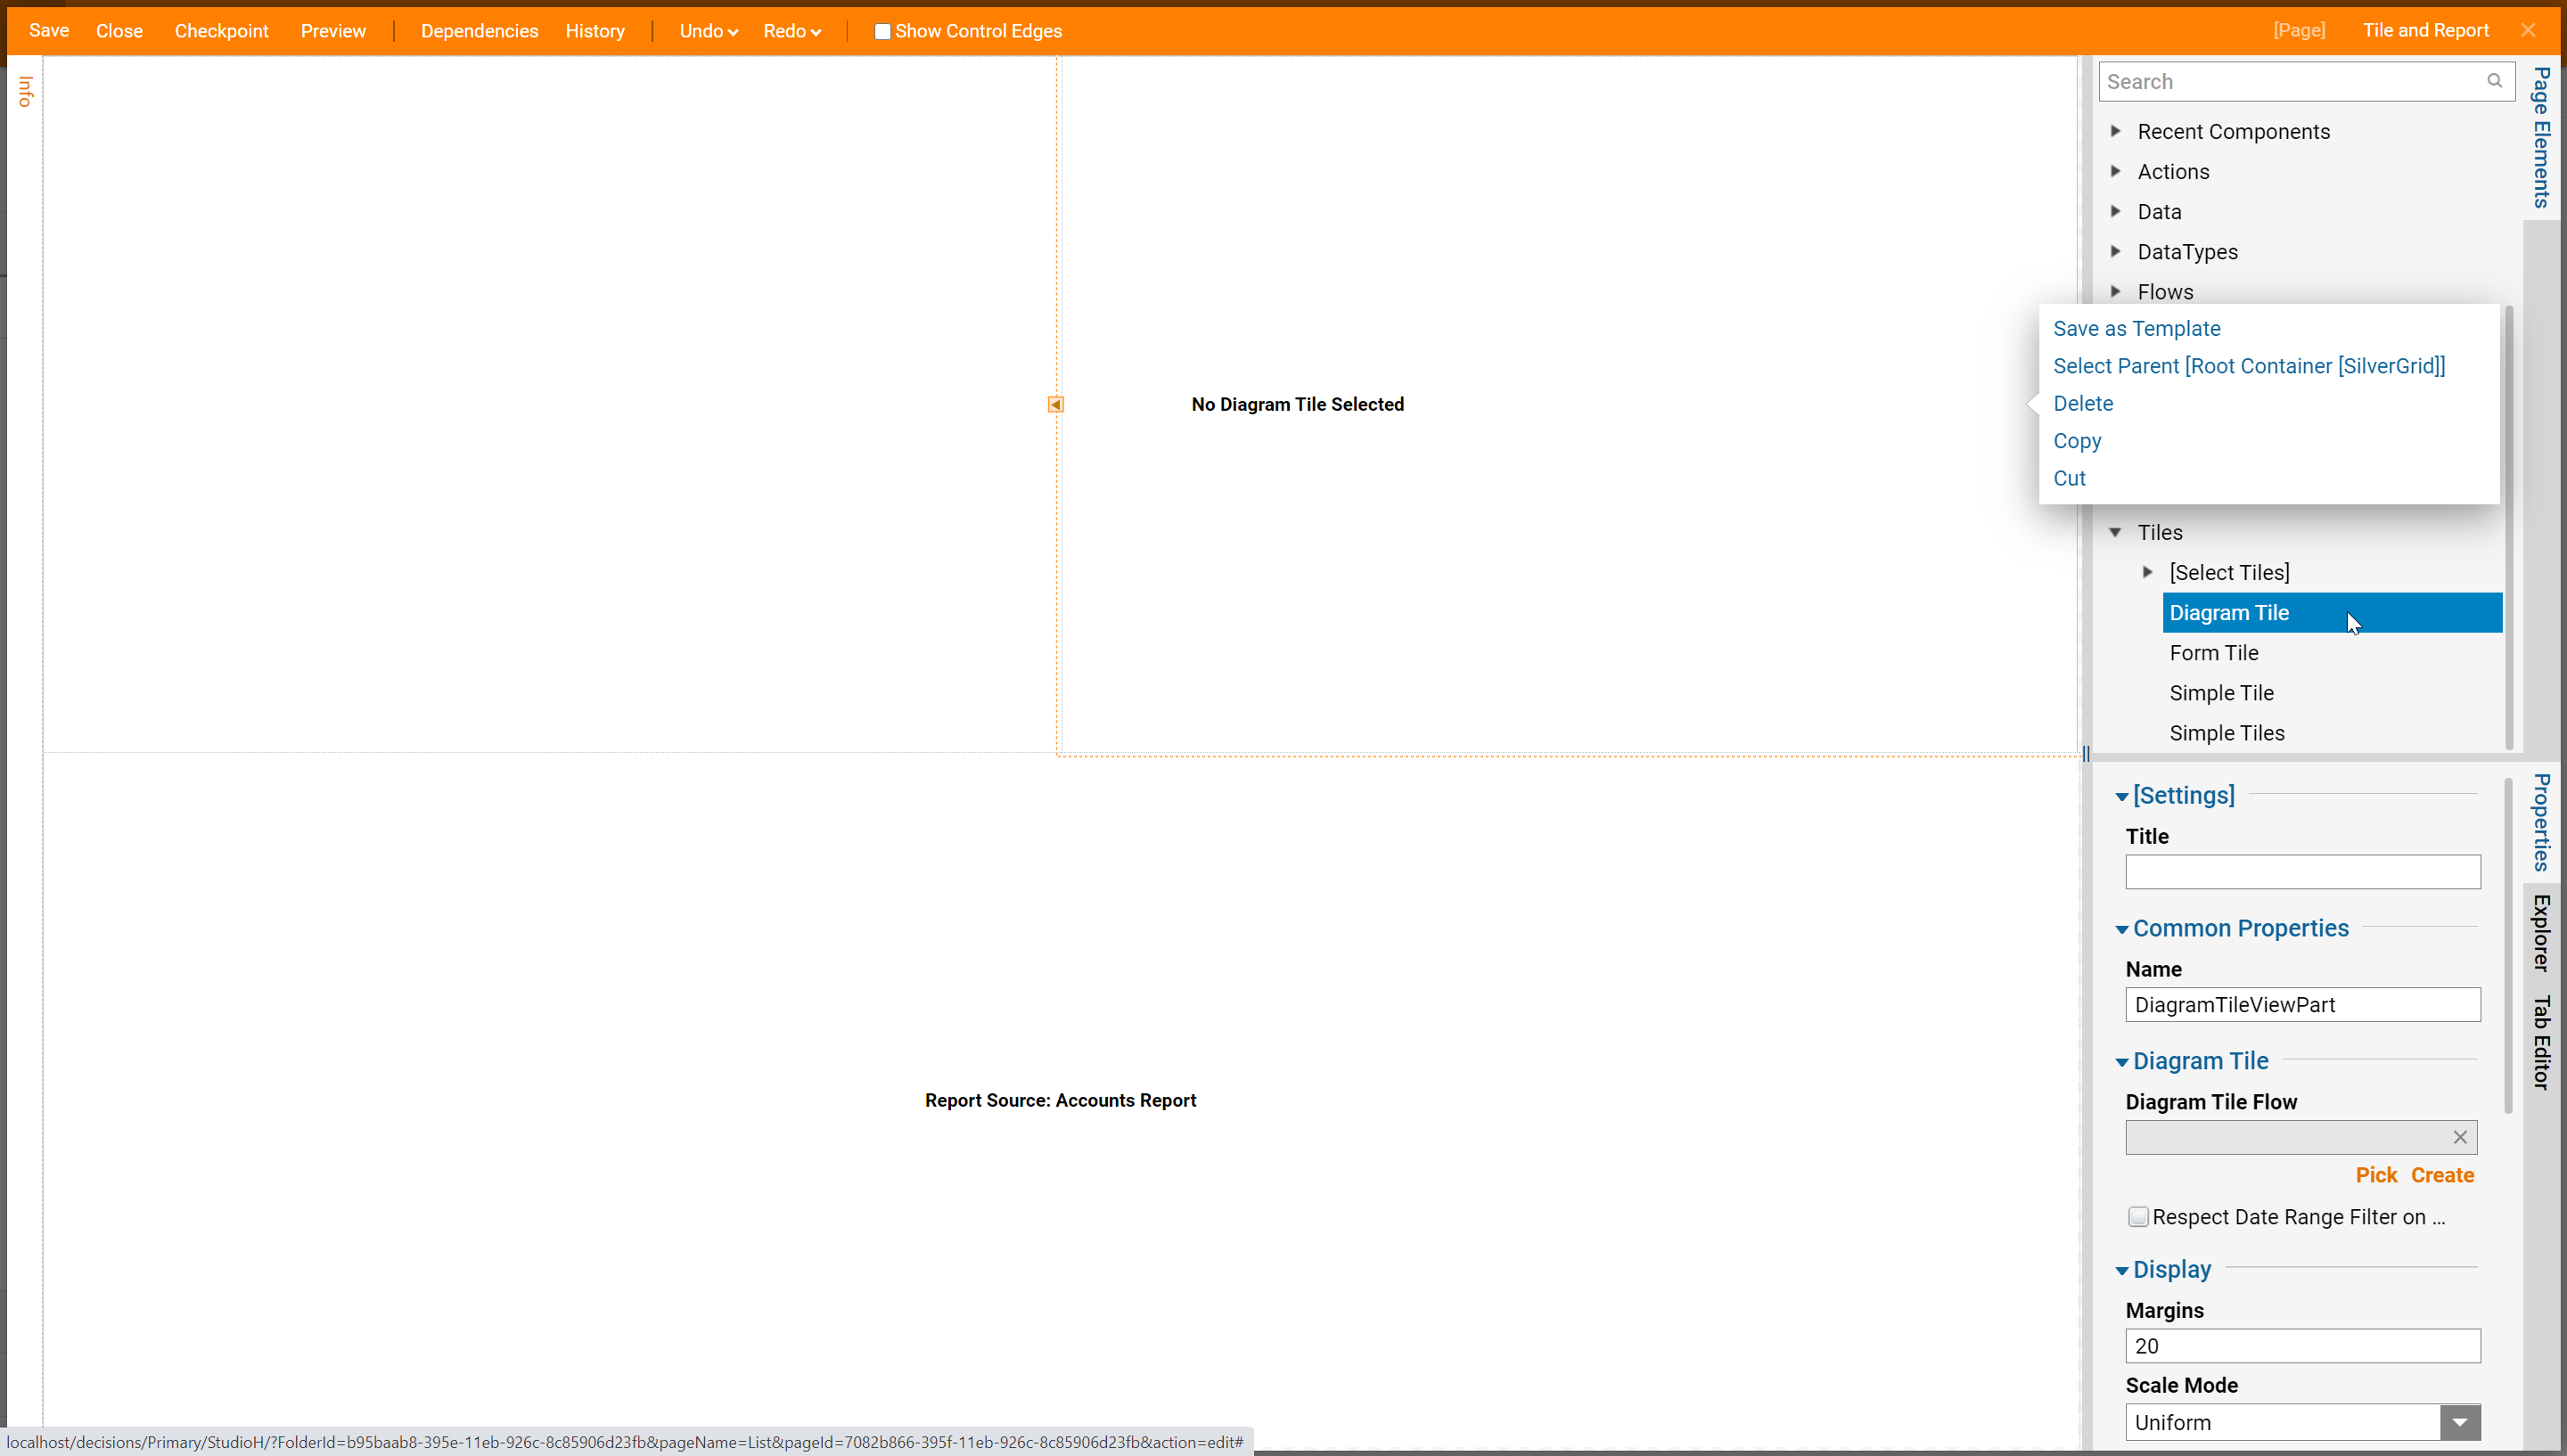
Back in the Page Elements panel expand the Tiles category and drag a Diagram Tile component to the workspace.
With the Diagram Tile selected, in the Properties panel under Diagram Tile > Diagram Tile Flow select Create.
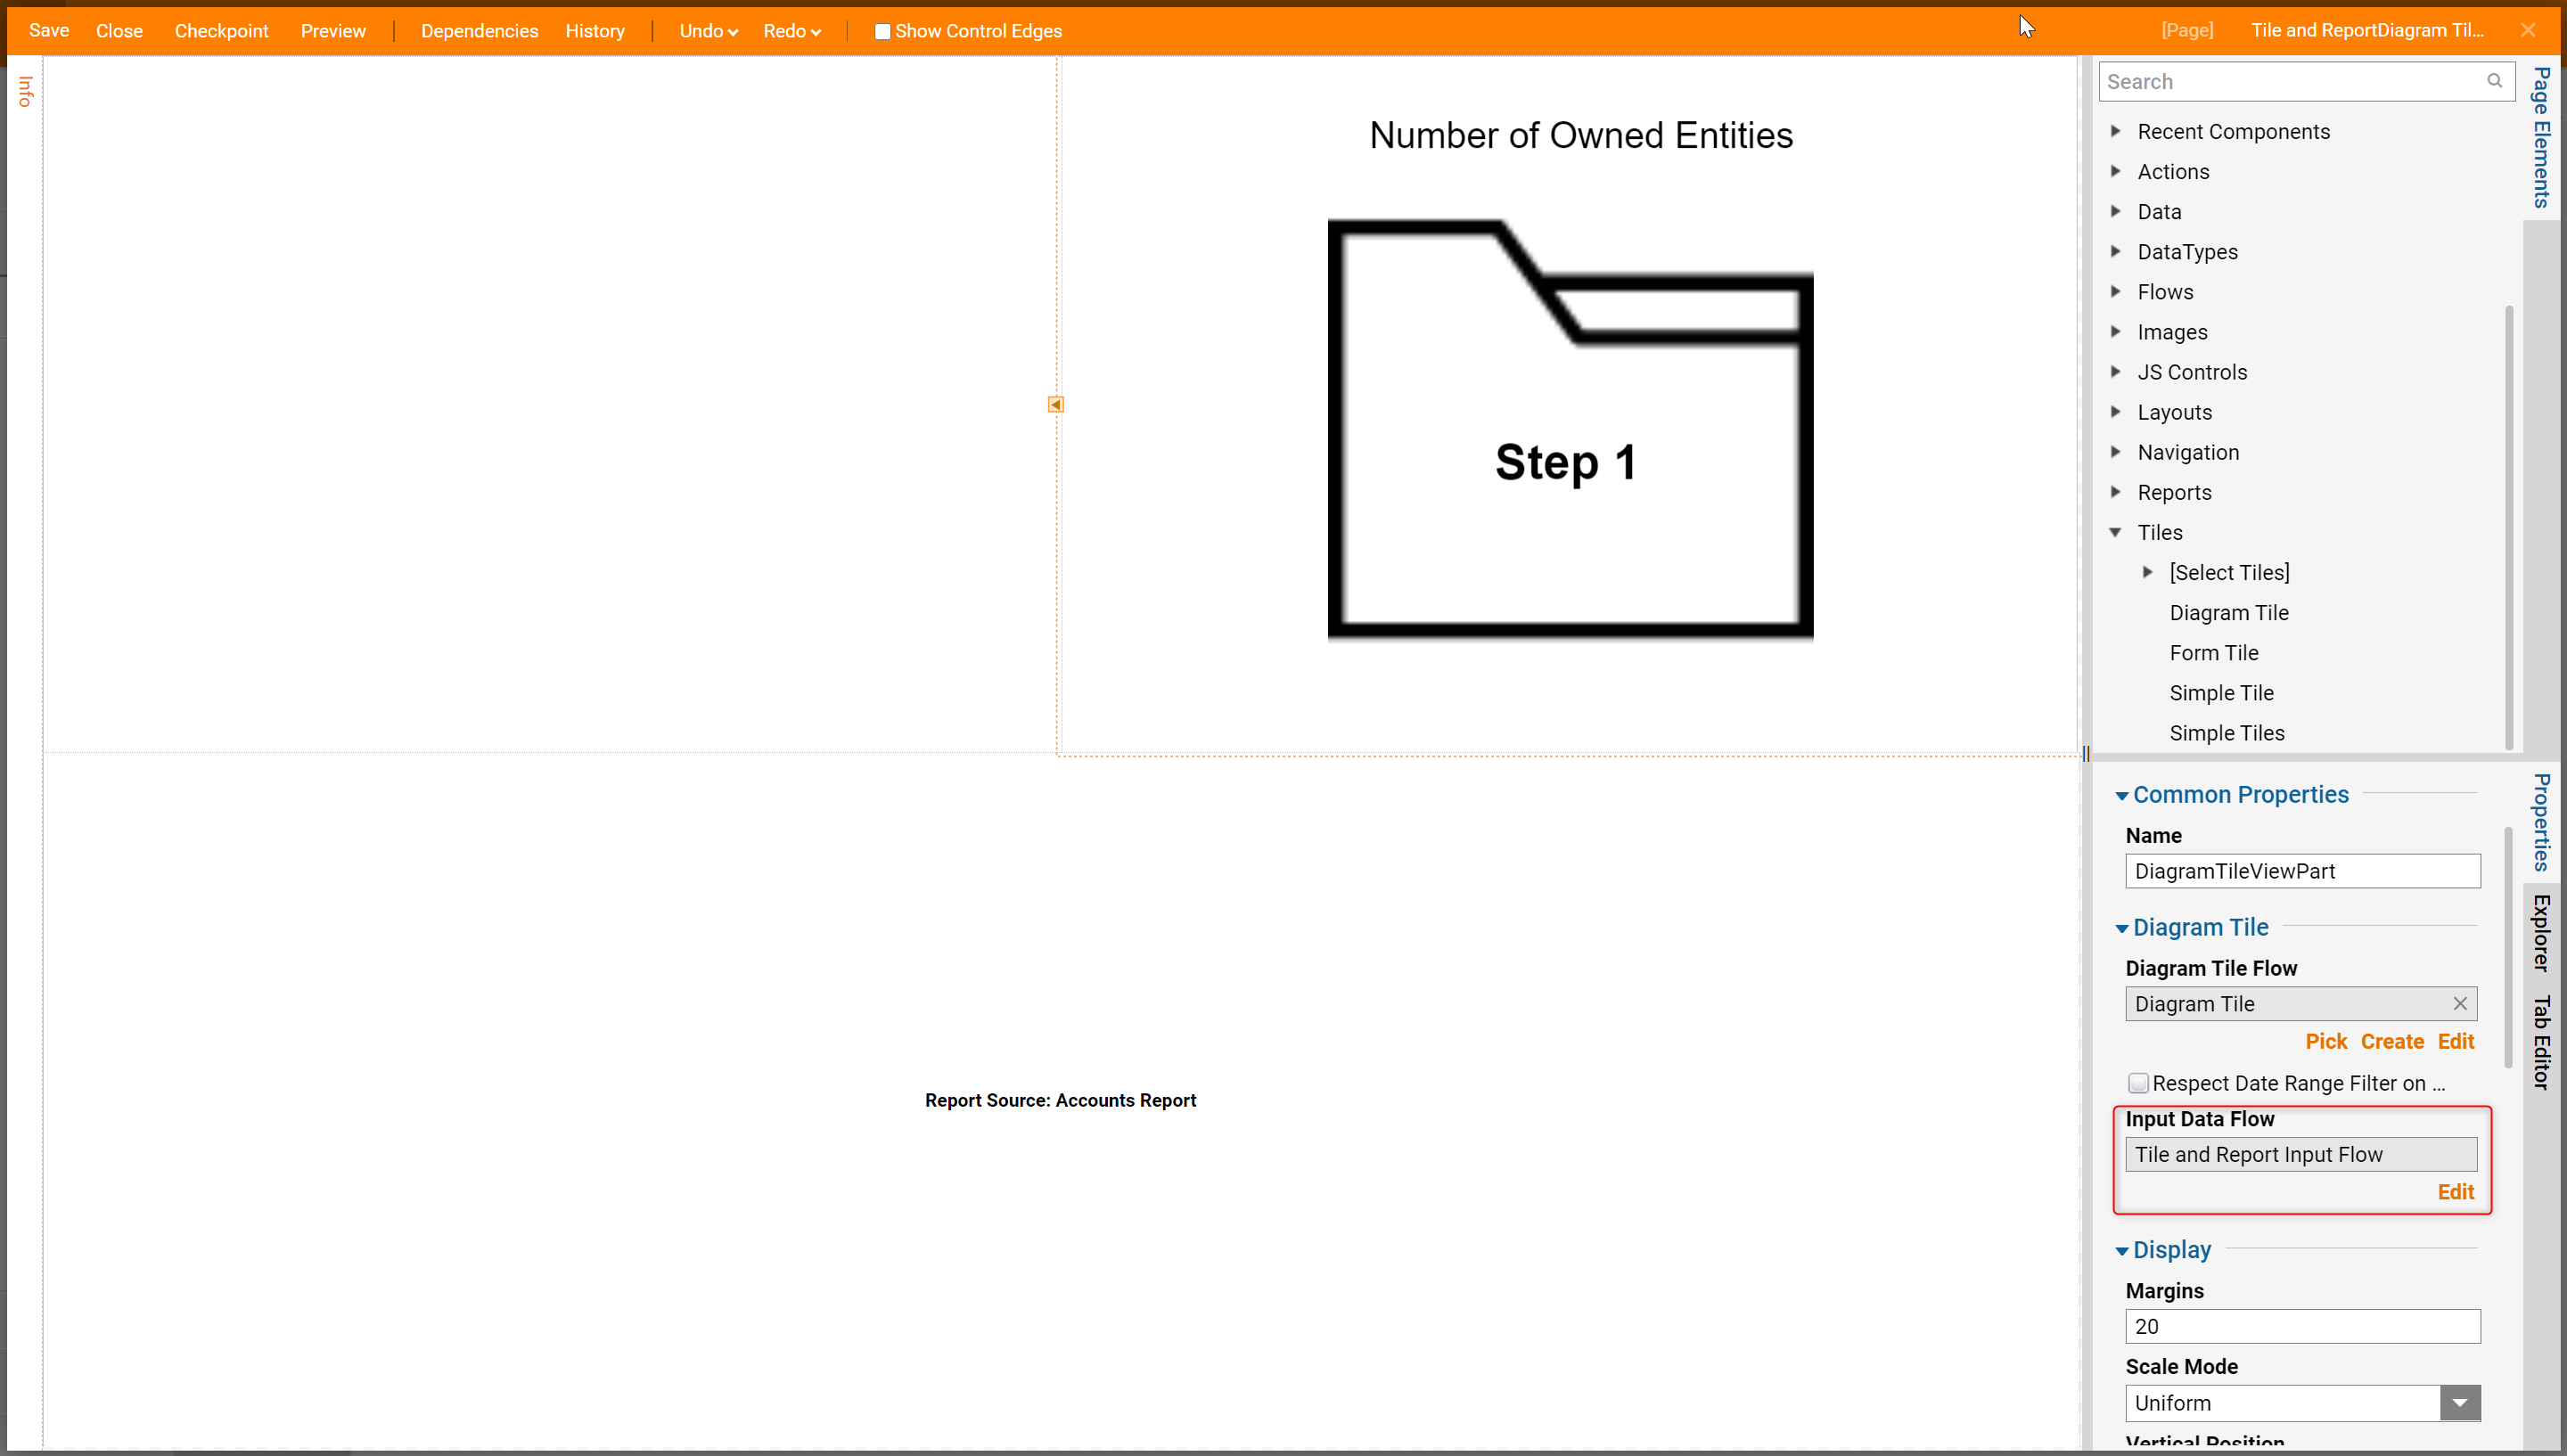
This Diagram Tile has an Image, Drawing < Image, that shows as a folder, a Label - Small named "Number of Owned Entities", and finally, a Label - Medium at the front of the Image.
.png)
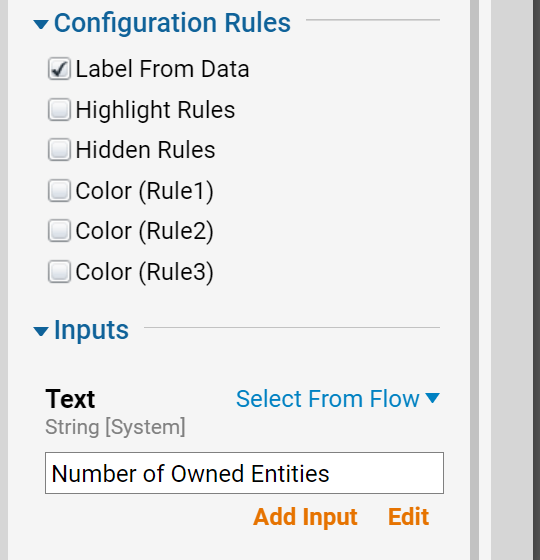
With the Label - Medium selected, in the Properties panel under Configuration Rules check the Label From Data checkbox. With this checkbox set to true an Inputs category will appear. Under Inputs > Text select Add Input and type "Number of Owned Entities".
Save and Close.
Back in the Page Designer, with the Diagram Tile selected, in the Properties panel under Diagram Tile > Input Data Flow select Edit.
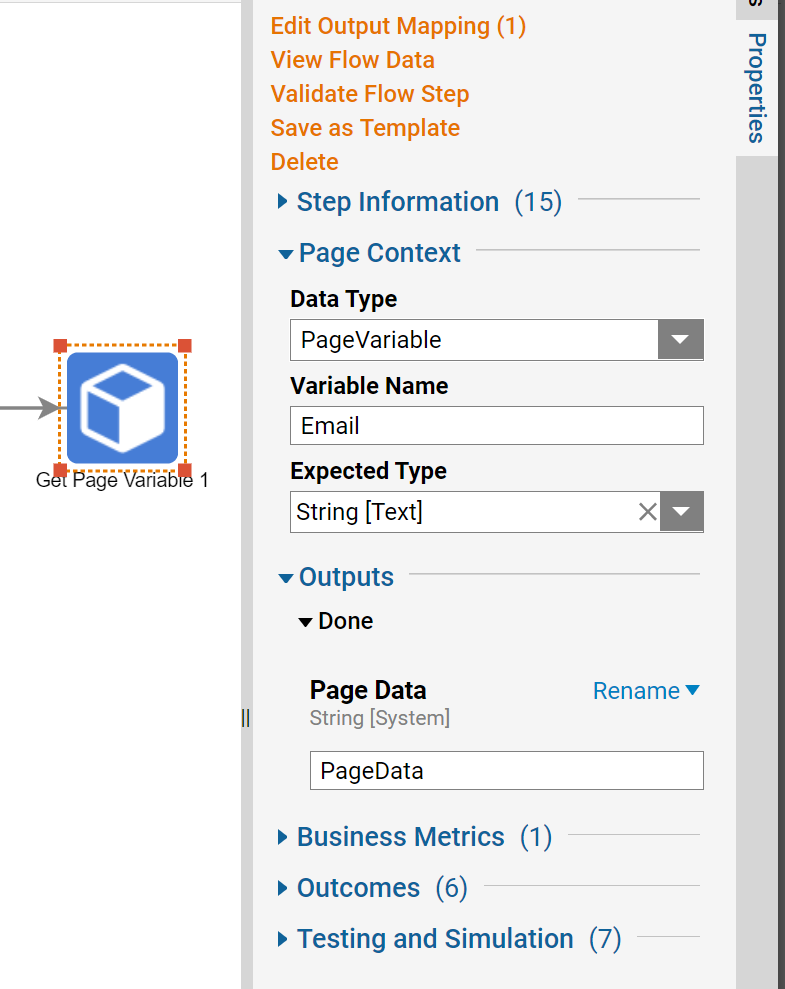
In the Flow Designer, add a Get Page Variable step to the workspace. Configure the step by changing the Page Context > Data Type to PageVariable. The Variable Name needs to be the same name that was established in the Report. In this example, the Variable Name is "Email".
On the Done path of the Get Page Variable step, add a Fetch Entities step. For the Type Name choose ElementRegistration.
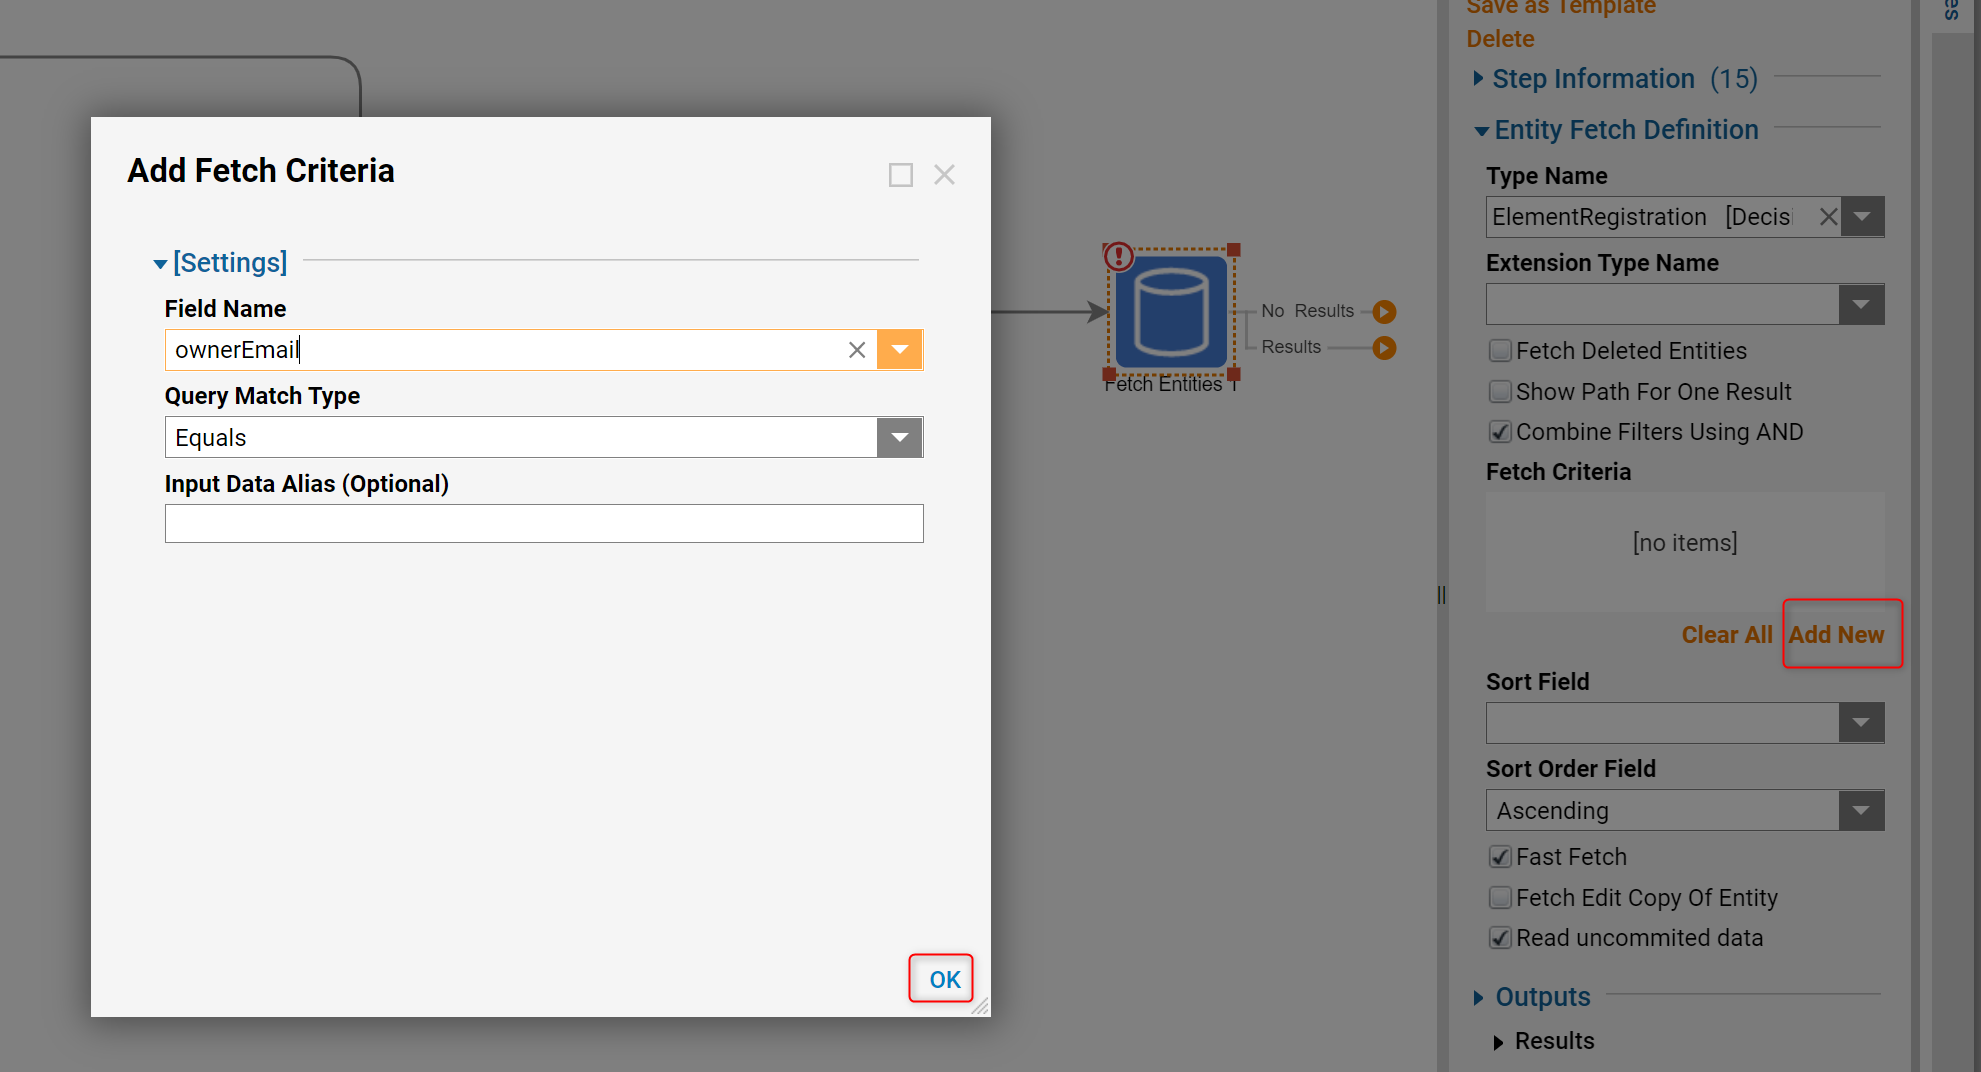
Under Fetch Criteria select Add New.
Within the Add Fetch Criteria dialog, choose ownerEquals as the Field Name and Equals as the Query Match Type. Select OK to Close.
On the Results path, off of the Fetch Entities step, add a Create Data step. Under Data > Data to Create, select Show Editor.
In the Data Definition dialog, name the Data to Create "Count" with the type "String". For the Input select EntityResults.Count. Close the dialog.
.png)
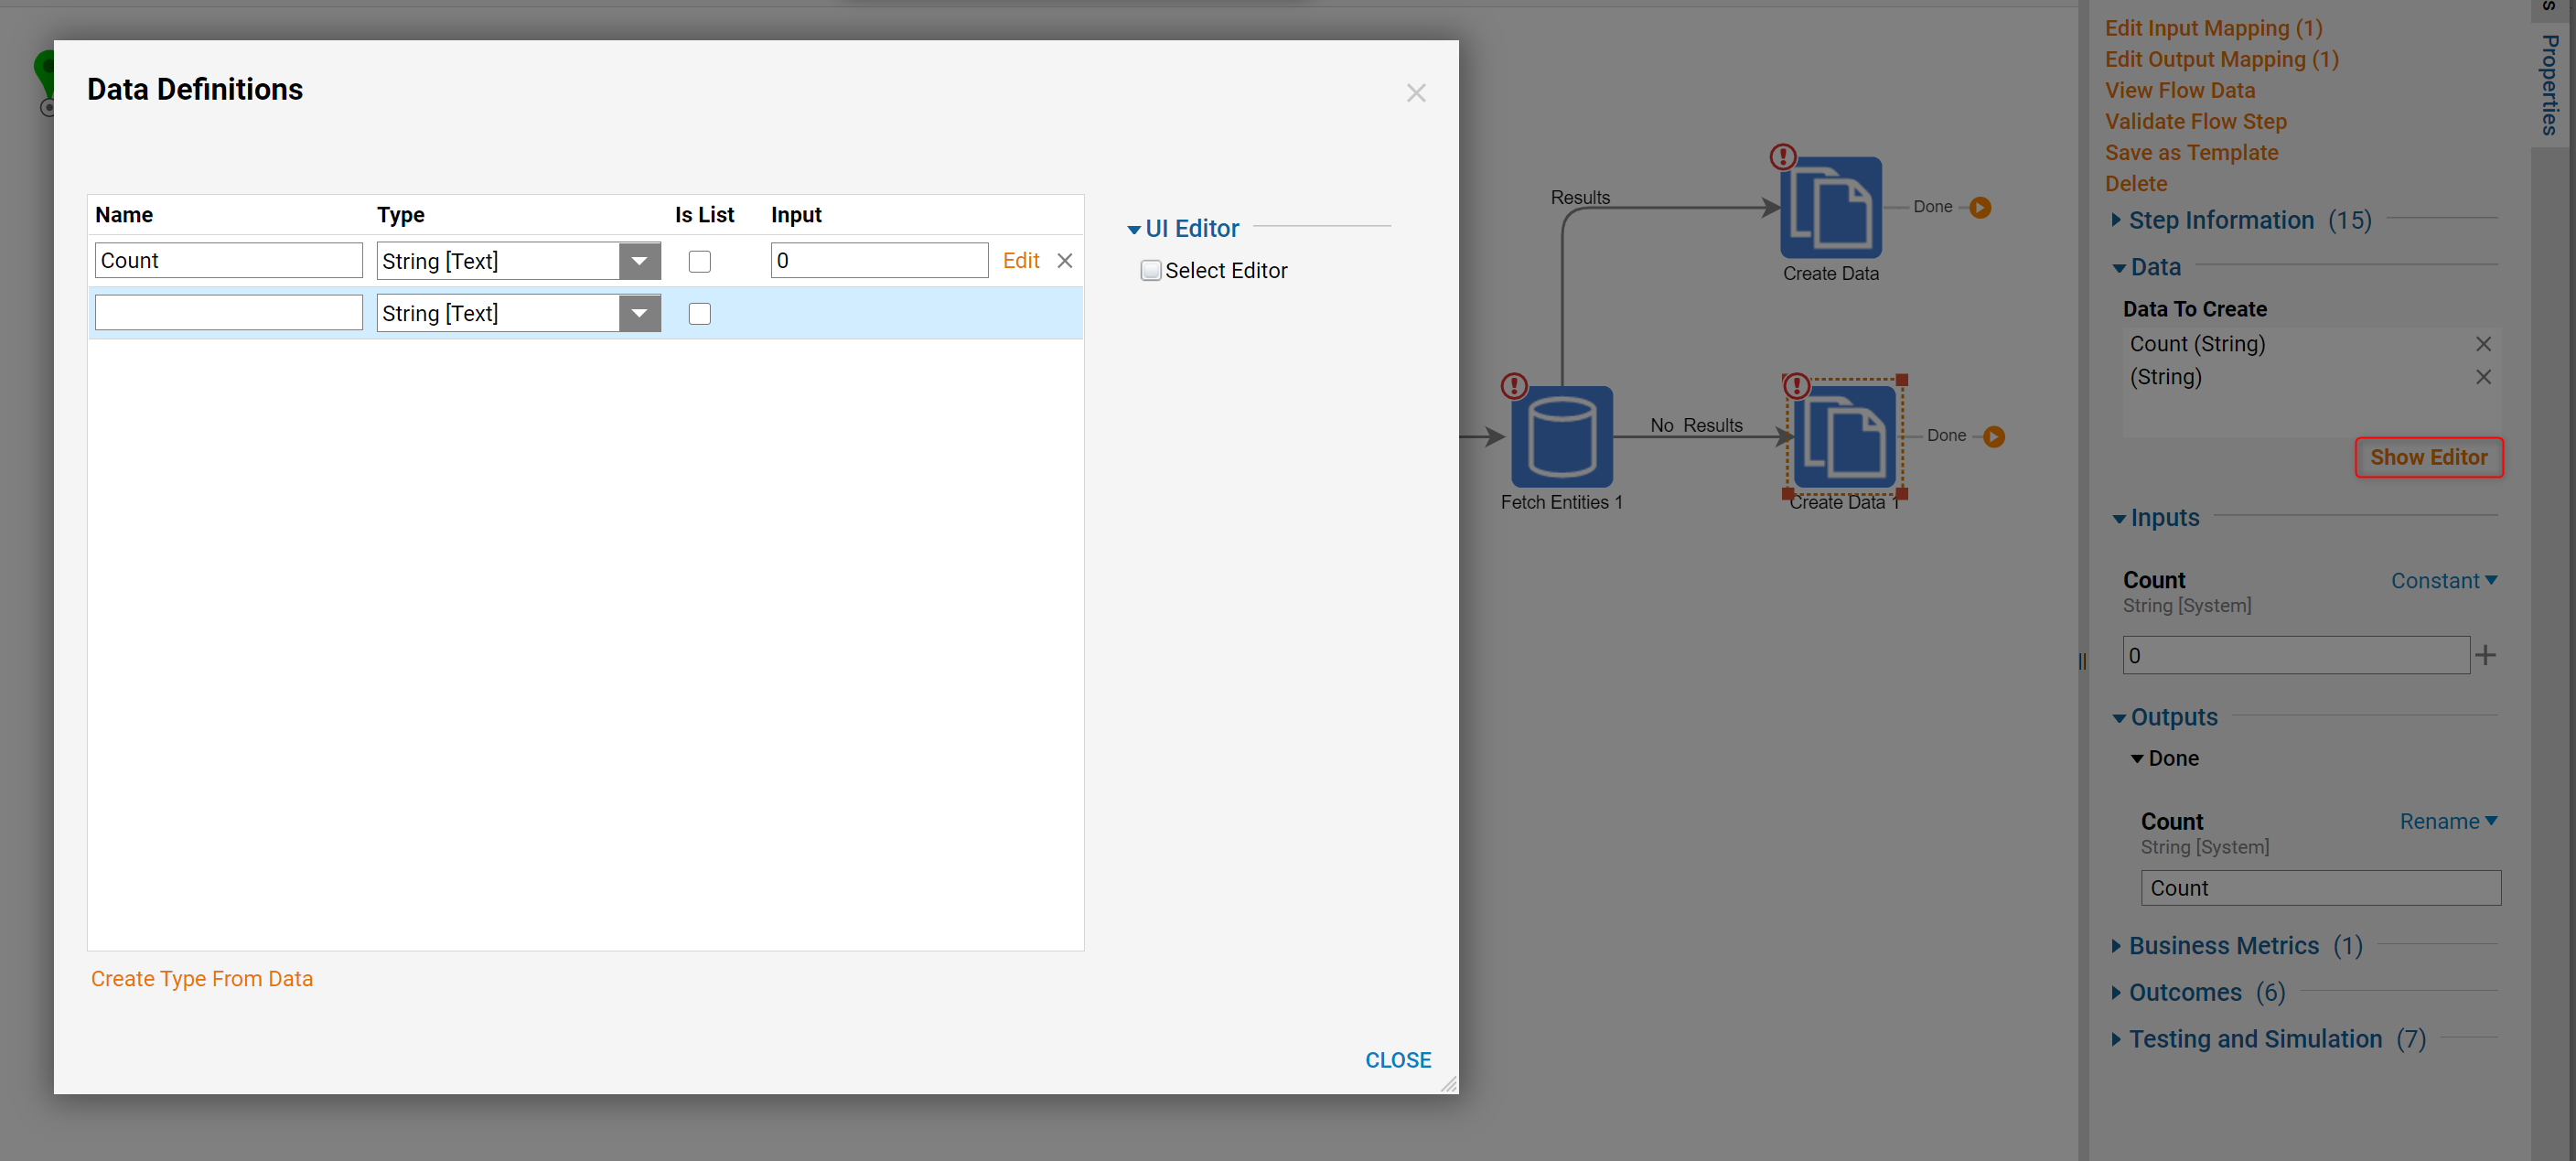
On the No Results path, off of the Fetch Entities step, add a Create Data step. Under Data > Data to Create, select Show Editor.
In the Data Definition dialog, name the Data to Create "Count" with the type "String". As the Input choose "0" as the constant. Close the dialog.
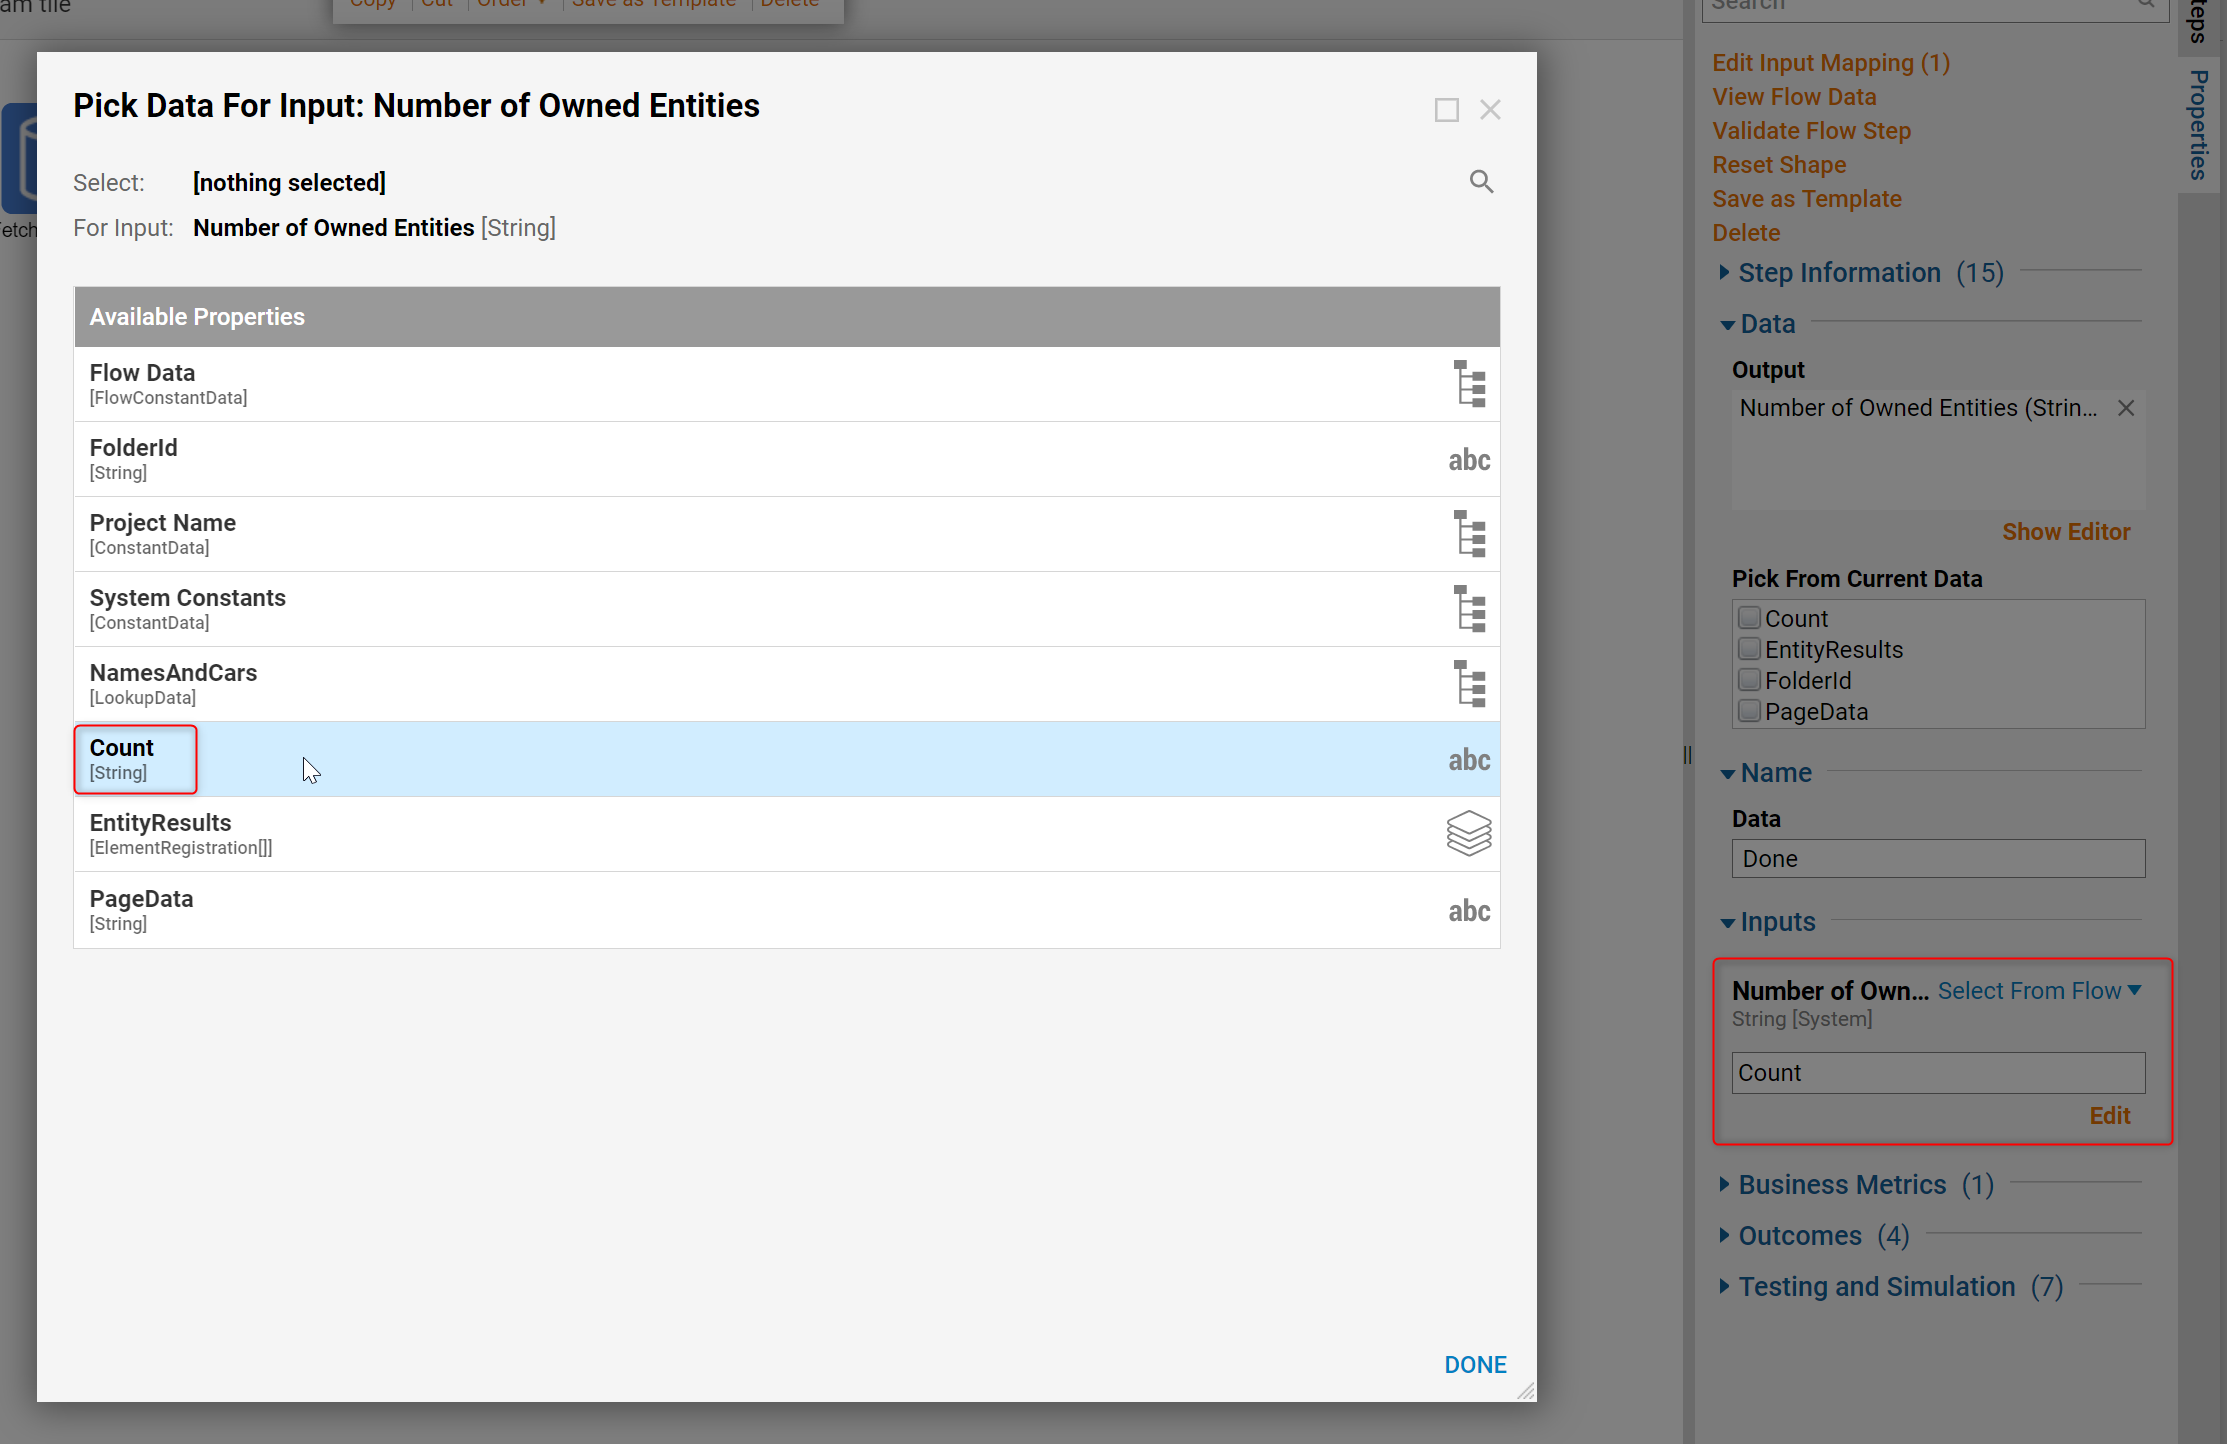
On the End step, for the Number of Owned Entites Input select Count from flow.
The Flow is now complete

Save and Close the Flow.
Back in the Designer Folder, navigate to the Page view. Notice the number within the Diagram Tile changes when selecting different Accounts within the Report.
