Overview
The Project Dashboard is like a control center for projects, making it easy for users to find and manage information quickly. It helps keep track of project progress, important dates, and any issues that come up. By keeping everything in one place and making it easy to spot problems early on, it helps projects run more smoothly. This document explains all the information within the Project Dashboard and walks through the process of how to customize the dashboard.
| Dashboard Name | Description | Screenshots | |
| Dashboard | Info | The Info tile shows the high-level view of the Project. Displays the Project name, description, and icon selected when creating the Project. Under the Project description, the dates of the last project modification and the last import and export will be displayed as labels. The Project Health score will display a link to open the Health details. Users can also start creating Flow, Rule, Data Type, and Forms by clicking on the tiles on the surface dashboard. | 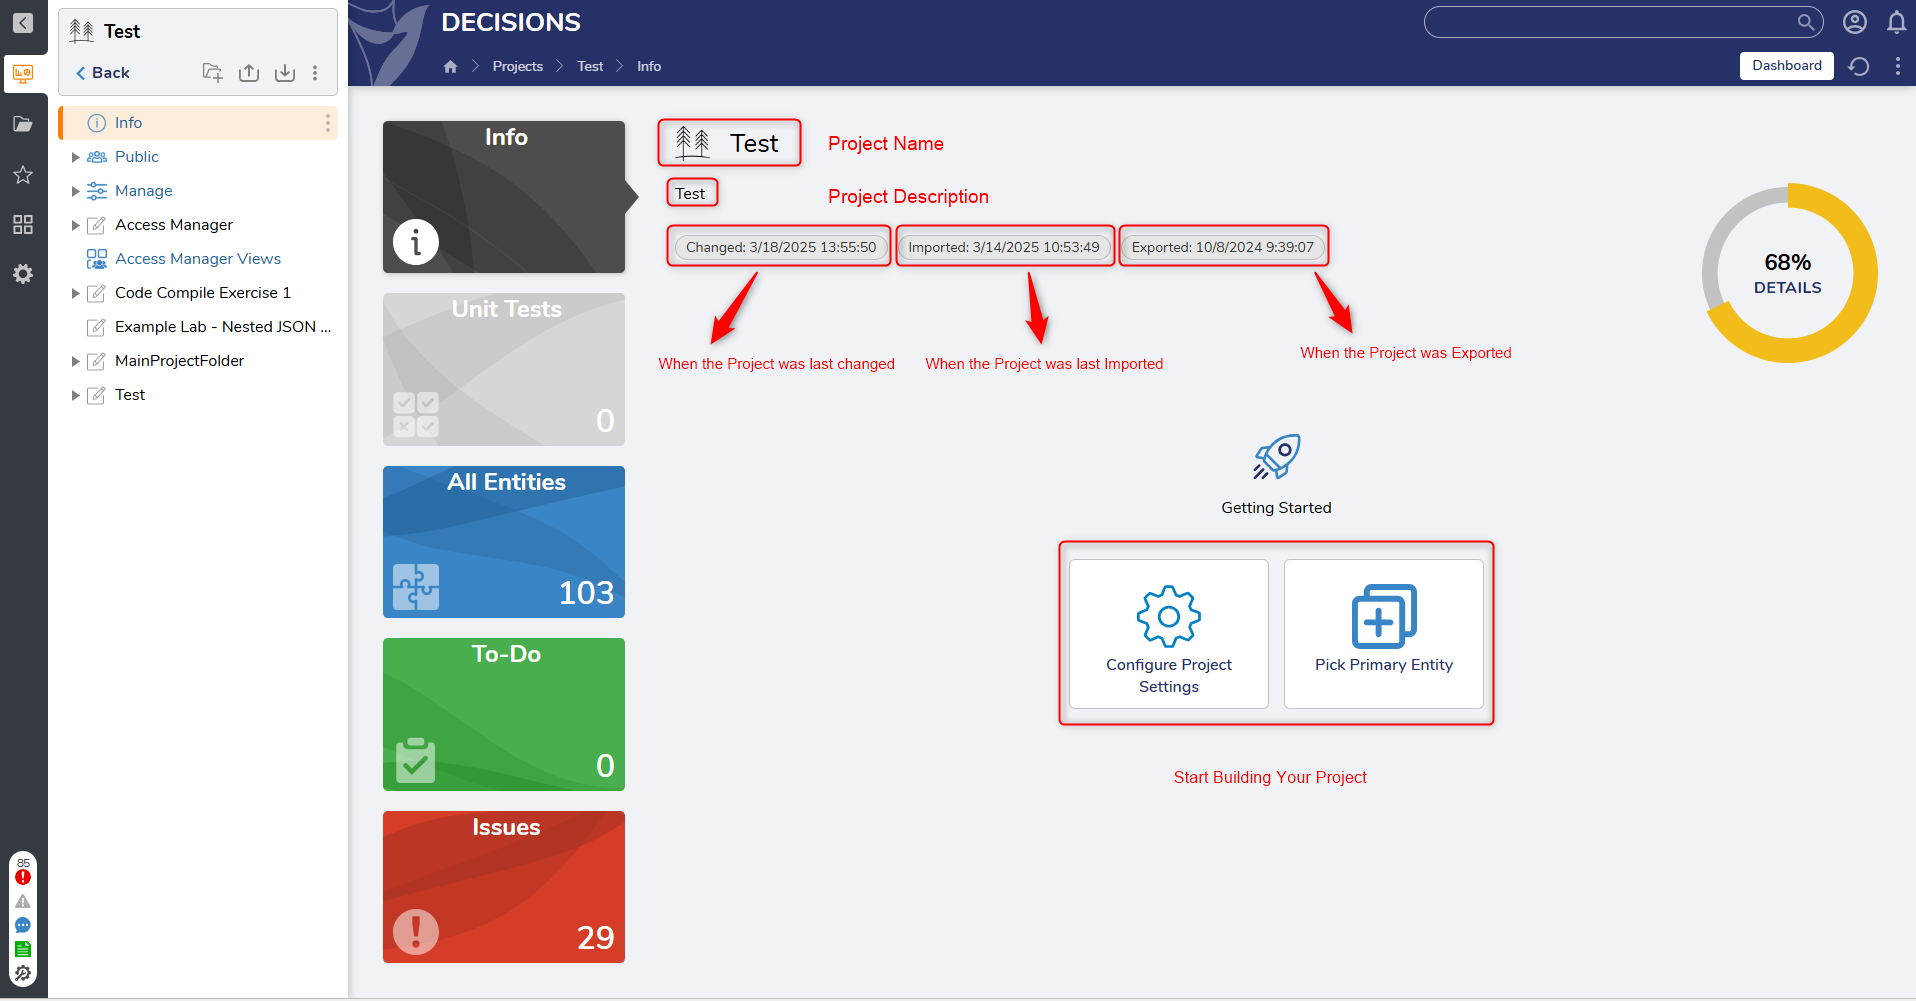 |
| Unit Tests | The Unit Tests Tile provides a comprehensive overview of all the unit tests available in the Designer folders. It follows the same structure as the Folder tree, making it easy to navigate. By selecting the Run All Tests option, users can run all the tests for a Project at once. After running the tests, users can expand the Test results to view which tests are passing and which ones are failing. For failed tests, users can click on them to directly access and modify the test in the Designer. This allows users to analyze and modify tests as needed. | 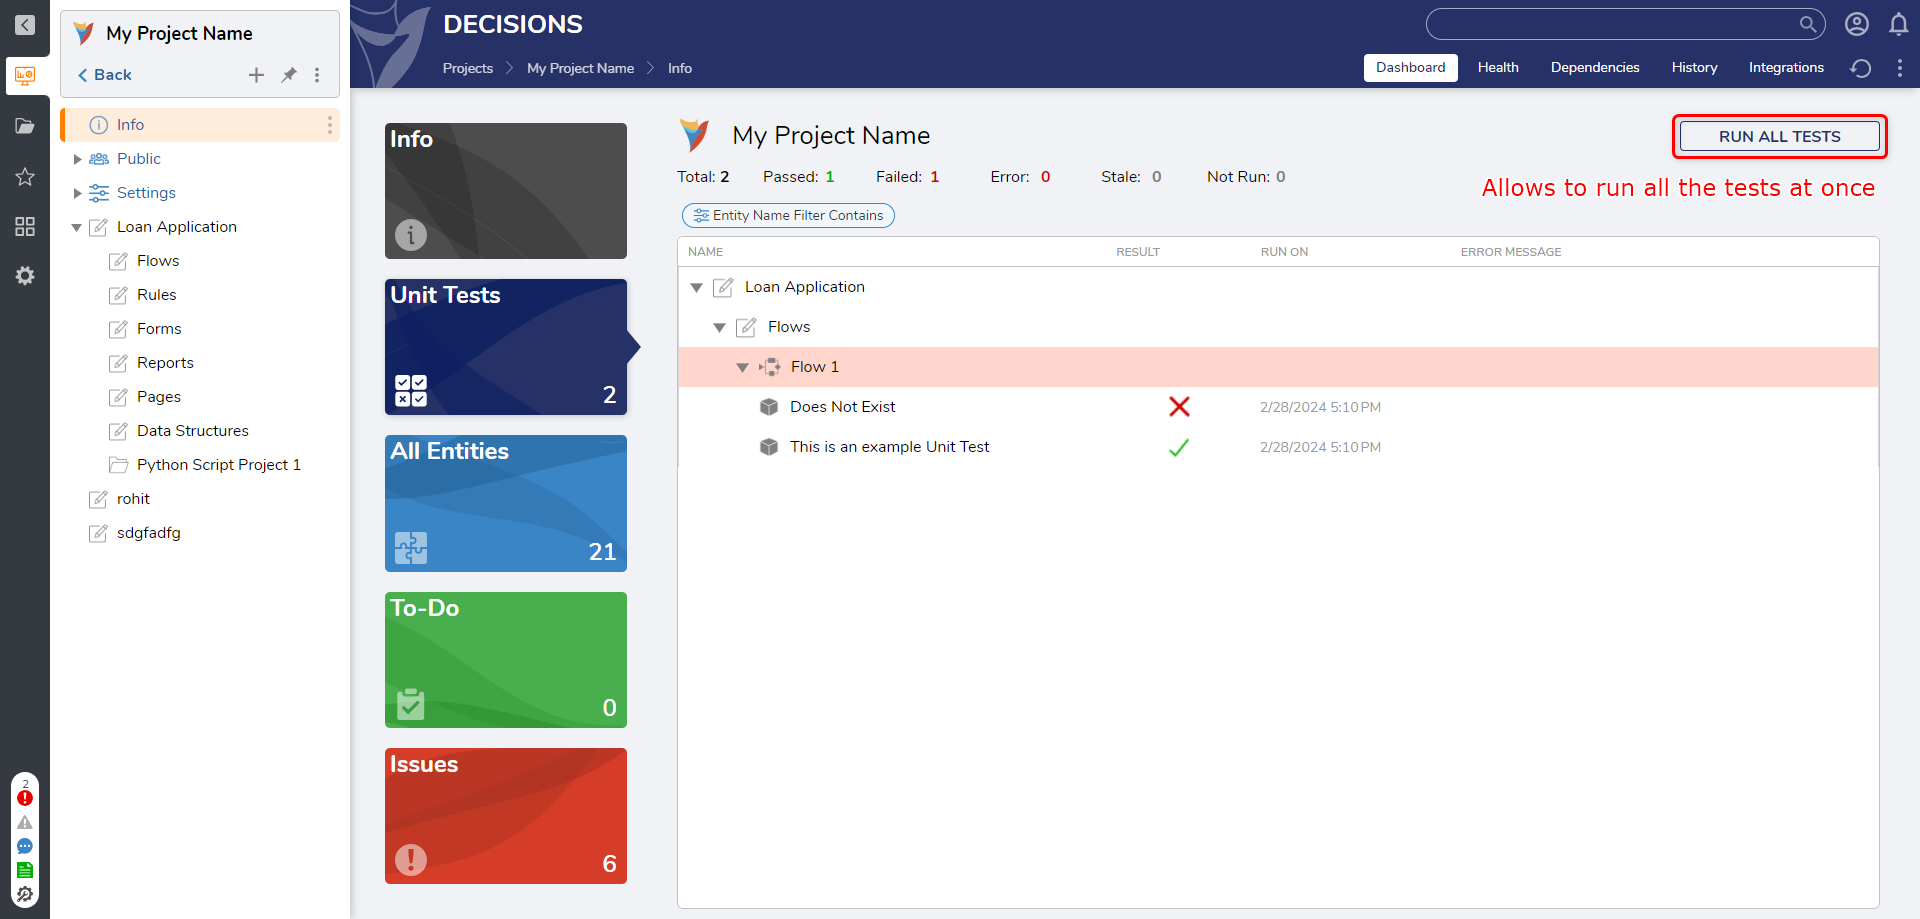 | |
| All Entities | All Entities show a report displaying all Project entities, such as Flows, Forms, Rules, Reports, Pages, and Project Constants, facilitating a quick overview of the Project's structure and components. | 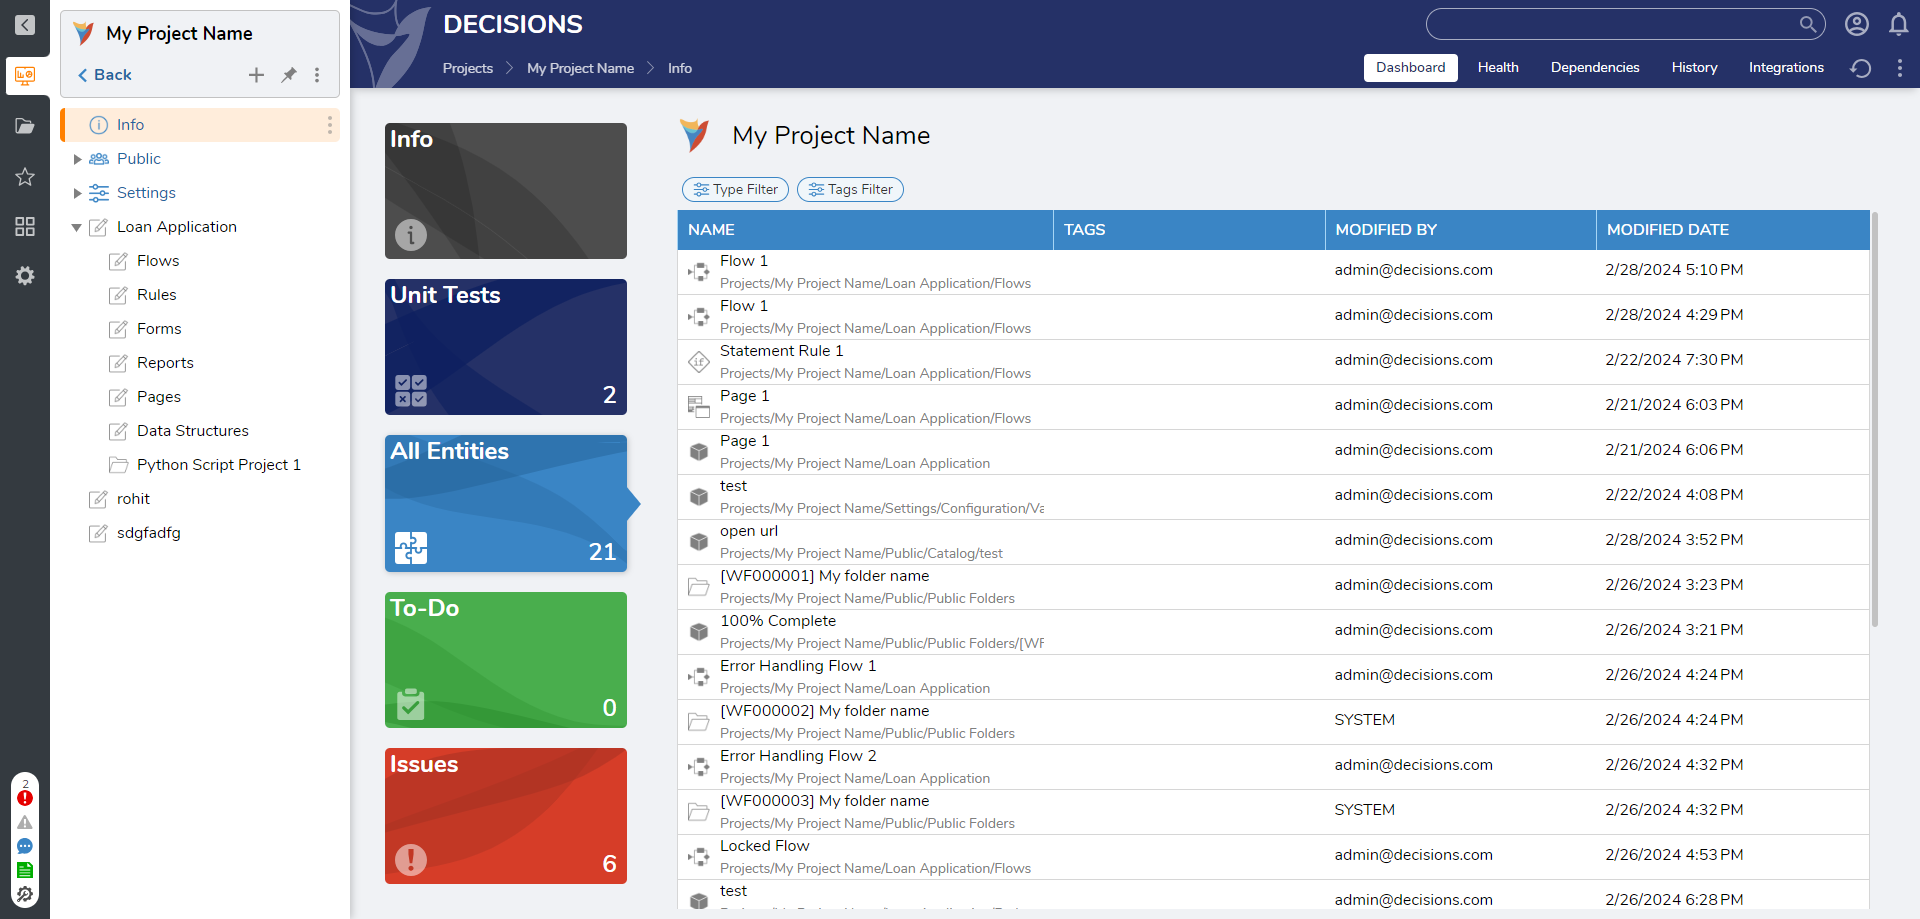 | |
| To-Do | The To-Do Report presents an overview of assigned tasks, allowing users to add, review, and work on them. It enables task delegation and assignment, fostering transparent communication and accountability among accounts and/or groups. | 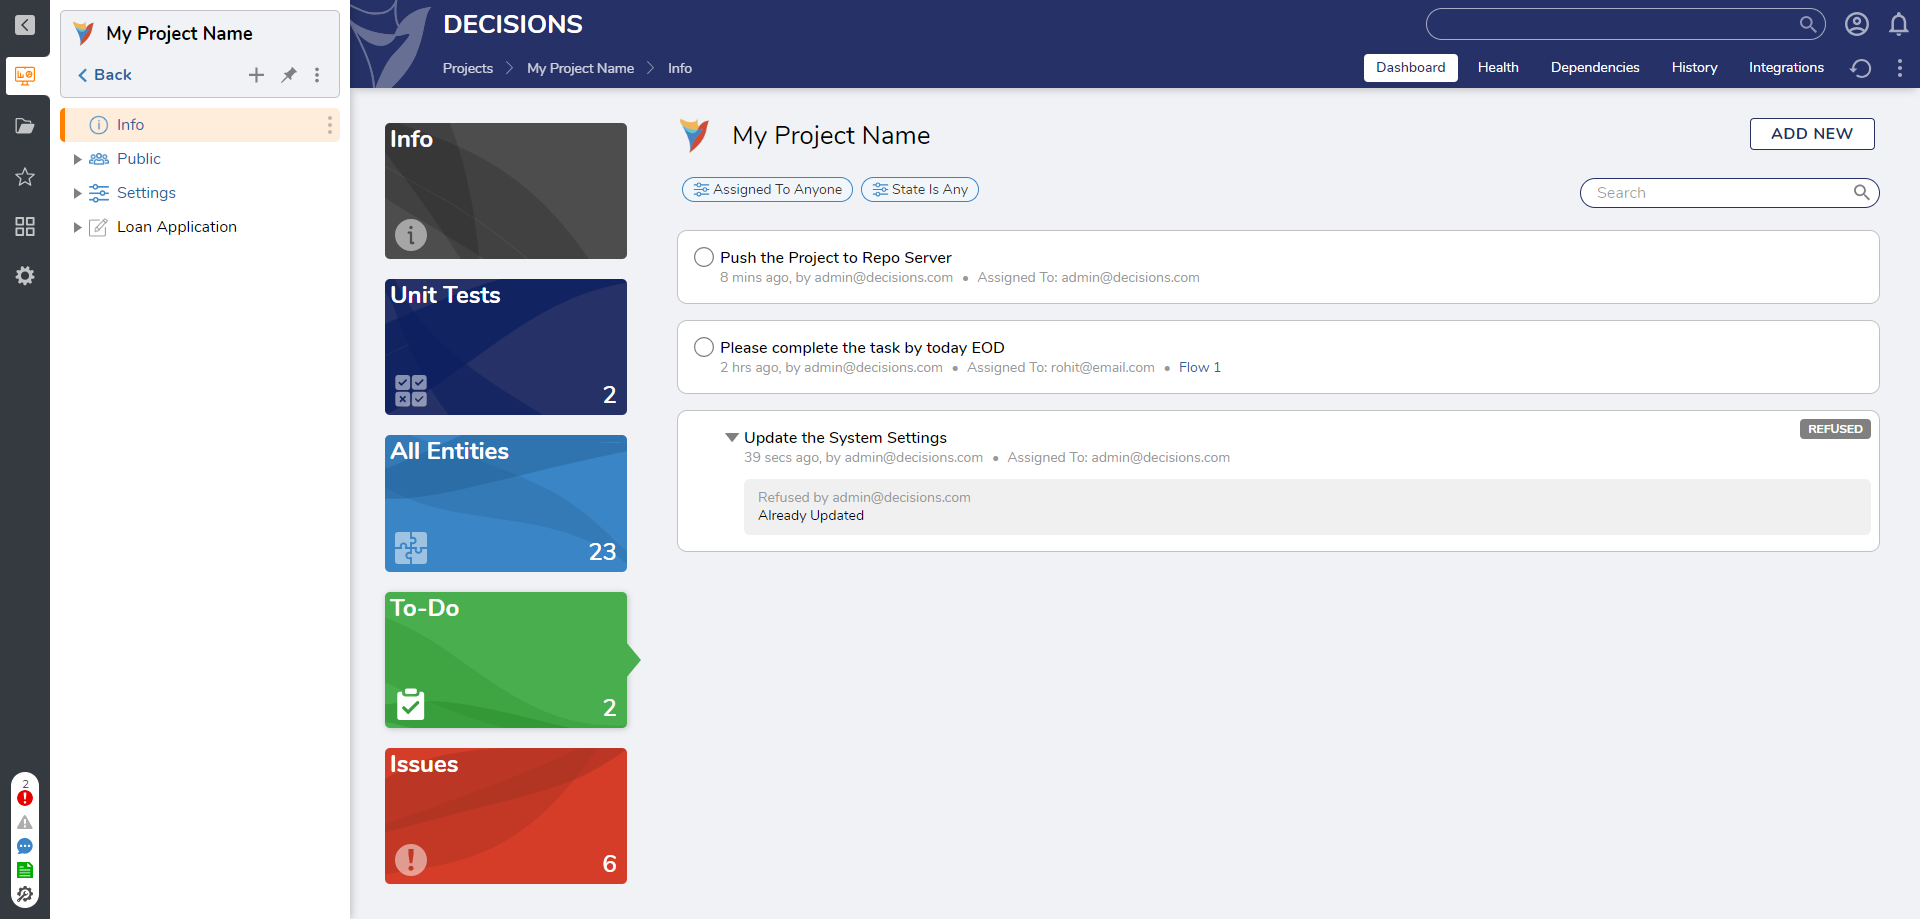 | |
| Issues | The Issues Report is a useful tool for identifying and resolving validation issues efficiently. Users can navigate to elements to address these issues and resolve them, ensuring the Project is error-free with no validations present. | 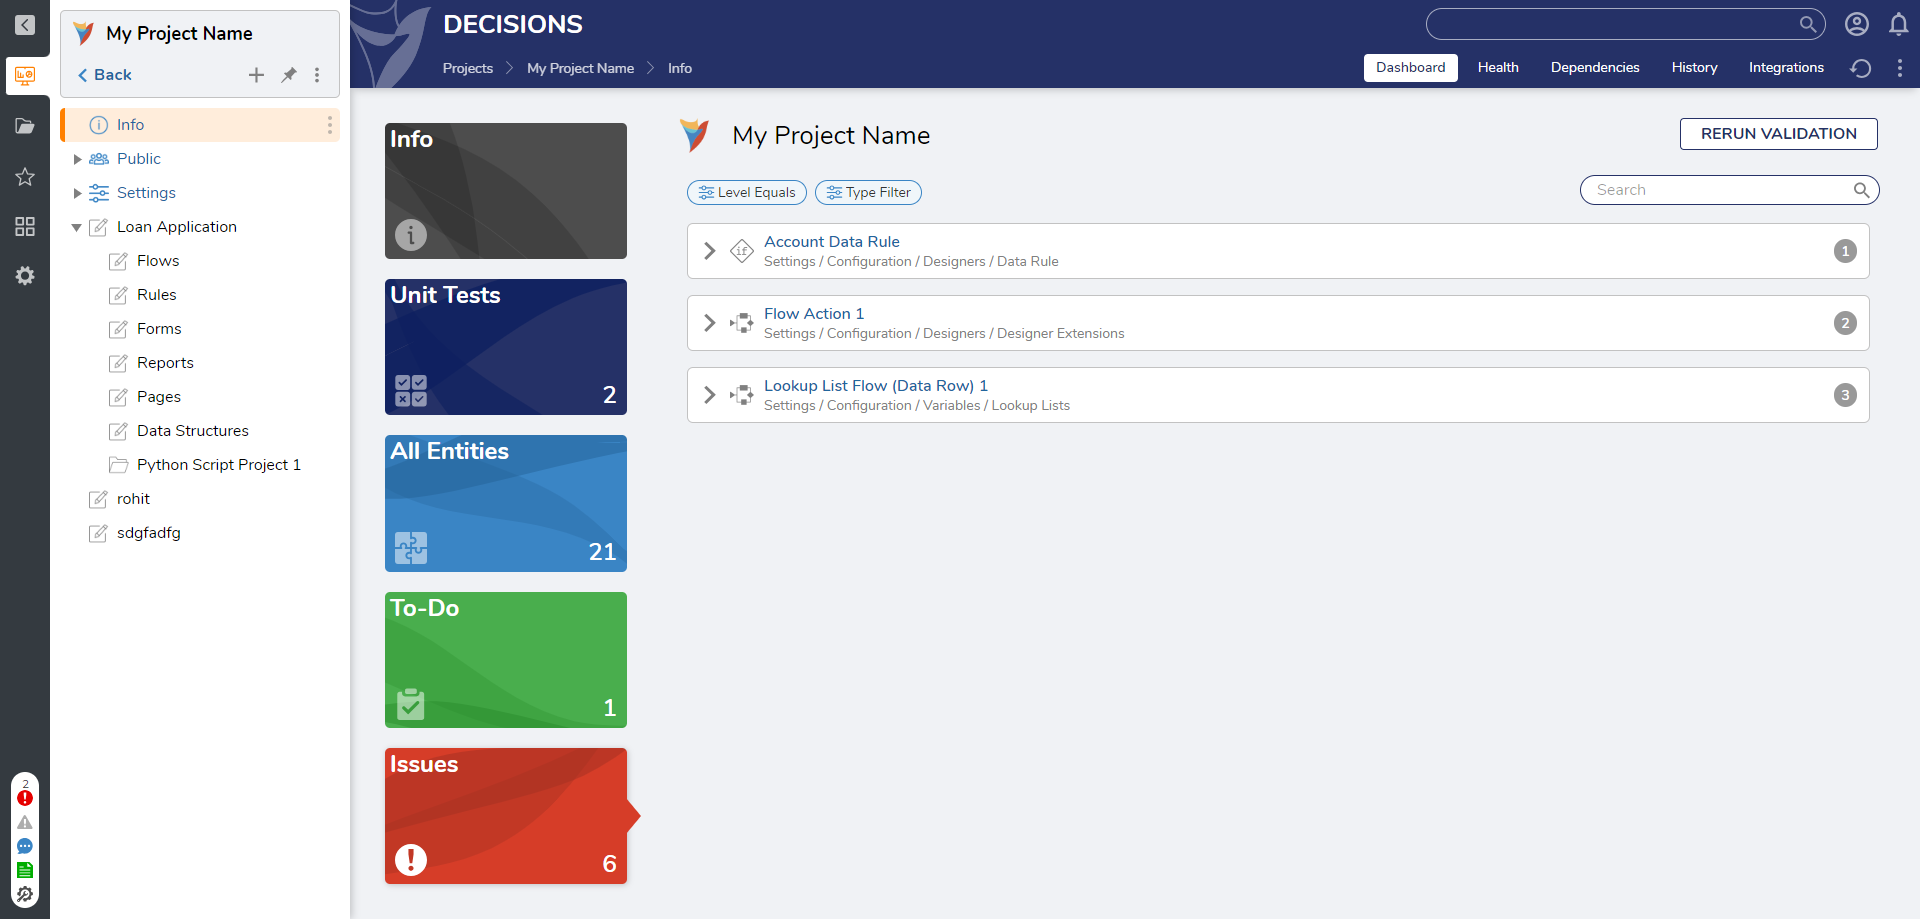 | |
| Health | Project Health is a feature that offers an overall assessment of a Project's condition and the health statuses of its individual elements. It ensures Project efficiency and adherence to best practices, particularly in complex projects with interconnected components. By identifying potential issues and providing a detailed evaluation, Project Health enables proactive maintenance and optimization, enhancing project efficiency and improving outcomes. |  | |
| Dependencies | The Dependencies Dashboard in a Project is a location for managing and configuring Project dependencies, ensuring a streamlined approach to project development and integration. This dashboard also allows new dependencies to be created with Modules and other Projects in an environment. | 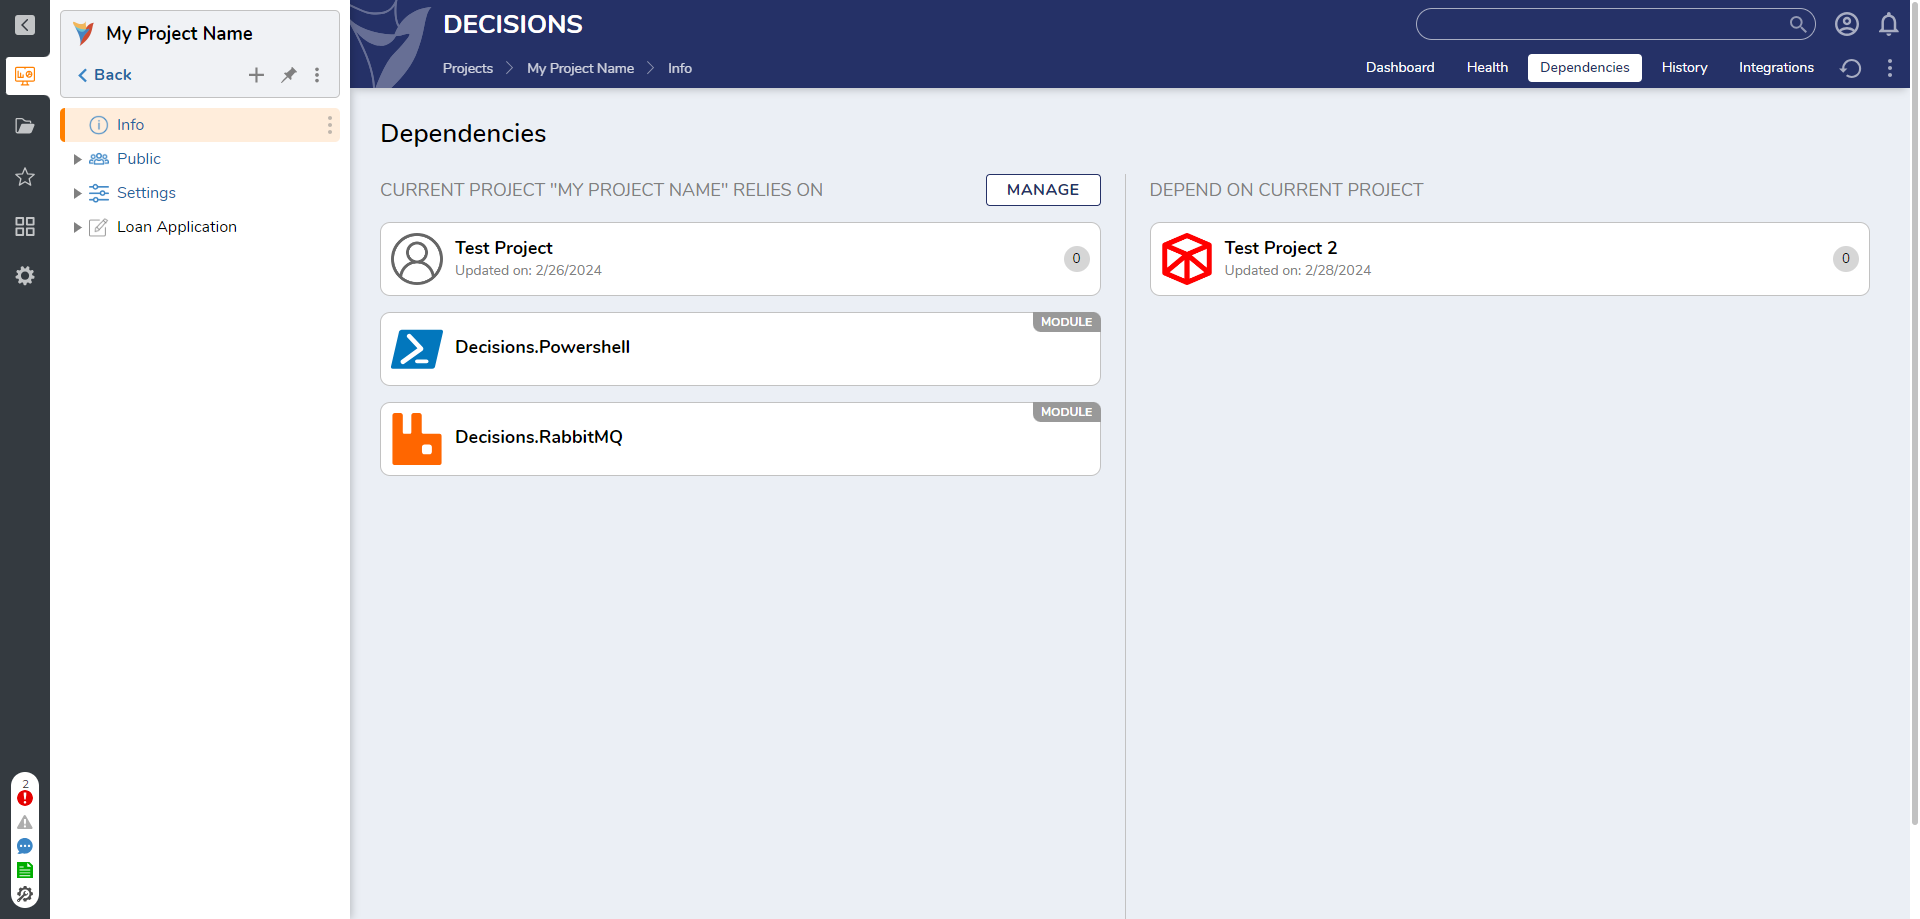 | |
| History | The Project History documents every change made within the Project. The report displays what type of action is performed on what type of entities and by whom. This visibility helps to manage risks and promote accountability by identifying potential issues. Users can filter the history report based on their specific timeline located at the top right corner. | 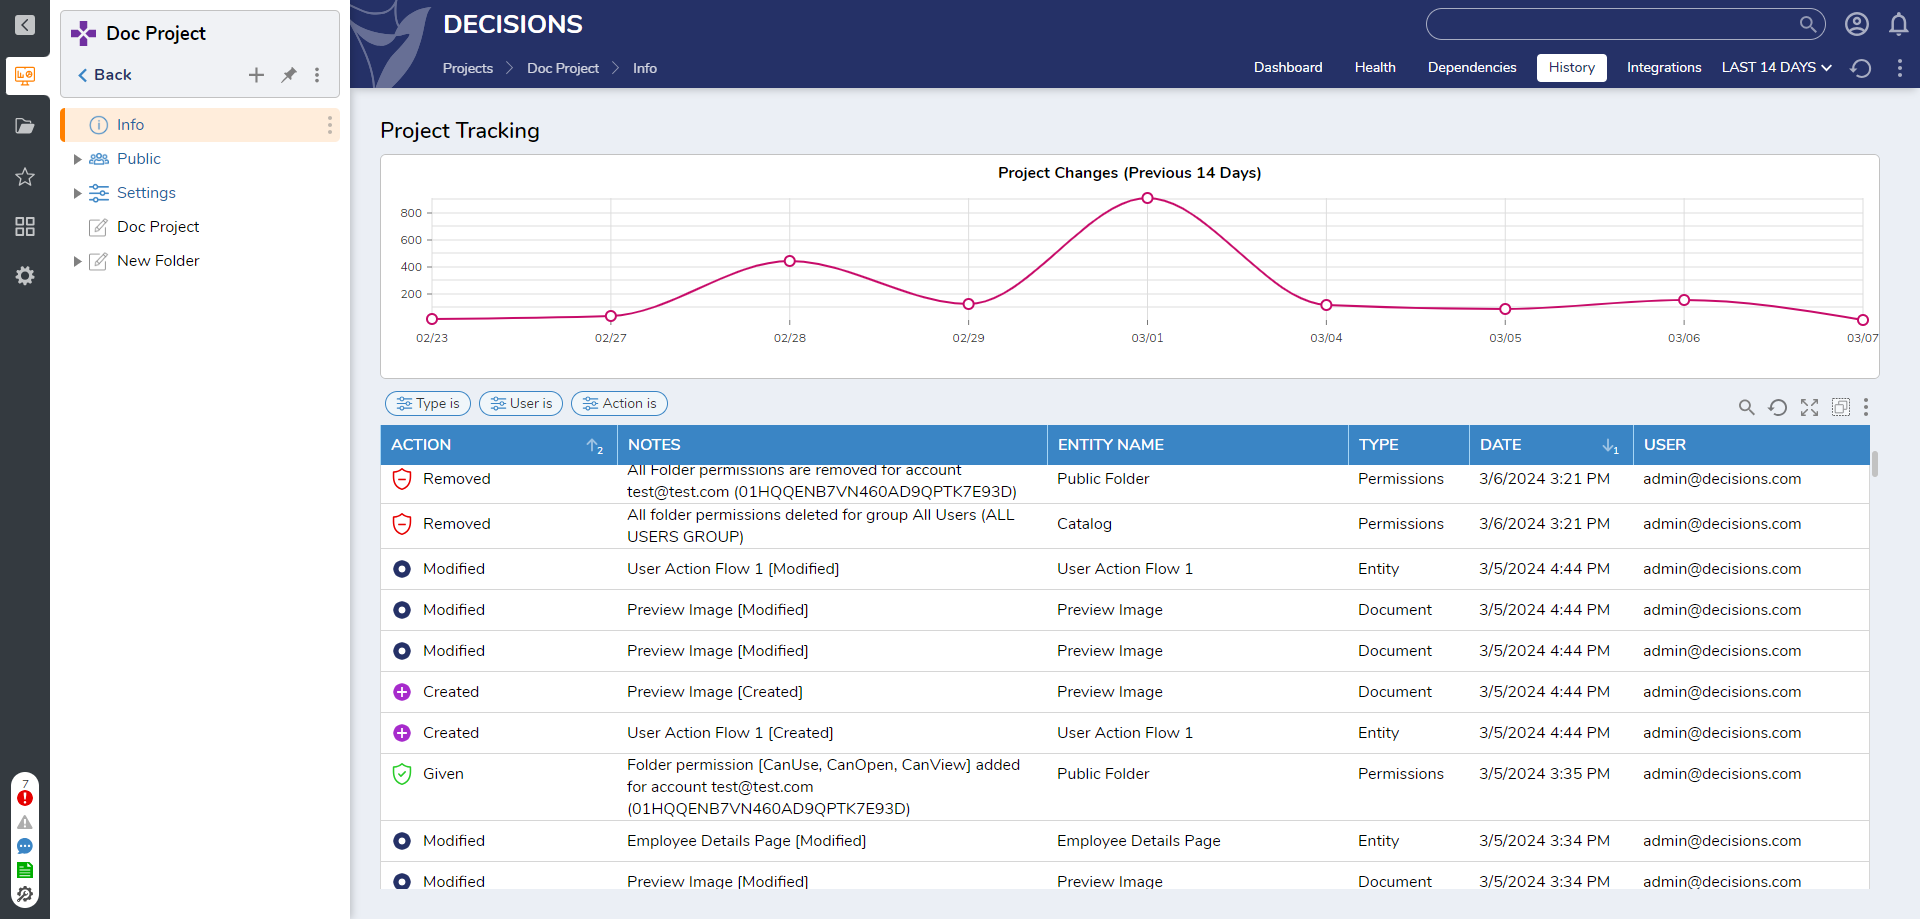 | |
| Integrations | The Integrations Dashboard allows developers to interact with and evaluate various Project integrations. The Integrations dashboard allows users to test APIs directly from the dashboard. This means that users can initiate and evaluate API calls with ease. Additionally, users can download API collections in various file formats, such as Postman, Swagger, and JMeter files. Moreover, the Integrations can be filtered based on the designer type, i.e., Flows and Rules. | 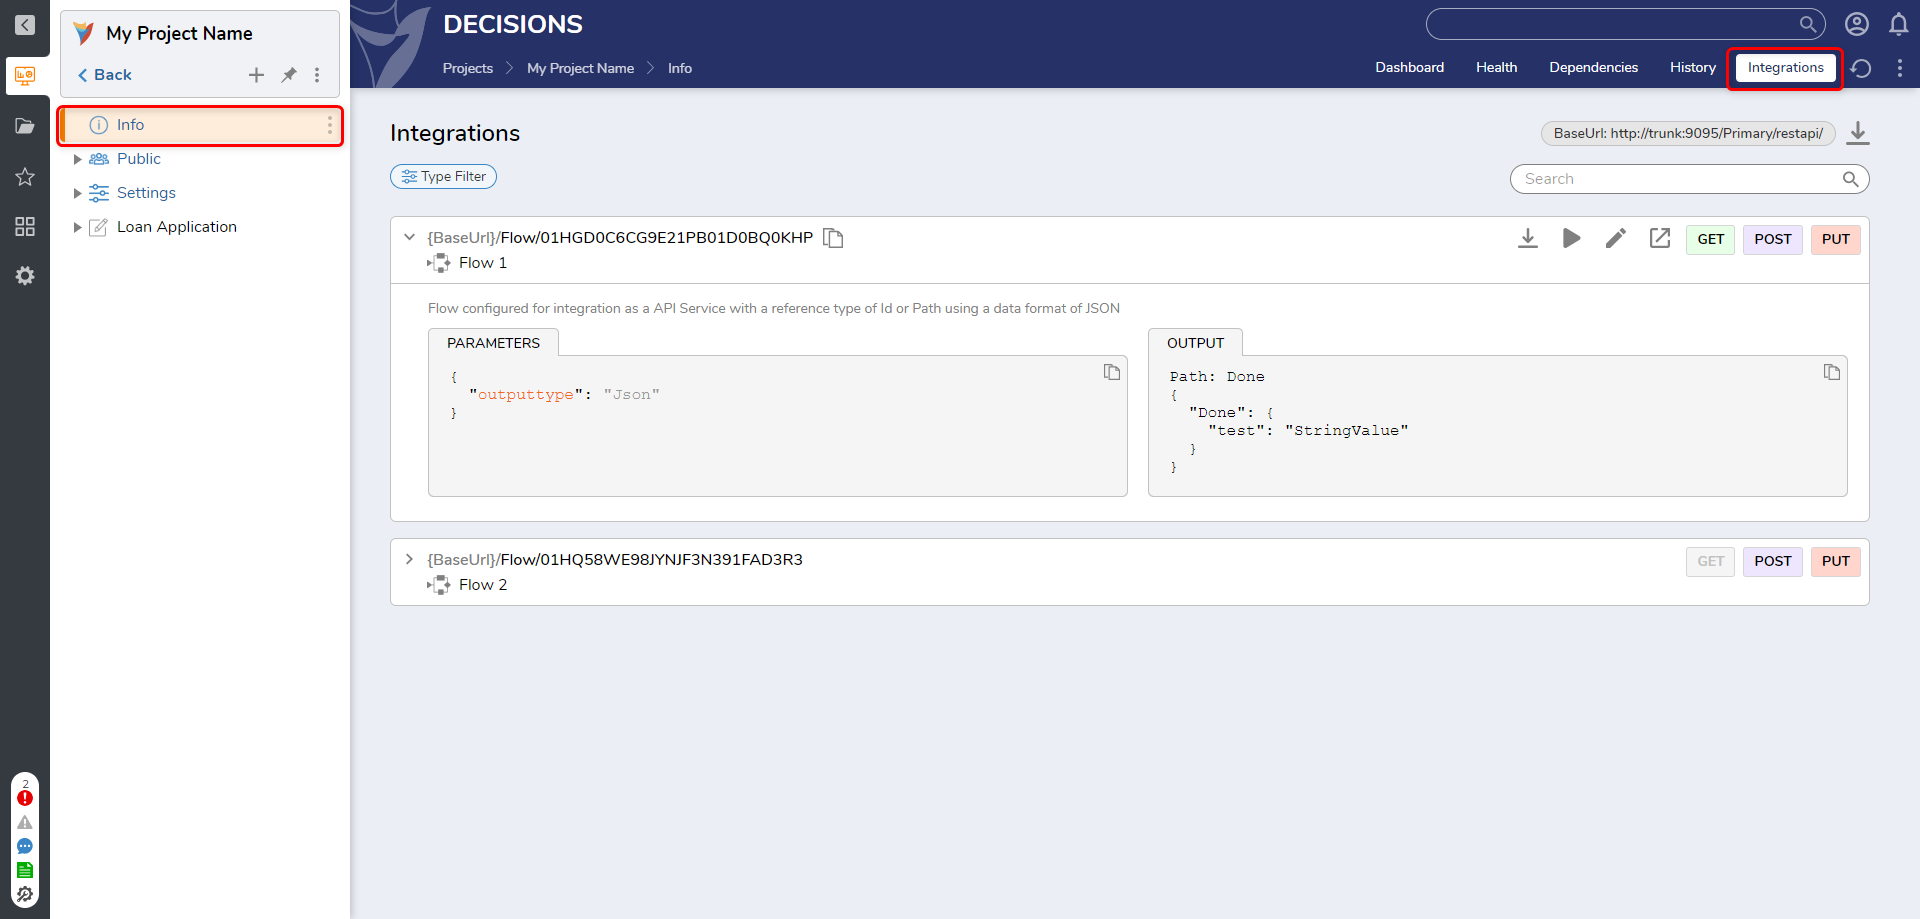 | |
Admin users may customize the Project Info Dashboard by using the default as a base where they can add, remove, and other rearrange features to their preferences.
Note that any changes made to this Page affects all admin users not just the editing account's view.
It is a best practice to save a Checkpoint of the Project Info Dashboard and its Tab Containers in case any changes must be reversed. If anticipating heavy changes to the default Project Info Dashboard, it is also recommended to save a copy and/or save the default as a template.
Example
This example demonstrates how to edit the All Entities report by removing the Modified Date Field. Similarly, any piece of data can be removed and any of the Reports can be adjusted as desired using the same steps. However, certain other elements of the page must be edited in the Open Containing Folder; an example for this case will be provided below.
Editing this Dashboard impacts every Project on an environment. There is no single Project customization of the Info Dashboard at this time.
- To edit the Project Info Dashboard, search for it in the search bar at the top right of the Studio. Select it from the search results and it will automatically open in the Page Designer. Ensure you are not within a Project when attempting to search for the Project Info Dashboard or no results will appear.
- Select the All Entities container, then select the Report Source containing the server and project metric data aka Project Information. In the "Properties" panel, located on the right side of the screen, select "EDIT DEFAULT REPORT".
.gif)
- In the Report Viewer, delete the "Modified Date" Data Field. Save and exit the Report Viewer. Then save and exit the Page Designer.
Reverting System Page Changes
Changes may be undone via the Restore From Backup Action accessible by right-clicking the Project Info Dashboard then navigating to Manage > History/Documentation Actions > Open History > Right click an ENTITY NAME from "Older Versions" list > Main > Restore From Backup.