Overview
There are many ways to track the performance and activity in a user's Decisions experience, and Client Statistics is another useful tool to do so. This feature records data about the volume of different processes running within Decisions. This covers the most important Designer Elements - Forms, Flows, and Rules, but there are additional processes that are observable listed below. Once this feature has been turned on, all of the data is recorded in a database and can be viewed via Reports.
Edit Client Statistics
The below steps go over how to activate Client Statistics. The statistics are split into two categories - Settings and Summary.
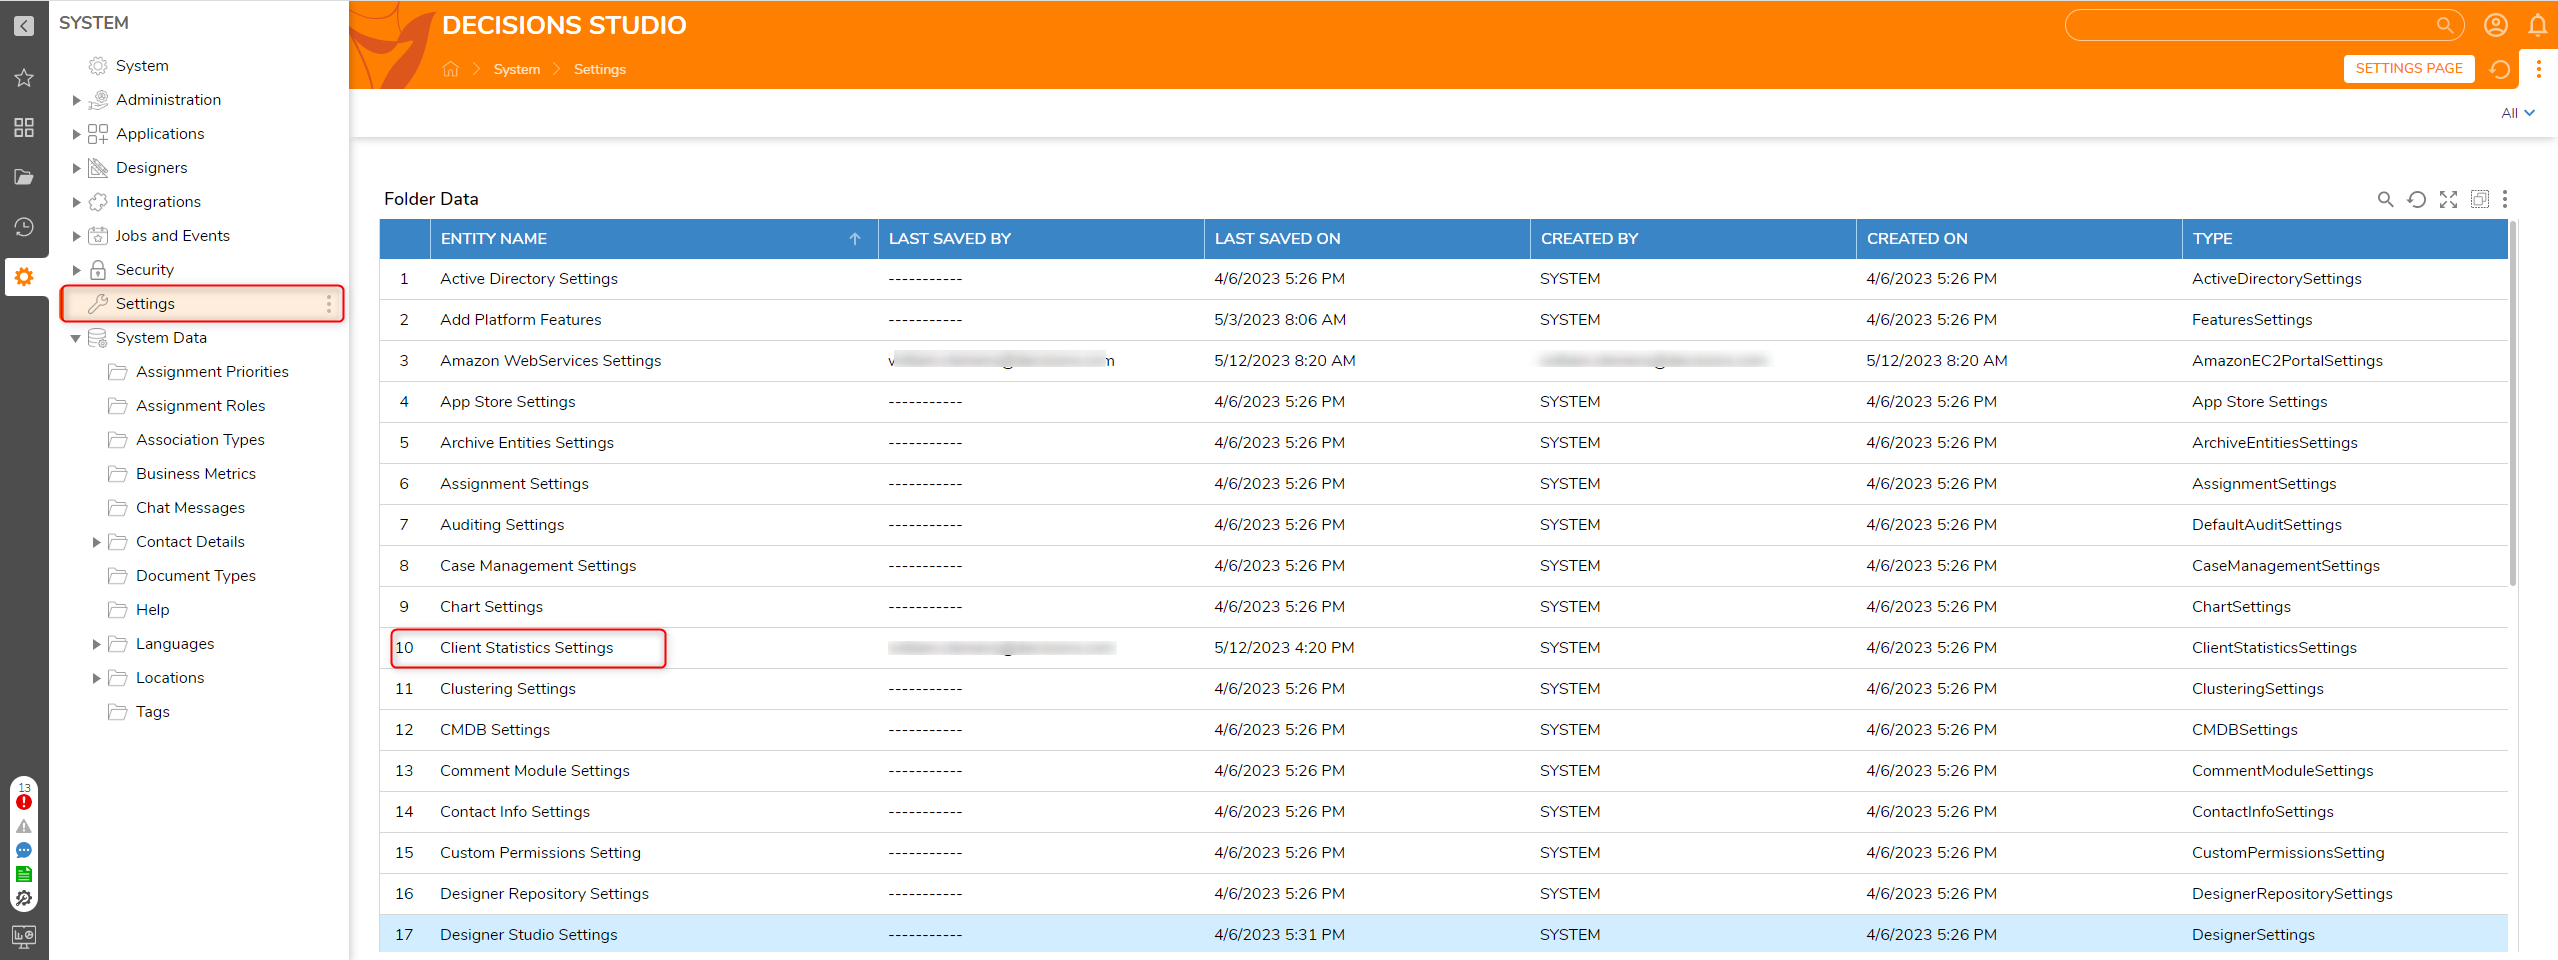
- Navigate to System > Settings and select the Client Statistic Settings.

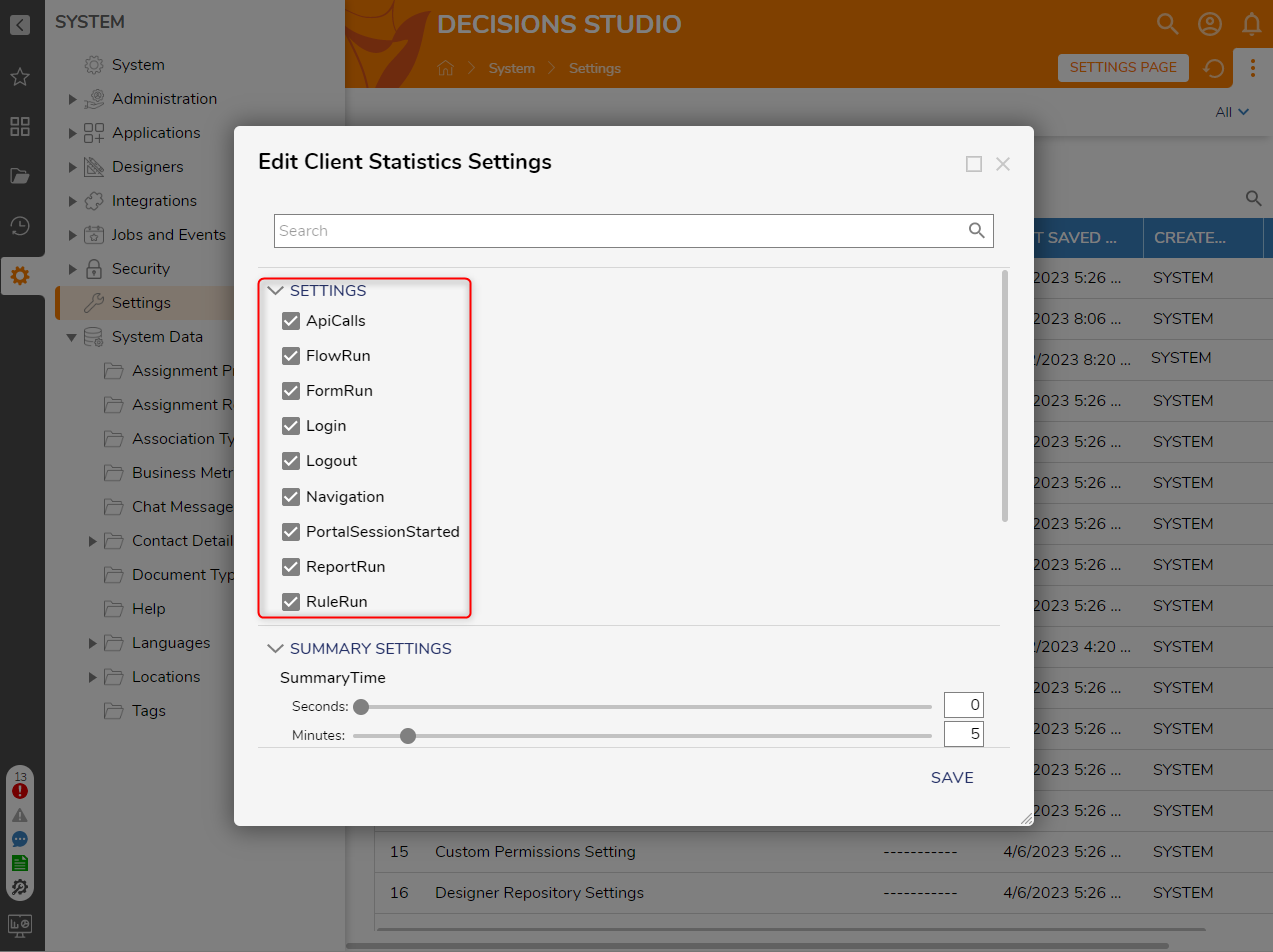
- Check any desired SETTINGS to gather Statistics on them.
| Settings Name | Description | |
|---|---|---|
| ApiCalls | API call |  |
| FlowRun | Instance of a Flow being run | |
| FormRun | Instance of a Form being run | |
| Login | Instance of a Login | |
| Logout | Instance of a Logout | |
| Navigation | ||
| PortalSessionStarted | Instance of a Portal Session | |
| ReportRun | Instance of a Report being run | |
| RuleRun | Instance of a Rule being run |
- Adjust the SUMMARY SETTINGS by clicking the desired summary types and setting the SummaryTime. After the desired settings are defined, click SAVE.
| Summary Name | Description | |
|---|---|---|
| ApiCallsSummary | Total number of API calls made | .png) |
| FlowRunSummary | Total number of Flows run | |
| FormRunSummary | Total number of Form interactions | |
| LoginSummary | Total number of Logins | |
| LogoutSummary | Total number of Logouts | |
| NavigationSummary | ||
| PortalSessionStartedSummary | Total Portal sessions started | |
| ReportRunSummary | Total number of Reports Run | |
| RuleRunSummary | Total number of Rules Run |
Viewing Client Statistics
After the settings have been activated, a user will need to create Reports to view the statistics.
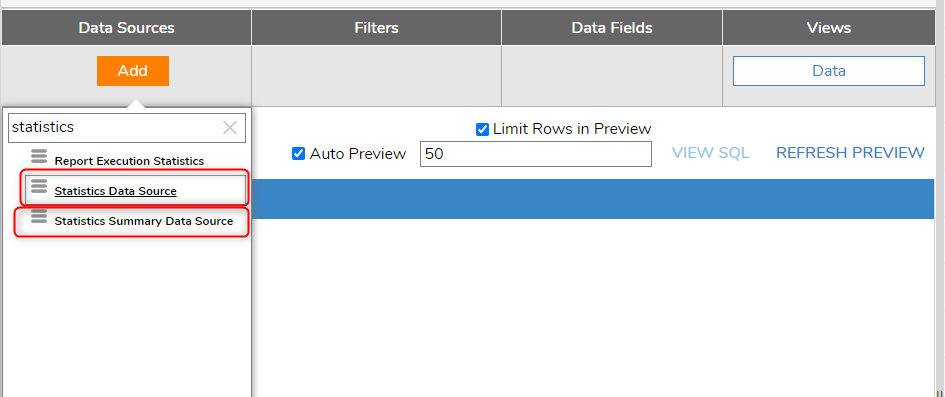
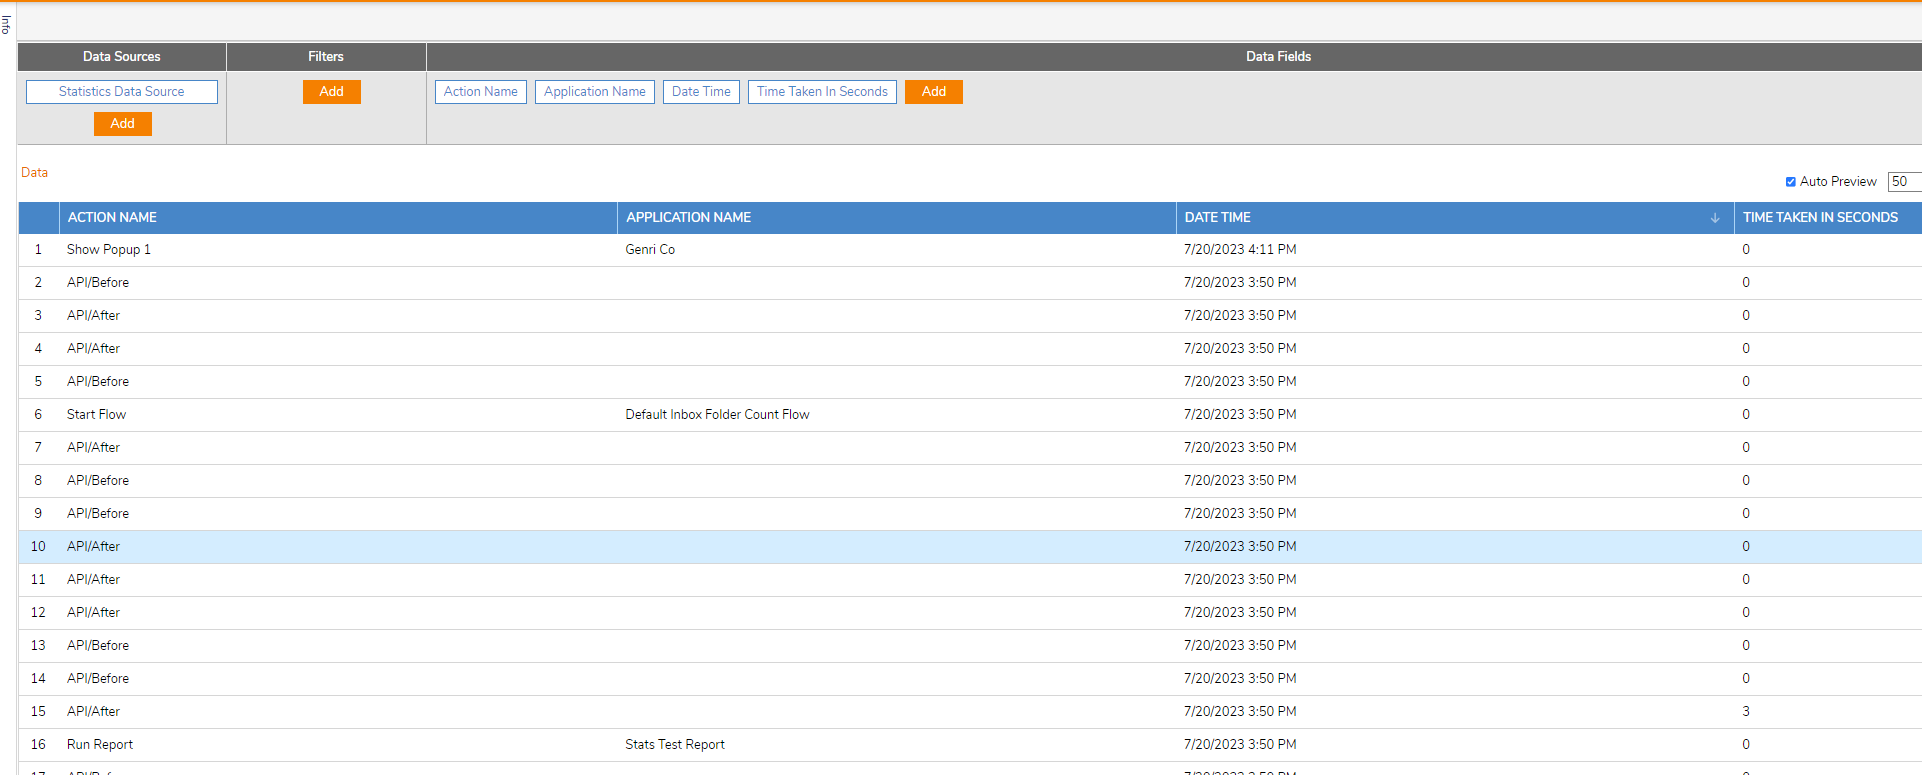
Once a new Report has been created, there are two Data Sources that can be used. Statistics Data Source is used to pull information from the Settings options listed above. Statistics Summary Data Source will provide the overall summary of the actions within a time frame. Adding the Time Taken in Seconds data field to the Report is a great way to determine if Flows are performing as fast as expected.

 Example of a Report using Statistics Data Source.
Troubleshooting
Using Client Statistics can cause database storage issues where too much data is stored and file sizes balloon to unmanageable levels. If this occurs, turn off the Client Statistics options and reboot. This will resolve the issue.
Other Methods Recording Client Statistics
There are four Steps that can be used in Flows to build data for the client_statistics table without turning on Portal Statistics. These Steps can be helpful for users who want targeted information about a particular designer project or have encountered the issue mentioned in the Troubleshooting section.
Step Name | Description |
|---|---|
| Record Statistics | Adds an entry to the client_statistic table. |
| Record Statistics for Current User Step | Adds an entry to the client_statistic table and sets the Account ID and Email address to the current user. |
| Record Statistics With Time For Current User Step | Same as above, but with an input for Time Taken. |
| Record Statistics With Time and Sessions Step | Adds an entry to the client_statistic table but with inputs for SessionID and Time Taken. |