Overview
A flow can run an approval process, check or send an email, handle an incident, or turn on a server, as well as many other things. To learn more about Flows and their capabilities, check out this document.
The purpose of the Debugger is to ensure a flow runs without errors; debugging is highly recommended throughout all development stages. You can view how a flow transforms data using the Flow Debugger, accessed from the Flow Designer.
Because the debugger runs flow with additional processes to display contextual data for developers, the debugger should not be used as a means for gauging a flow’s performance. If you would like to analyze how quickly a flow is performing and which steps may be producing bottlenecks, see our article on Troubleshooting Using the Profiler.
Example
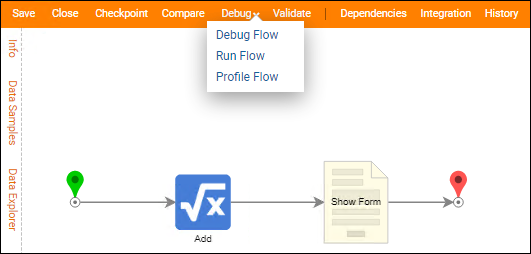
In this example, we will use a project previously created in the Create Your First Flow document. The following flow adds two numbers and then displays the sum in the following form.
To begin the debugging process, select Debug link at the top of the Flow Designer.
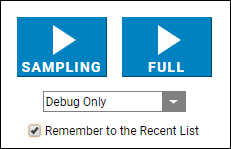
When the Debugger opens, there are a few new options available in Version 6.0 and higher.
- Sampling: A sample size of a full run. For example, while debugging a flow that fetches an abundance of data, a Sampling will run 10 instead of 1000. (Recommended)
- Full: Runs full flow
- Debug only: Only runs the debugger
- Debug and Profile: Debugger includes the Profile Page.
- Profile Only: Runs the Profiler in the background
The checkbox for Remember to the Recent List is selected by default. This will save the current run to replay or save.
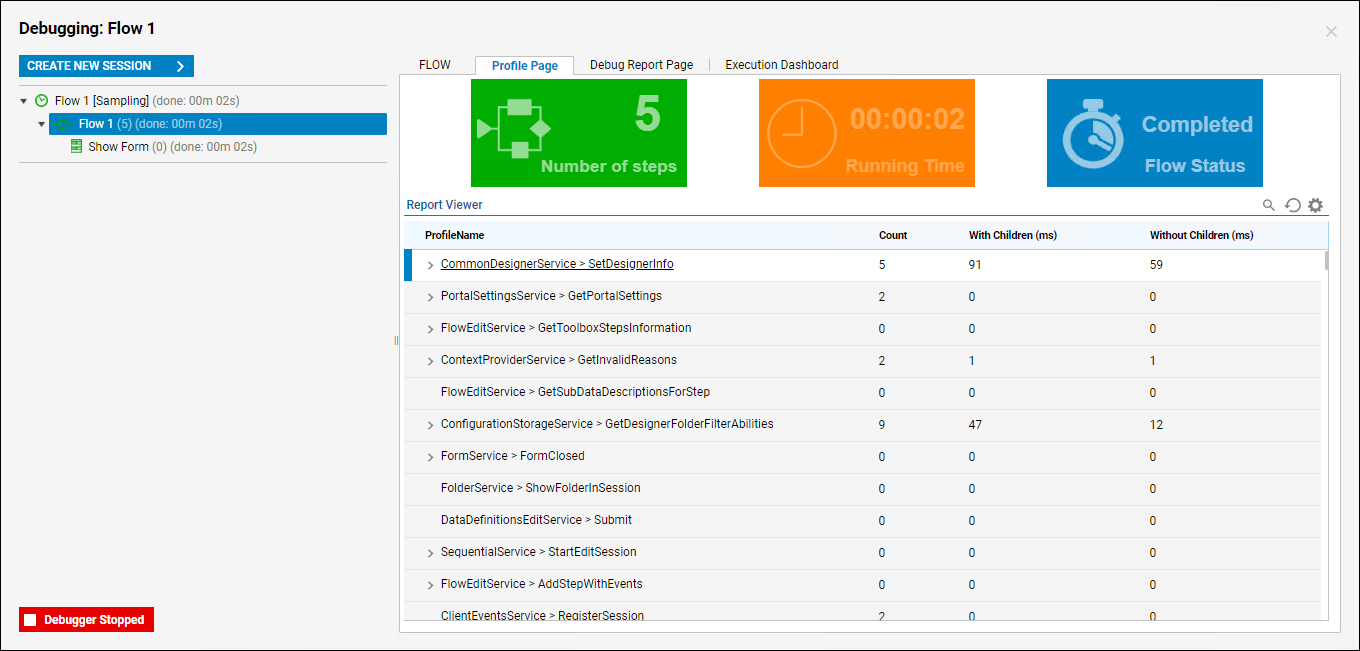
Inside the Flow Debugger, there are 4 tabs, if you chose the Profile option as well, that can be used for debugging; FLOW, Profile Page, Debug Report Page, and an Execution Dashboard.
Flow
Clicking on various steps within the flow gives you the ability to view that particular step's input data, output data, and step info.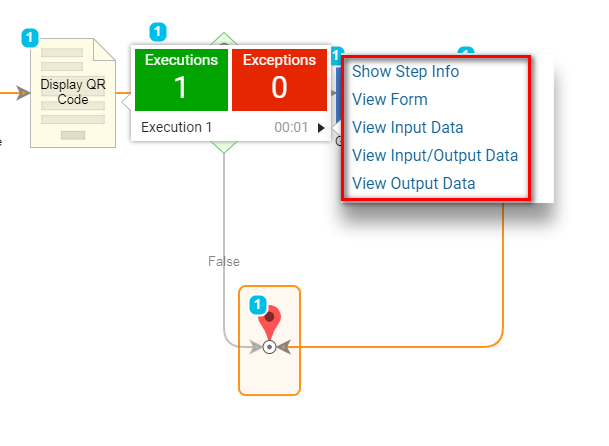
Selecting the play button on the bottom right of the page allows you to see the flow run in real time. 
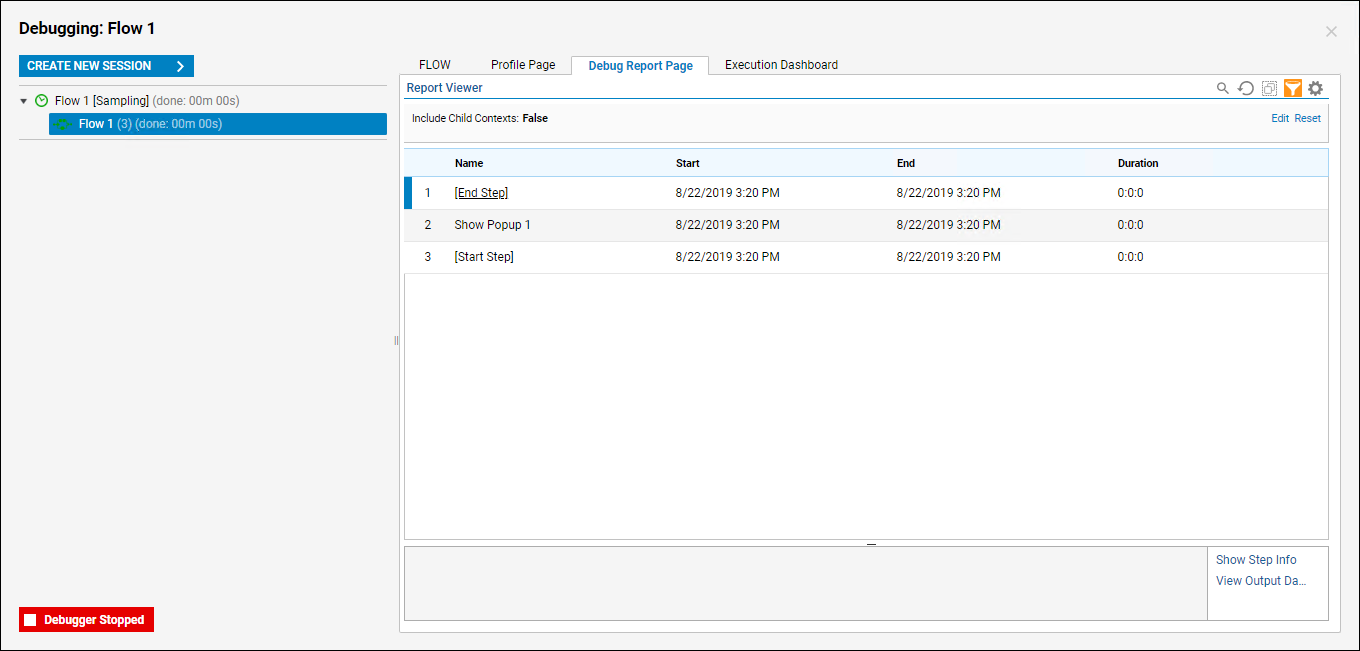
Debug Report Page
The Debug Report Page provides a simpler and cleaner report of the steps within this flow. The difference between the Step Executions Page and the Debug Report Page is that a user does not have the option to change report types.
The Execution Dashboard
The Execution Dashboard provides a user with a snapshot of the executed flow.
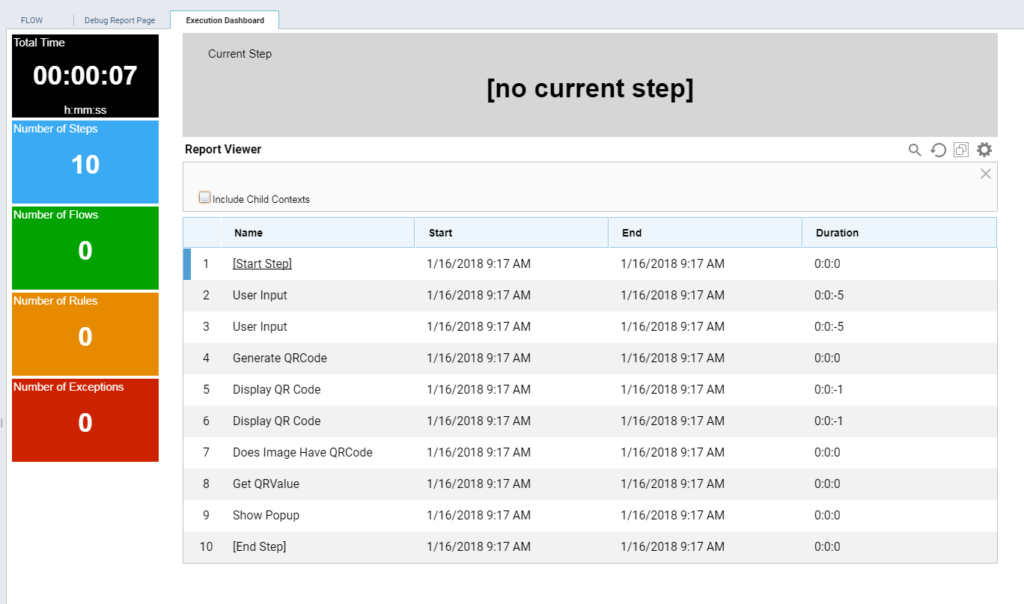
The tiles on the left-hand side provide key information like total execution time, number of steps, number of flows, number of rules, and exceptions. You also have the ability to view different types of reports on this dashboard by clicking the Change Report link.
Remember to the Recent List
Setting this checkbox to true will save the current run in the debugger in the Data Samples back in the Flow designer.
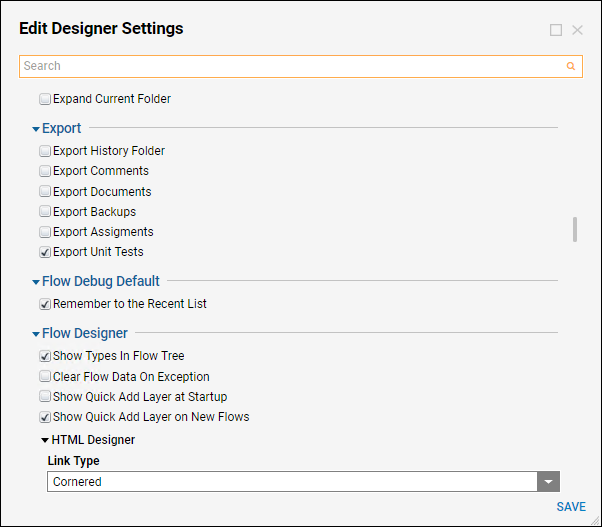
This default option can be turned off and on in System > Settings > Designer Studio Settings, under Flow Debug Default.
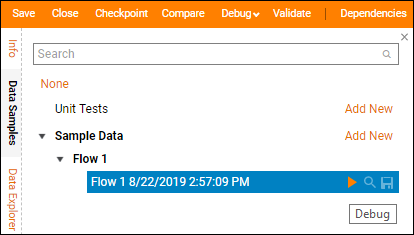
After the debugger runs and Remember to the Recent List was set to true, the run will be saved in the Data Samples panel in the Designer. Under Sample Data > [Flow Name] there will be the saved version of the previously run debugger.
Each time the debugger is run and this option is on it will save a new Sample Data. These pieces of data can be debugged again, the magnifying glass will show what input was used for that run, and the save icon will allow you to save that run as a Unit Test or Data Sample.
