Overview
The Decisions Profiler is designed to help the Designer find problems in their Flows. The Profiler writes out and captures data on all step executions and the count of Executions/Objects and the Time they took to complete the action. This information can be used by Administrative accounts to see which parts of a system or process can be better optimized. An Admin can see which processes are running as expected, which are running slower, which ones are idle, etc.
This document is an introduction to using the Profiler to determine such issues and how to access and use the Profiler from multiple points within Decisions.
Users may access a Profiler Session in a few ways; via the System folder, by profiling a specific Flow, or through the Debugger on a Flow.
Actions were changed in v9.5, older versions will be different from the screenshots below.
System Tools
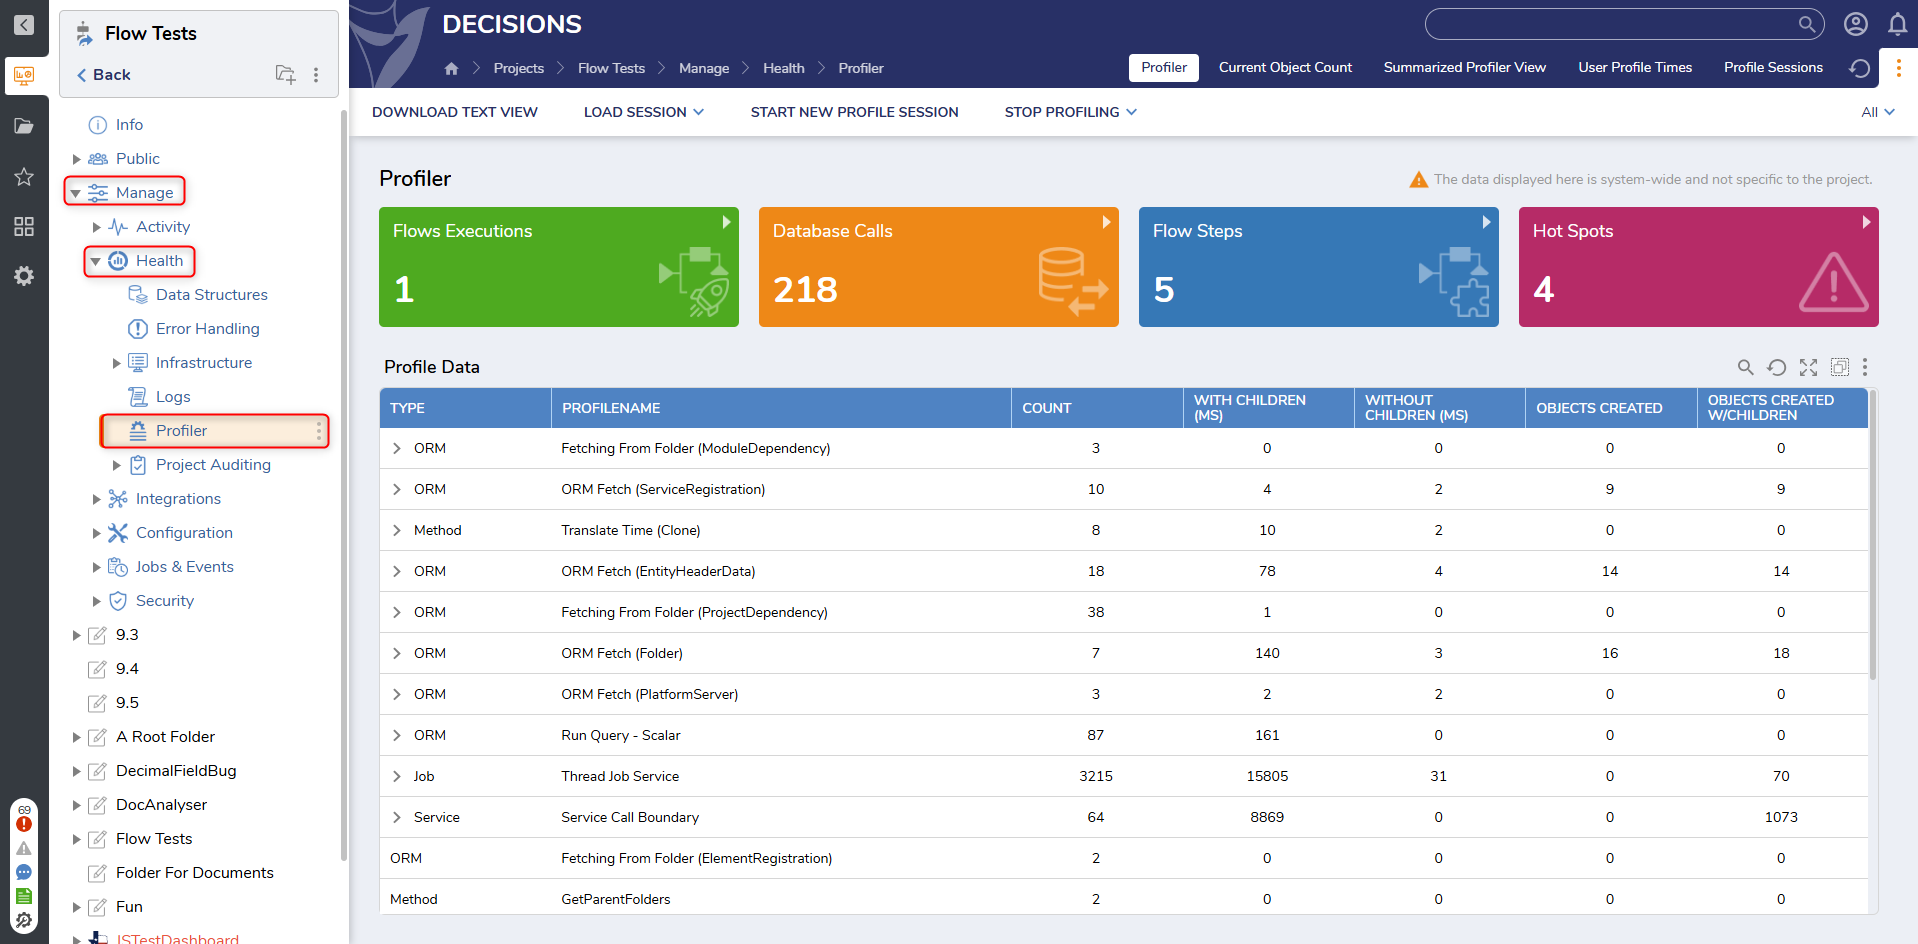
To access the Profiler, navigate to the desired Project > Manage > Health > Profiler.
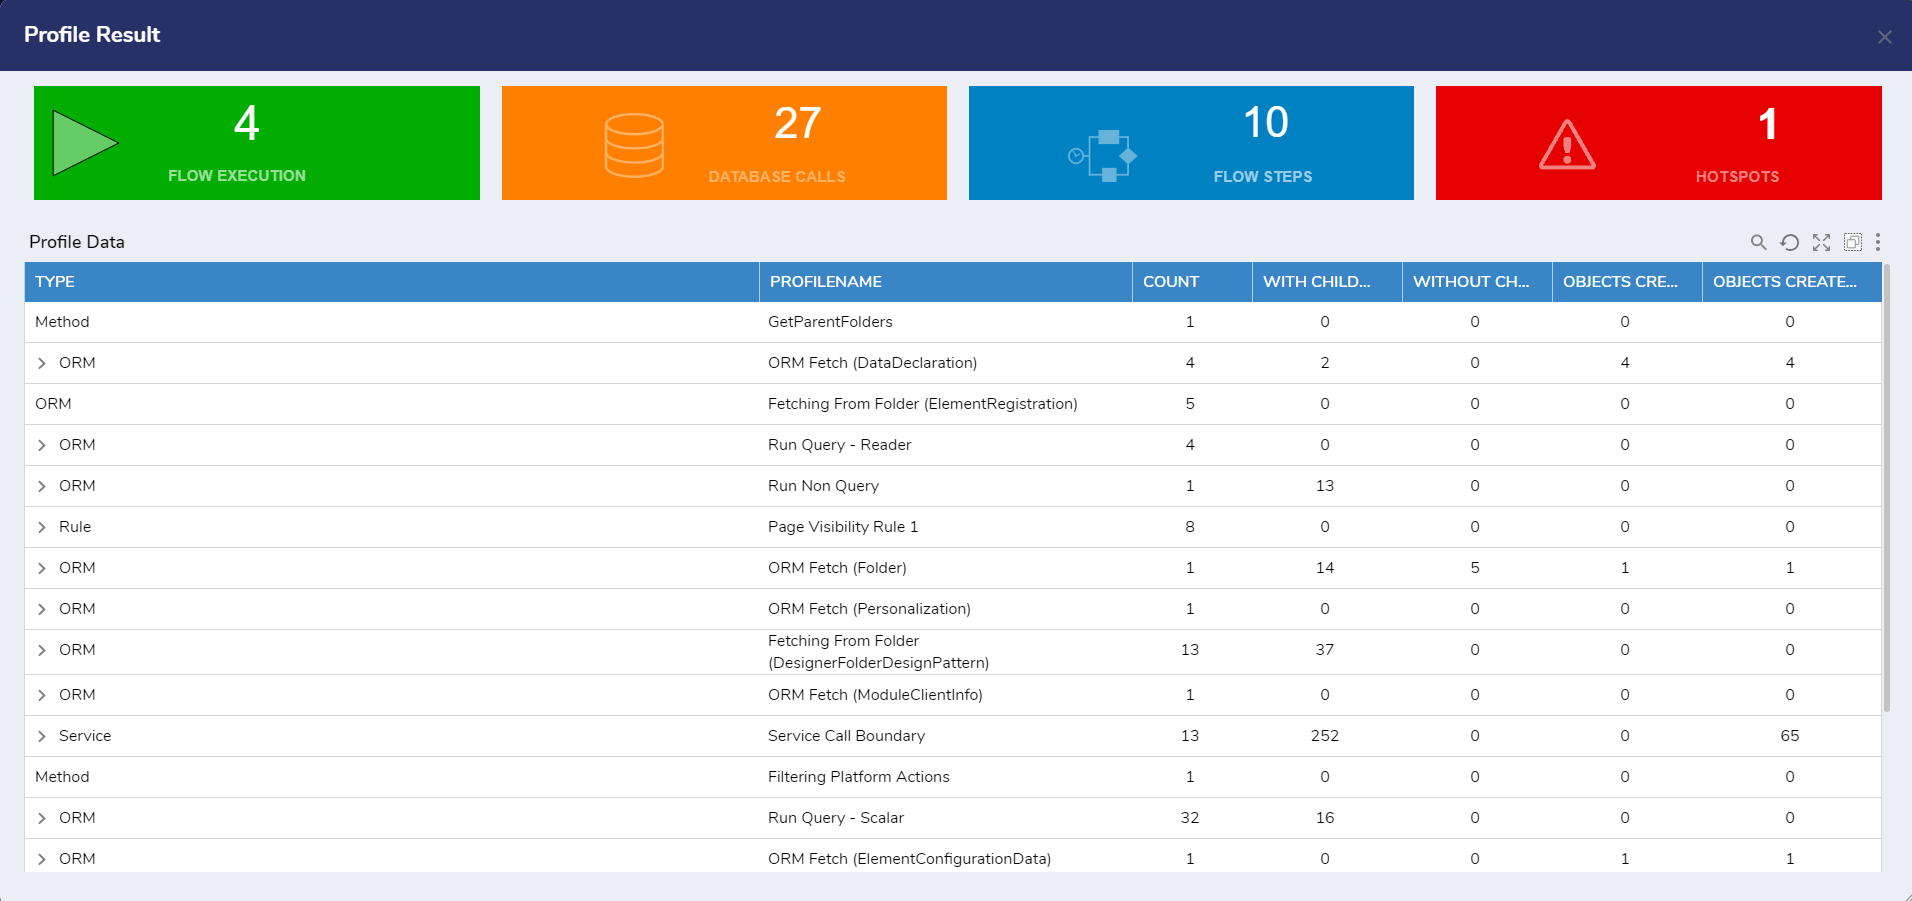
Four tiles on the Profile View Dashboard: Flow Execution, Database Calls, Flow Steps, and Hotspots.
- Flow Execution: Number of Flows executed.
- Database Calls: Total number of calls made to a Database
- Flow Steps: Total number of Steps executed.
- Hotspots: Shows the number of items for which MilliSecondsWithoutChildren is greater than 1000.
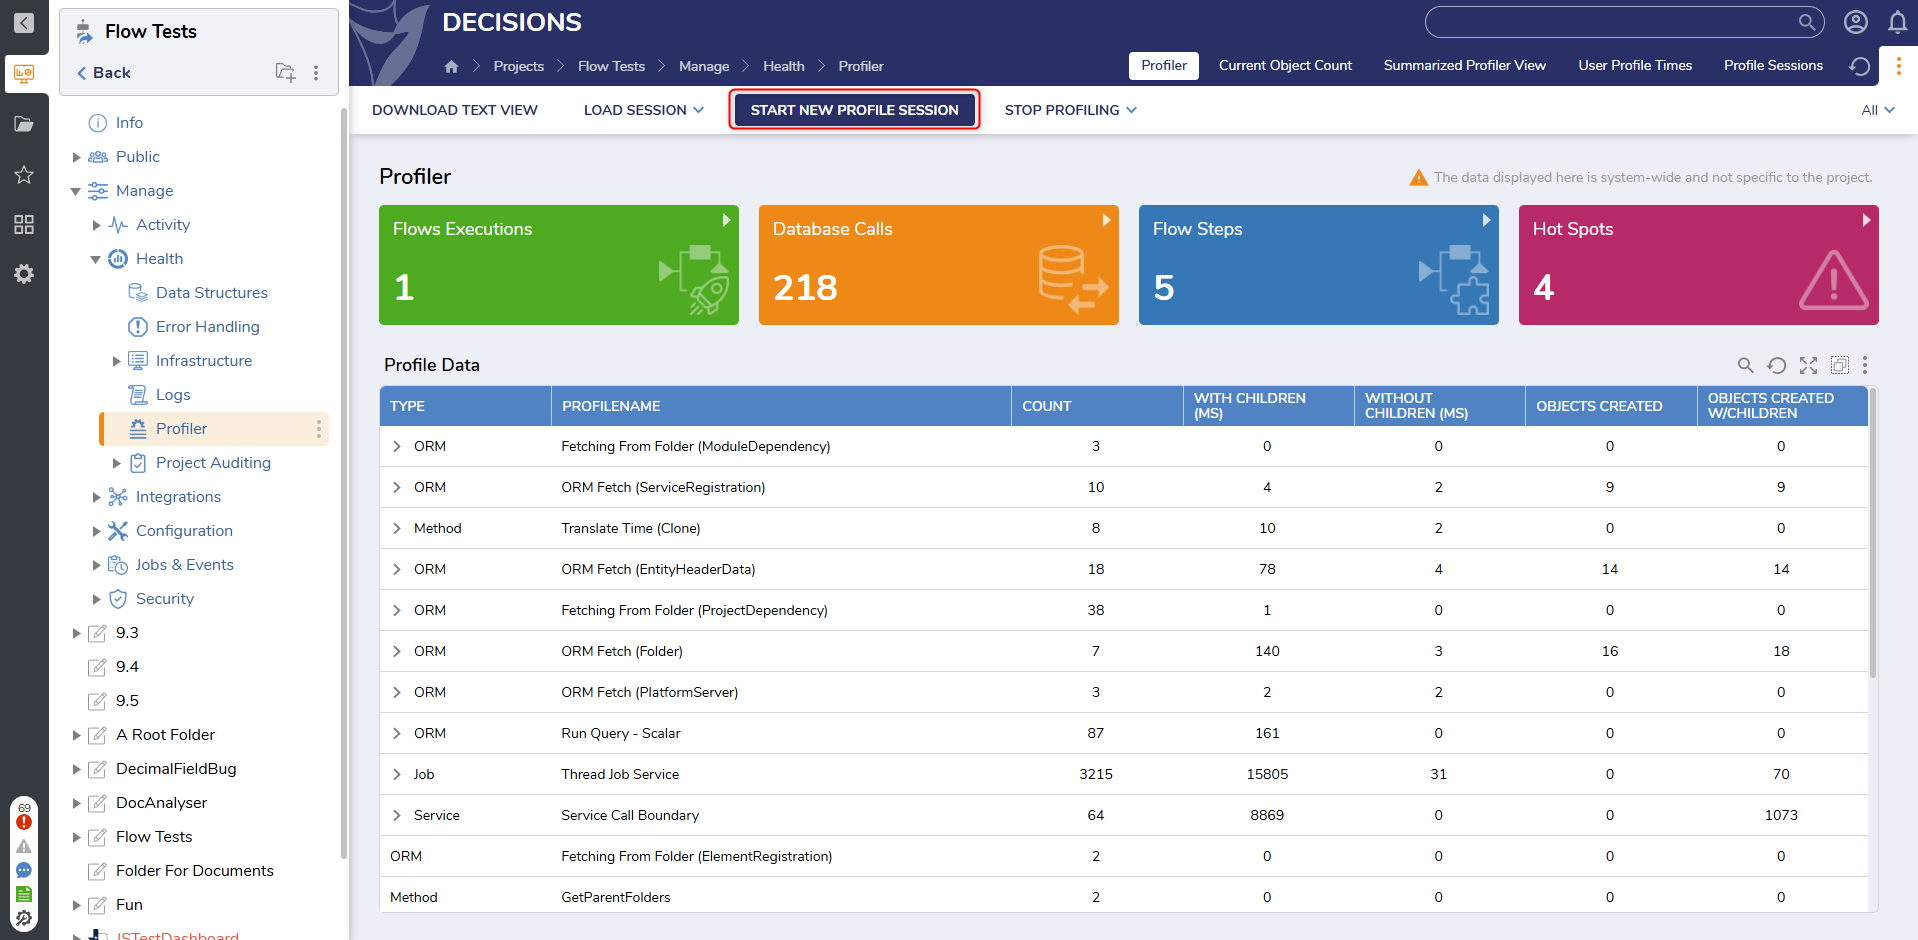
Start new Profiling Session
- Select the START NEW PROFILING SESSION button from the top Action bar of the Profiler.
- The Profile Data window will appear with the following configurations; Profile Name, Summarize Profile Events Less Than (ms), Only Profile Top Level Service Methods, and Save Current.
- Profile Name: The name given to identify this Profile Session for viewing later.
- Summarize Profile Events Less Than (ms): A parameter that summarizes Profile Events if they are recorded in less time than the defined number. For example, the details will be summarized if a Profile Event is recorded in less than 5 milliseconds. Summarized Profile Events are also viewable via the PROFILE VIEW (SUMMARIZED) tab.
- Only Profile Top Level Service Methods: This setting excludes web service calls in child processes.
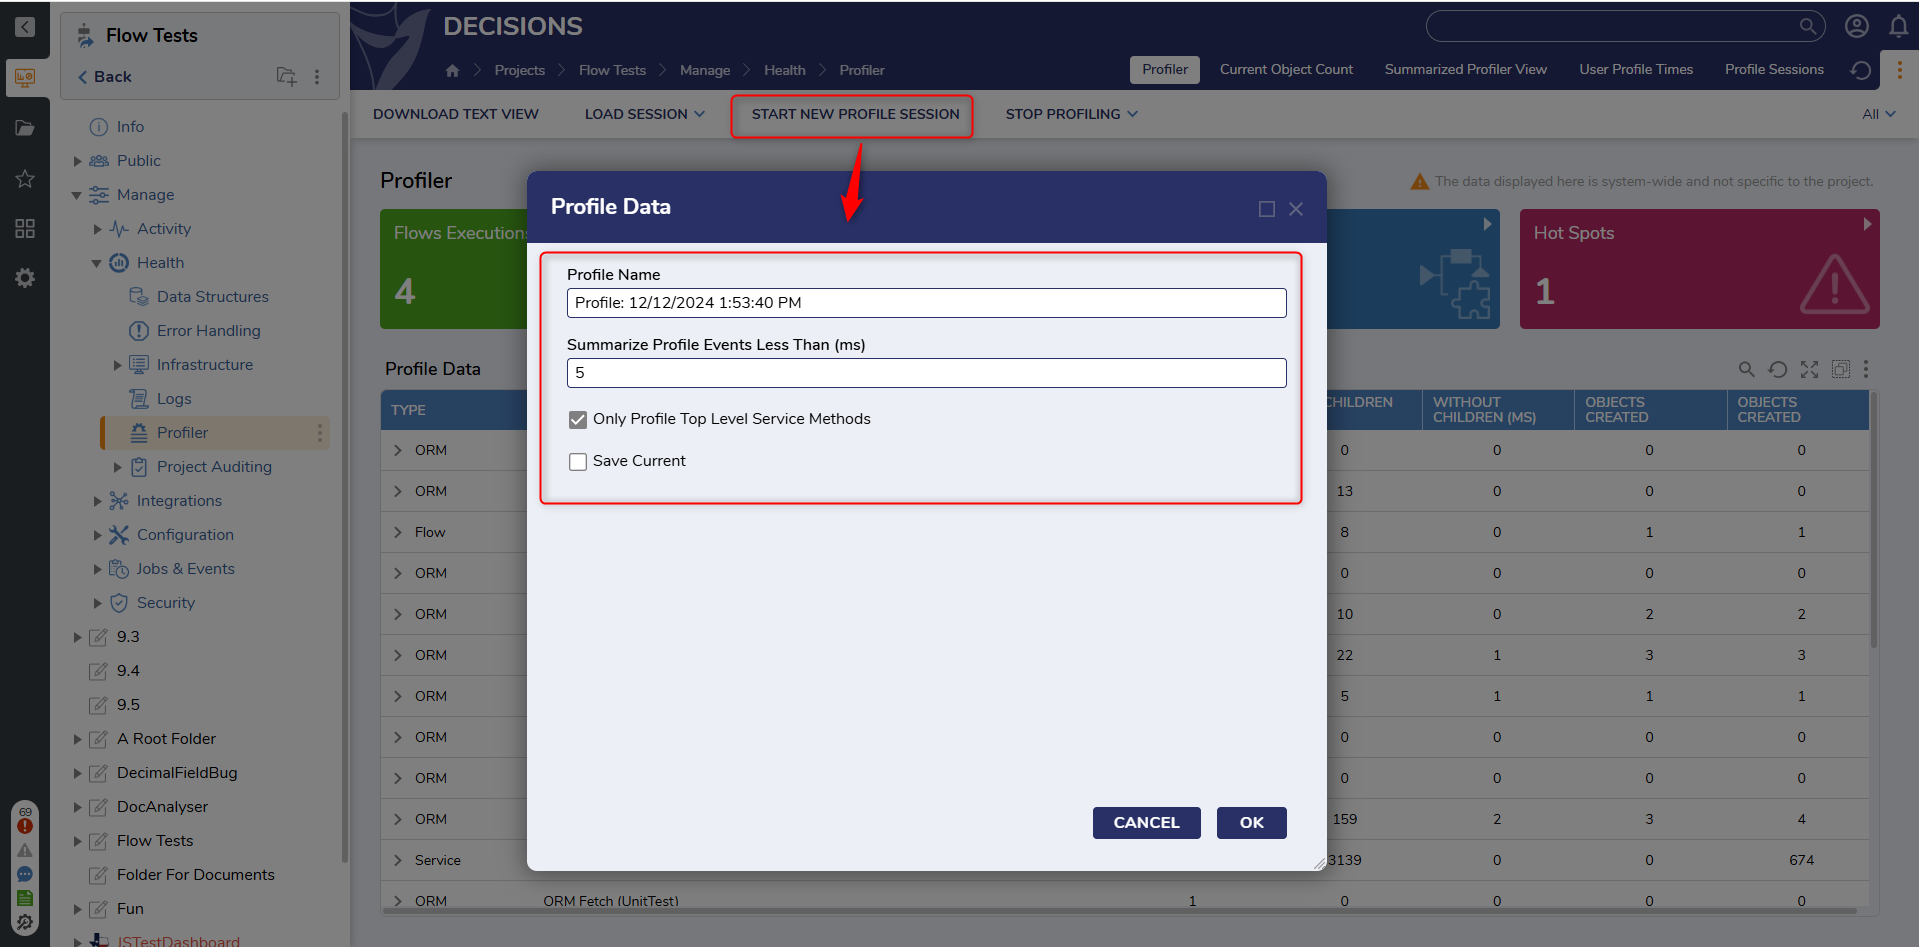
- Upon clicking OK, the Profile Session resets and begins running. While the Profiler is running, clicking the STOP PROFILING button in the top Action Bar provides options to stop the Profile and either Save Profile Data First or stop Without Saving. Selecting the Without Saving option under STOP PROFILING will NOT record Profile Data.
Profile Actions
- Right-click a Profile Session and users gain access to actions.
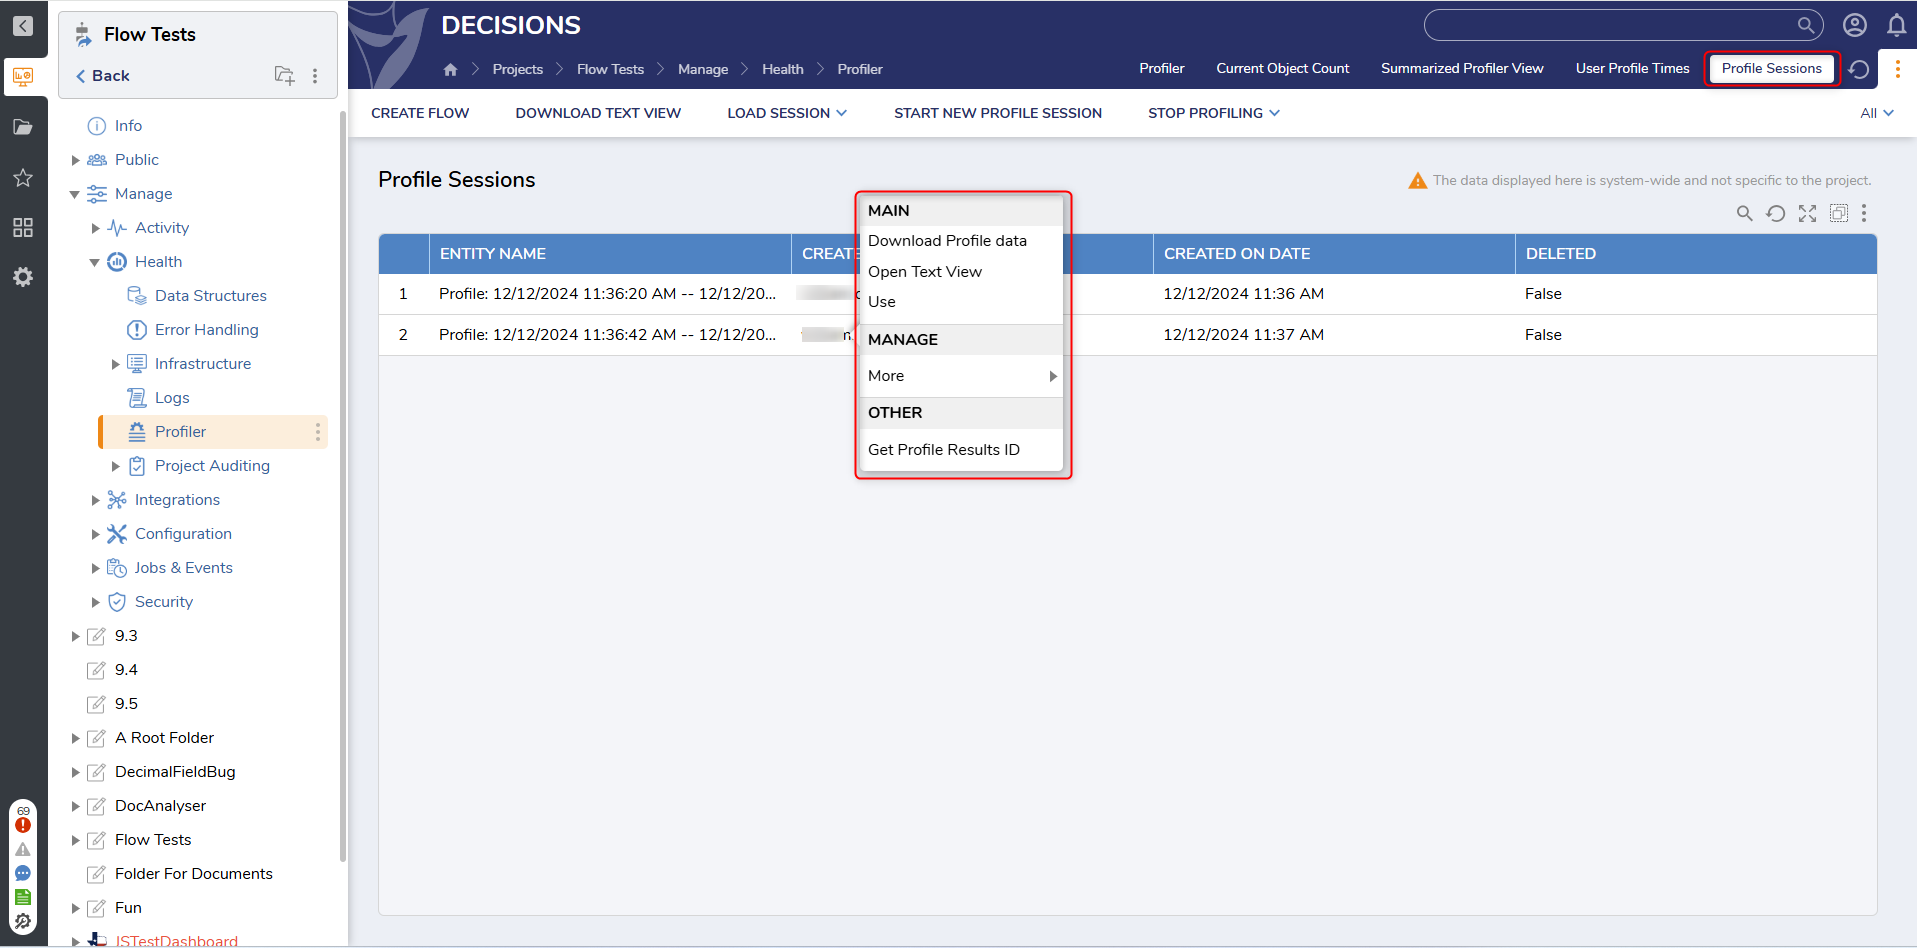
Open Text View
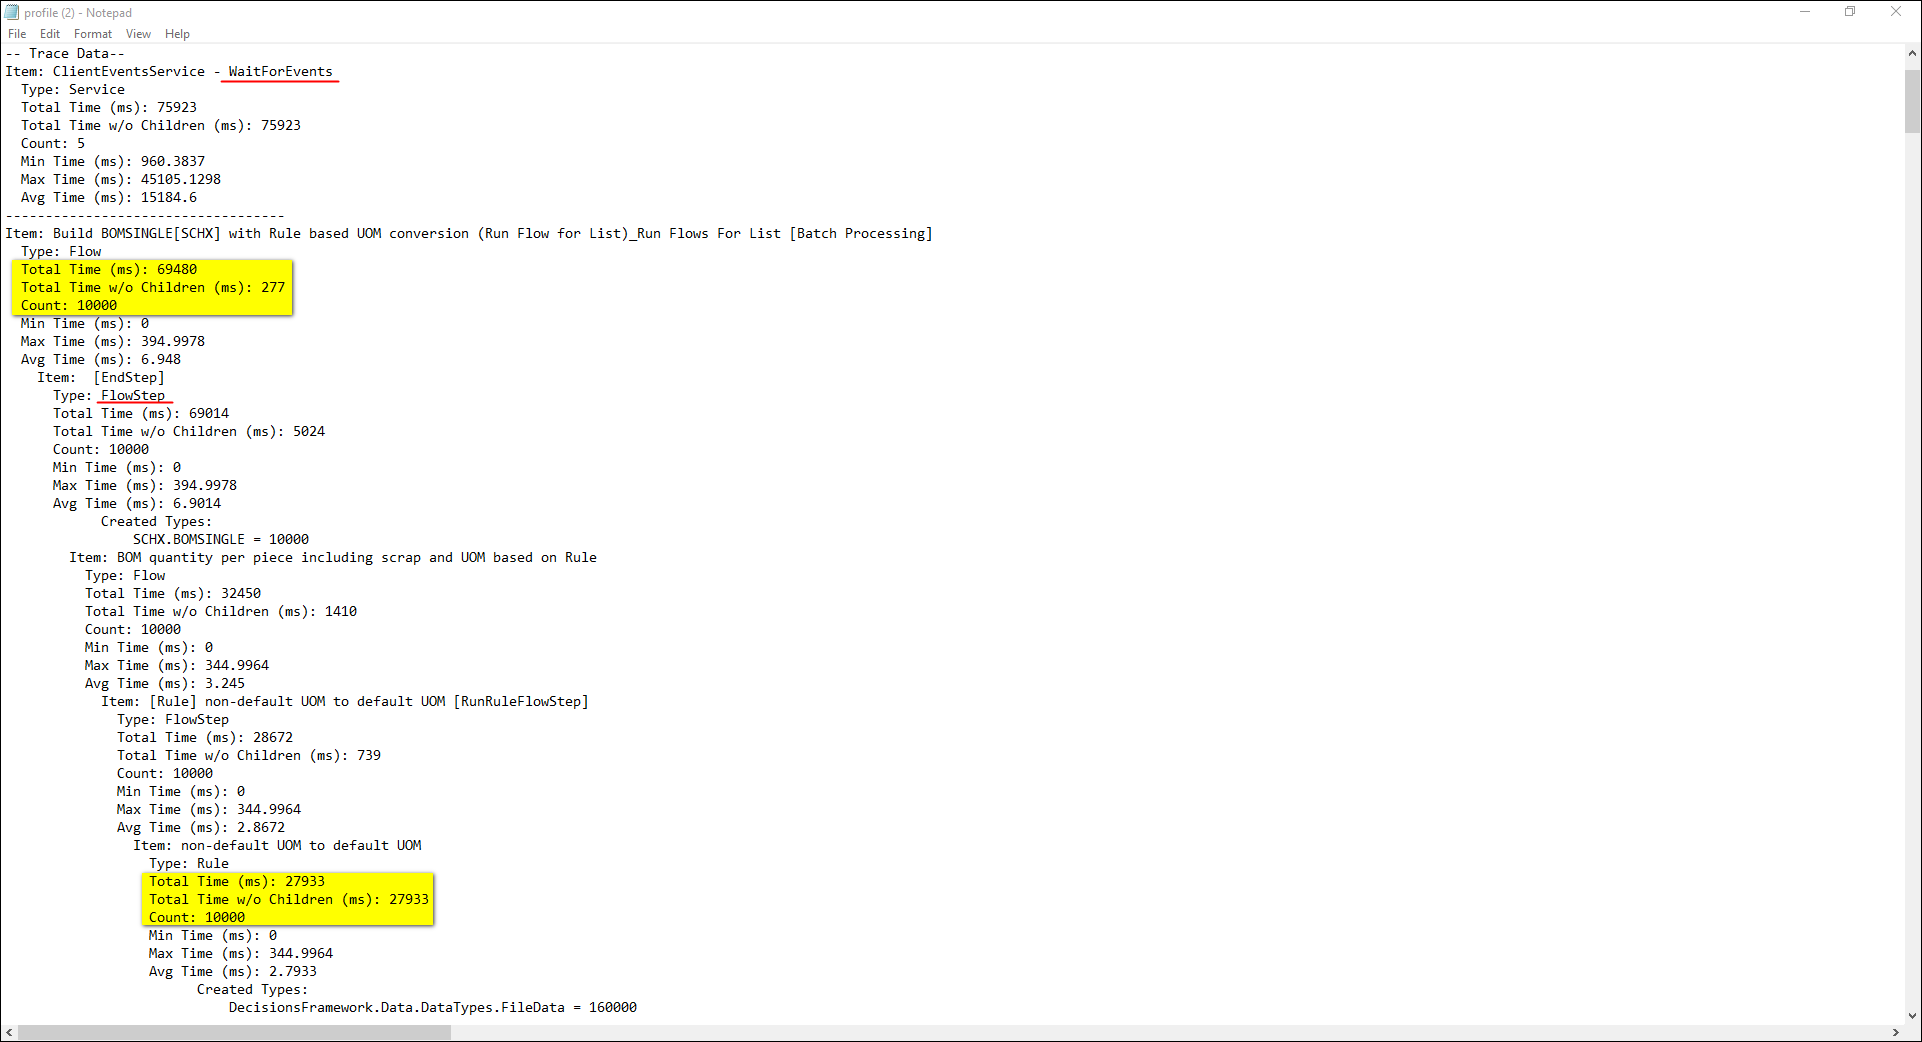
Open Text View downloads a Text file that lists out all of the Profile Data. For this example text file, a Flow is called with a Rule that will run inside the Flow.
Each nesting has an Item, Type, Total Time, Total Time w/o Children, Count, Min time, Max Time, and Avg Time.
In this example Text file, the Flow that was called has a Total Time of 69480 ms, and the Total Time w/o Children is 277 ms; the gap in these two numbers is what needs to be evaluated. To find what is taking the longest, look for the Item that Total Time and Total Time w/o Children have close together or equal. The Count reflects how many times the Item ran.
Skimming down further in this text file, notice a Rule has a Total Time that is 27933 ms, and the Total Time w/o Children is also 27933 ms. In this example, this Rule is why the Flow is running slow.
Profile Data
Profile Data downloads a file (profile.xml) that can be loaded into the Decisions Profiler to be viewed. This is a good option for sharing Profile Data with Decisions support. This is the same data as the .txt file from the Open Text View, just in the .xml format.
Use
Use loads the Profile Data into the Profile Report View tab.
The report only shows the top-level items. To view the data for the children's items, click on a top-level item and select Show Children from the Action Menu.
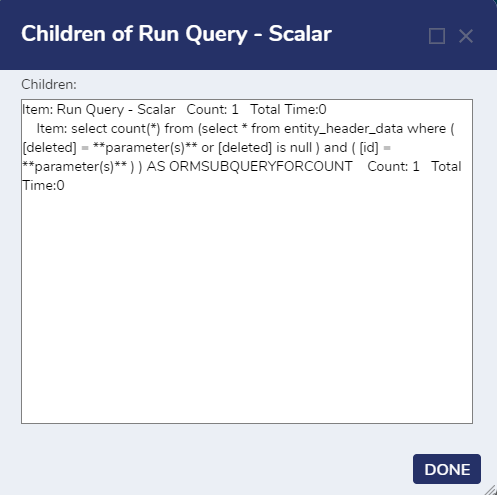
Show Children
Show Children opens the Children in a simple text view box as shown below. When looking through the Profile Data, look for either unexpectedly large Counts or Time values, as they likely pinpoint the problematic parts of a workflow.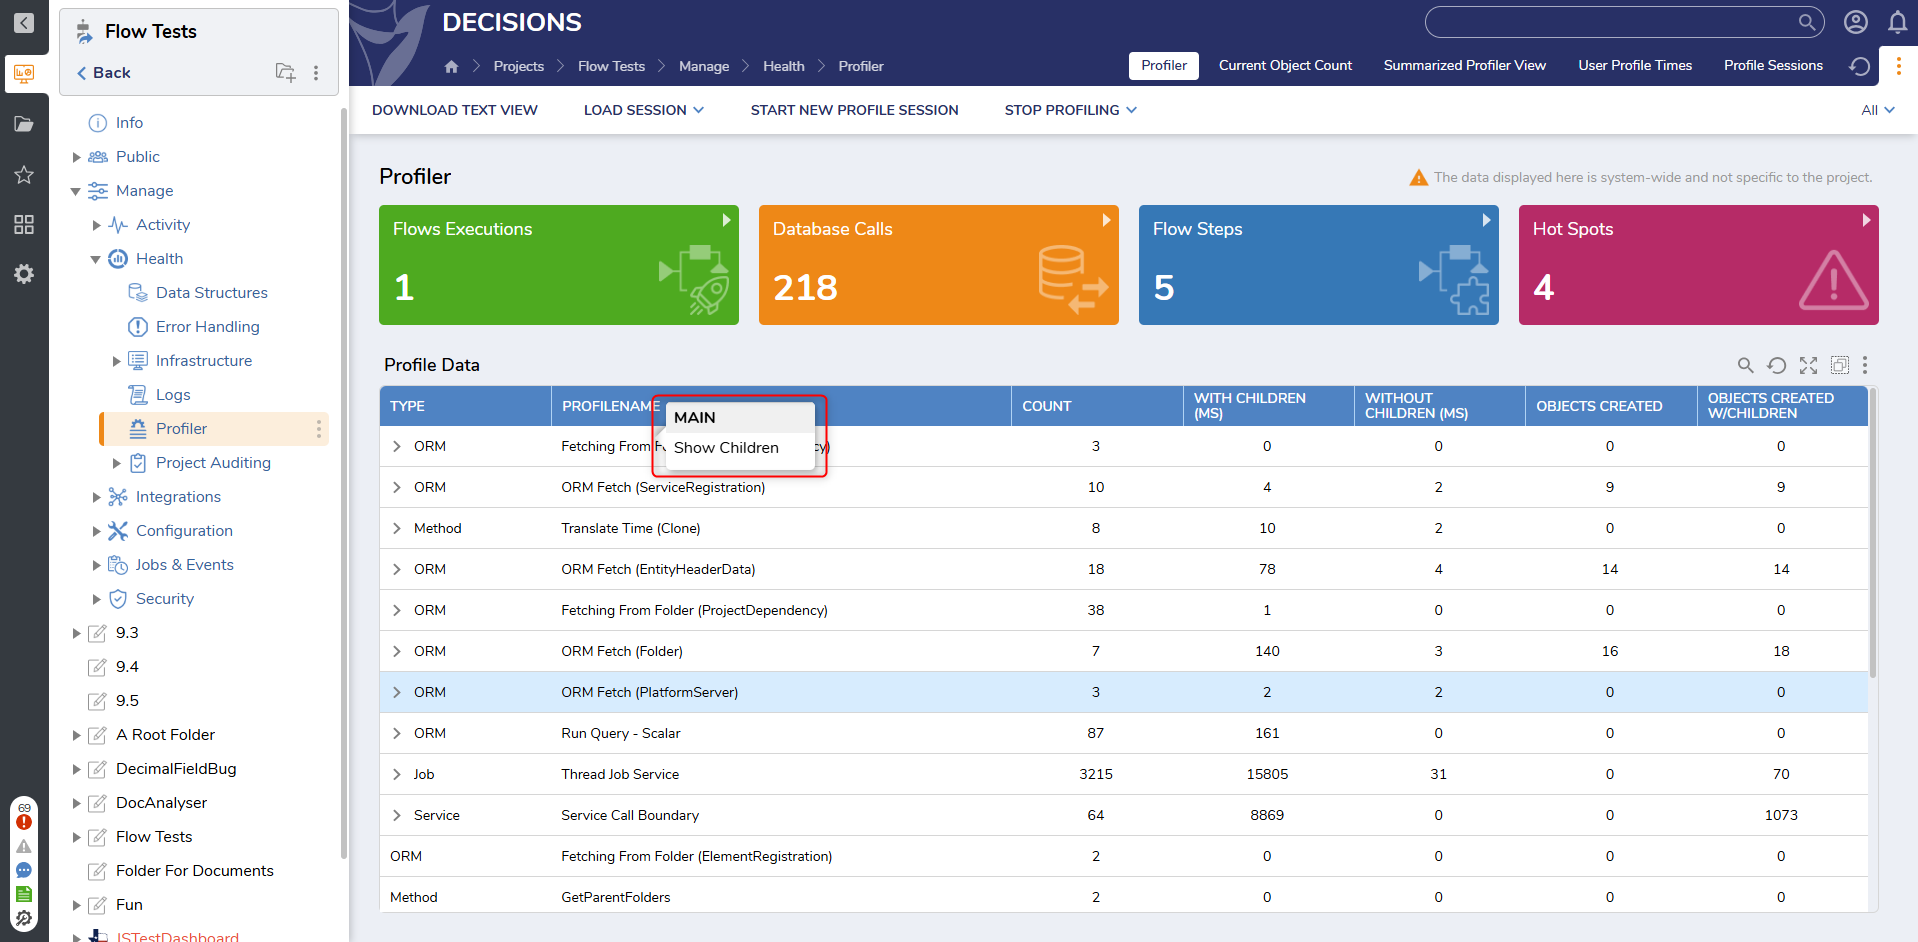
Profile Flow
In addition to profiling the whole system, users may utilize a special action to view Profiling details on a specific Flow.
To Profile a Flow, stop the Profiler by selecting STOP PROFILING from the top Action bar, and then select either Save Profile Data First or Without Saving.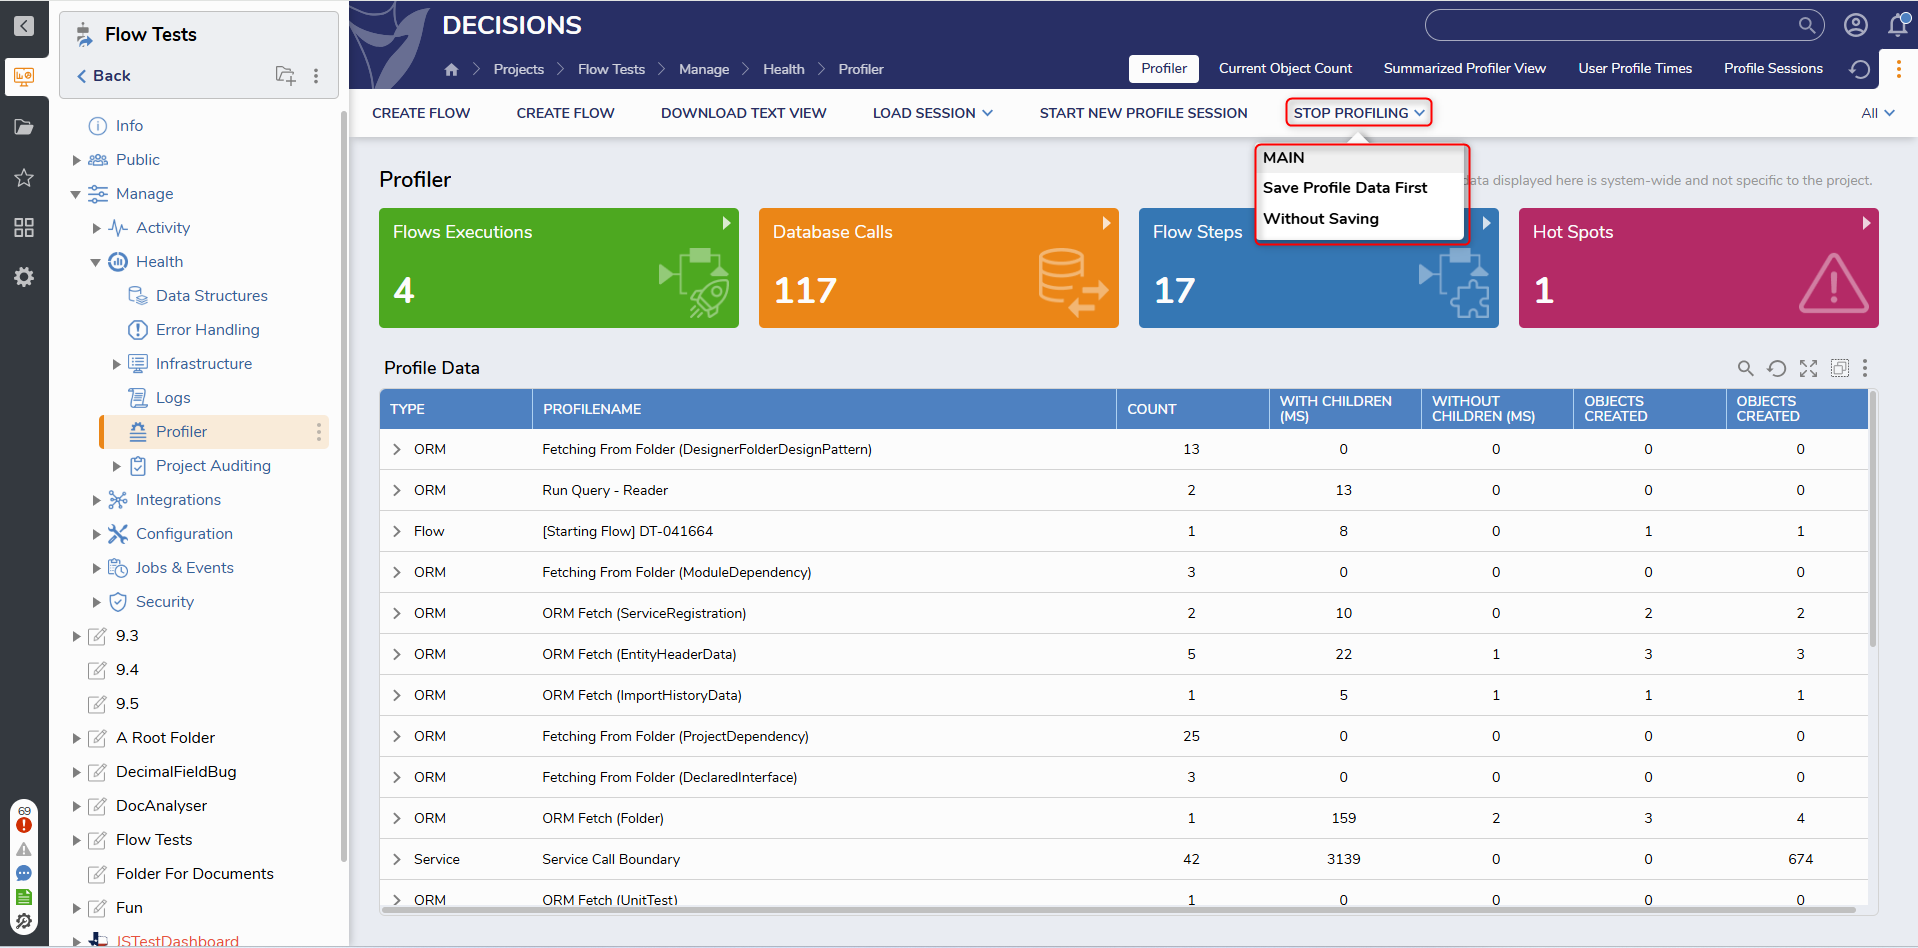
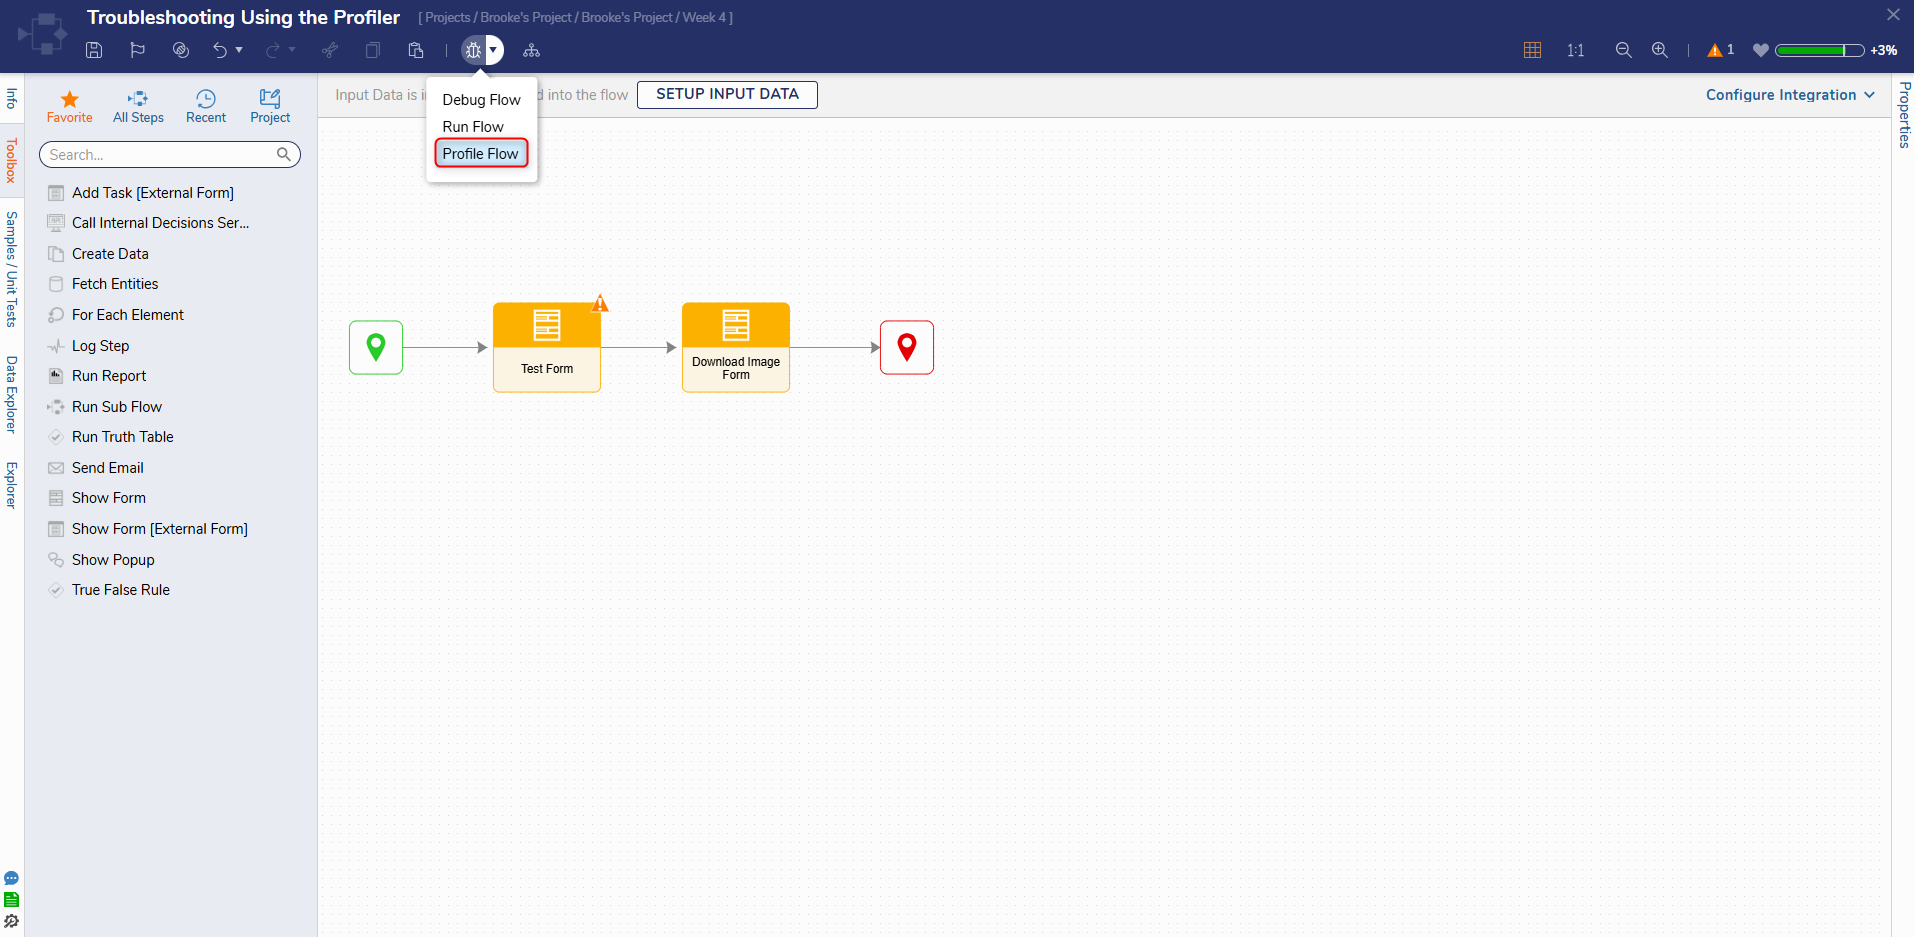
Then, navigate to and right-click on the Flow to be Profiled, and select Run [Advanced] > Profile Flow. This will pull up the Profile Result page for the Flow.
.png)
Debugger
In addition to accessing the Profiler through System Tools and via the Profile Flow action, users may use the Profiler within the Debugger.
- To initiate the Profiler from the Debugger, select STOP PROFILING within the Profiler via the top Action bar.
- Then open a Flow in the Flow Designer, click the arrow beside Debug and select Debug > Profile Flow from the top Action bar.
Similar to how using Profile Flow on a Flow acts, a Profile Result page for the Debugger's Profiler will appear, displaying Profile information pertaining to the Flow on which the action was enacted.
Feature Changes
| Description | Version | Release | Developer Task |
|---|---|---|---|
| Removed the Download action and replaced it with Download Text View. Profiler downloads are now only in .txt format. | 9.5 | November 2024 | [DT-042518] |