Overview:
Diagram Tiles are a way to capture data and present it in an attractive manner using info-graphics. Charts, Shapes, Steps, Labels and more are available to add to diagram tiles to display data in a relevant manner. The Diagram Tile Designer allows you to drag, drop and customize each component of the tile. There are flow step shapes available to coincide with flows for the purpose of displaying on a dashboard where a process is at.
Two main things are done in the Diagram Tile Designer: define what the tile will look like on a dashboard and define where the data is coming from.
These tiles can be re-used throughout different dashboards.
Example:
Diagram Tile Inputs allows you to define inputs and builds a flow for you to define where the data is coming from.
This example is utilizing a dashboard that has already been built. To learn more about creating dashboards, click here.
In the Page Elements panel on the right side expand Tiles, drag and drop Diagram Tiles to an empty place in the dashboard.
.png)
With the Diagram Tile selected, in the Properties panel, select Create. Name your new Diagram Tile Flow and select CREATE.
.png)
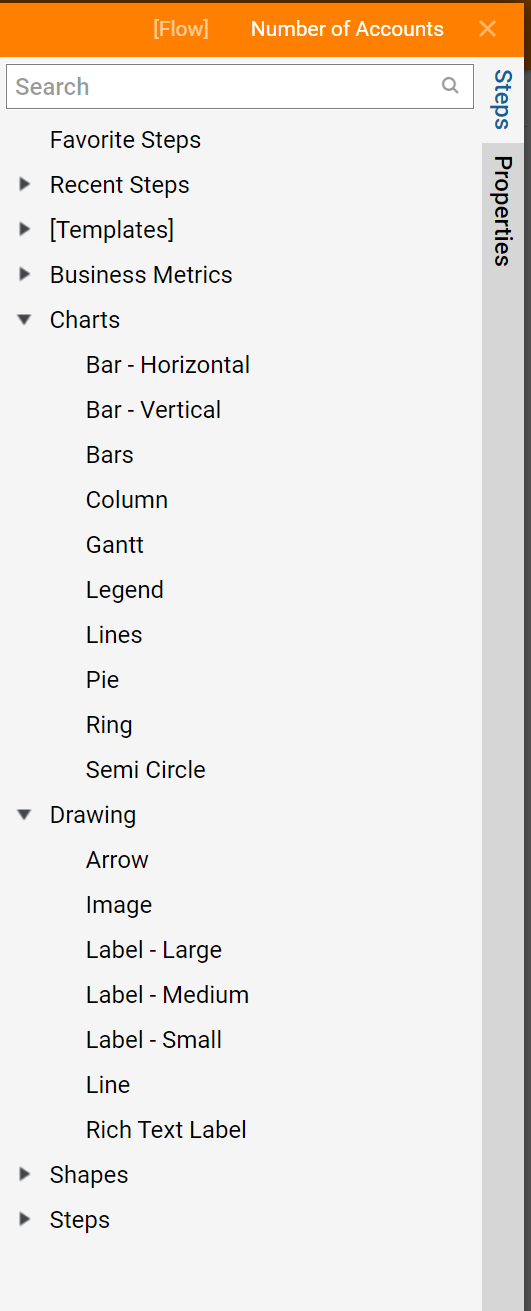
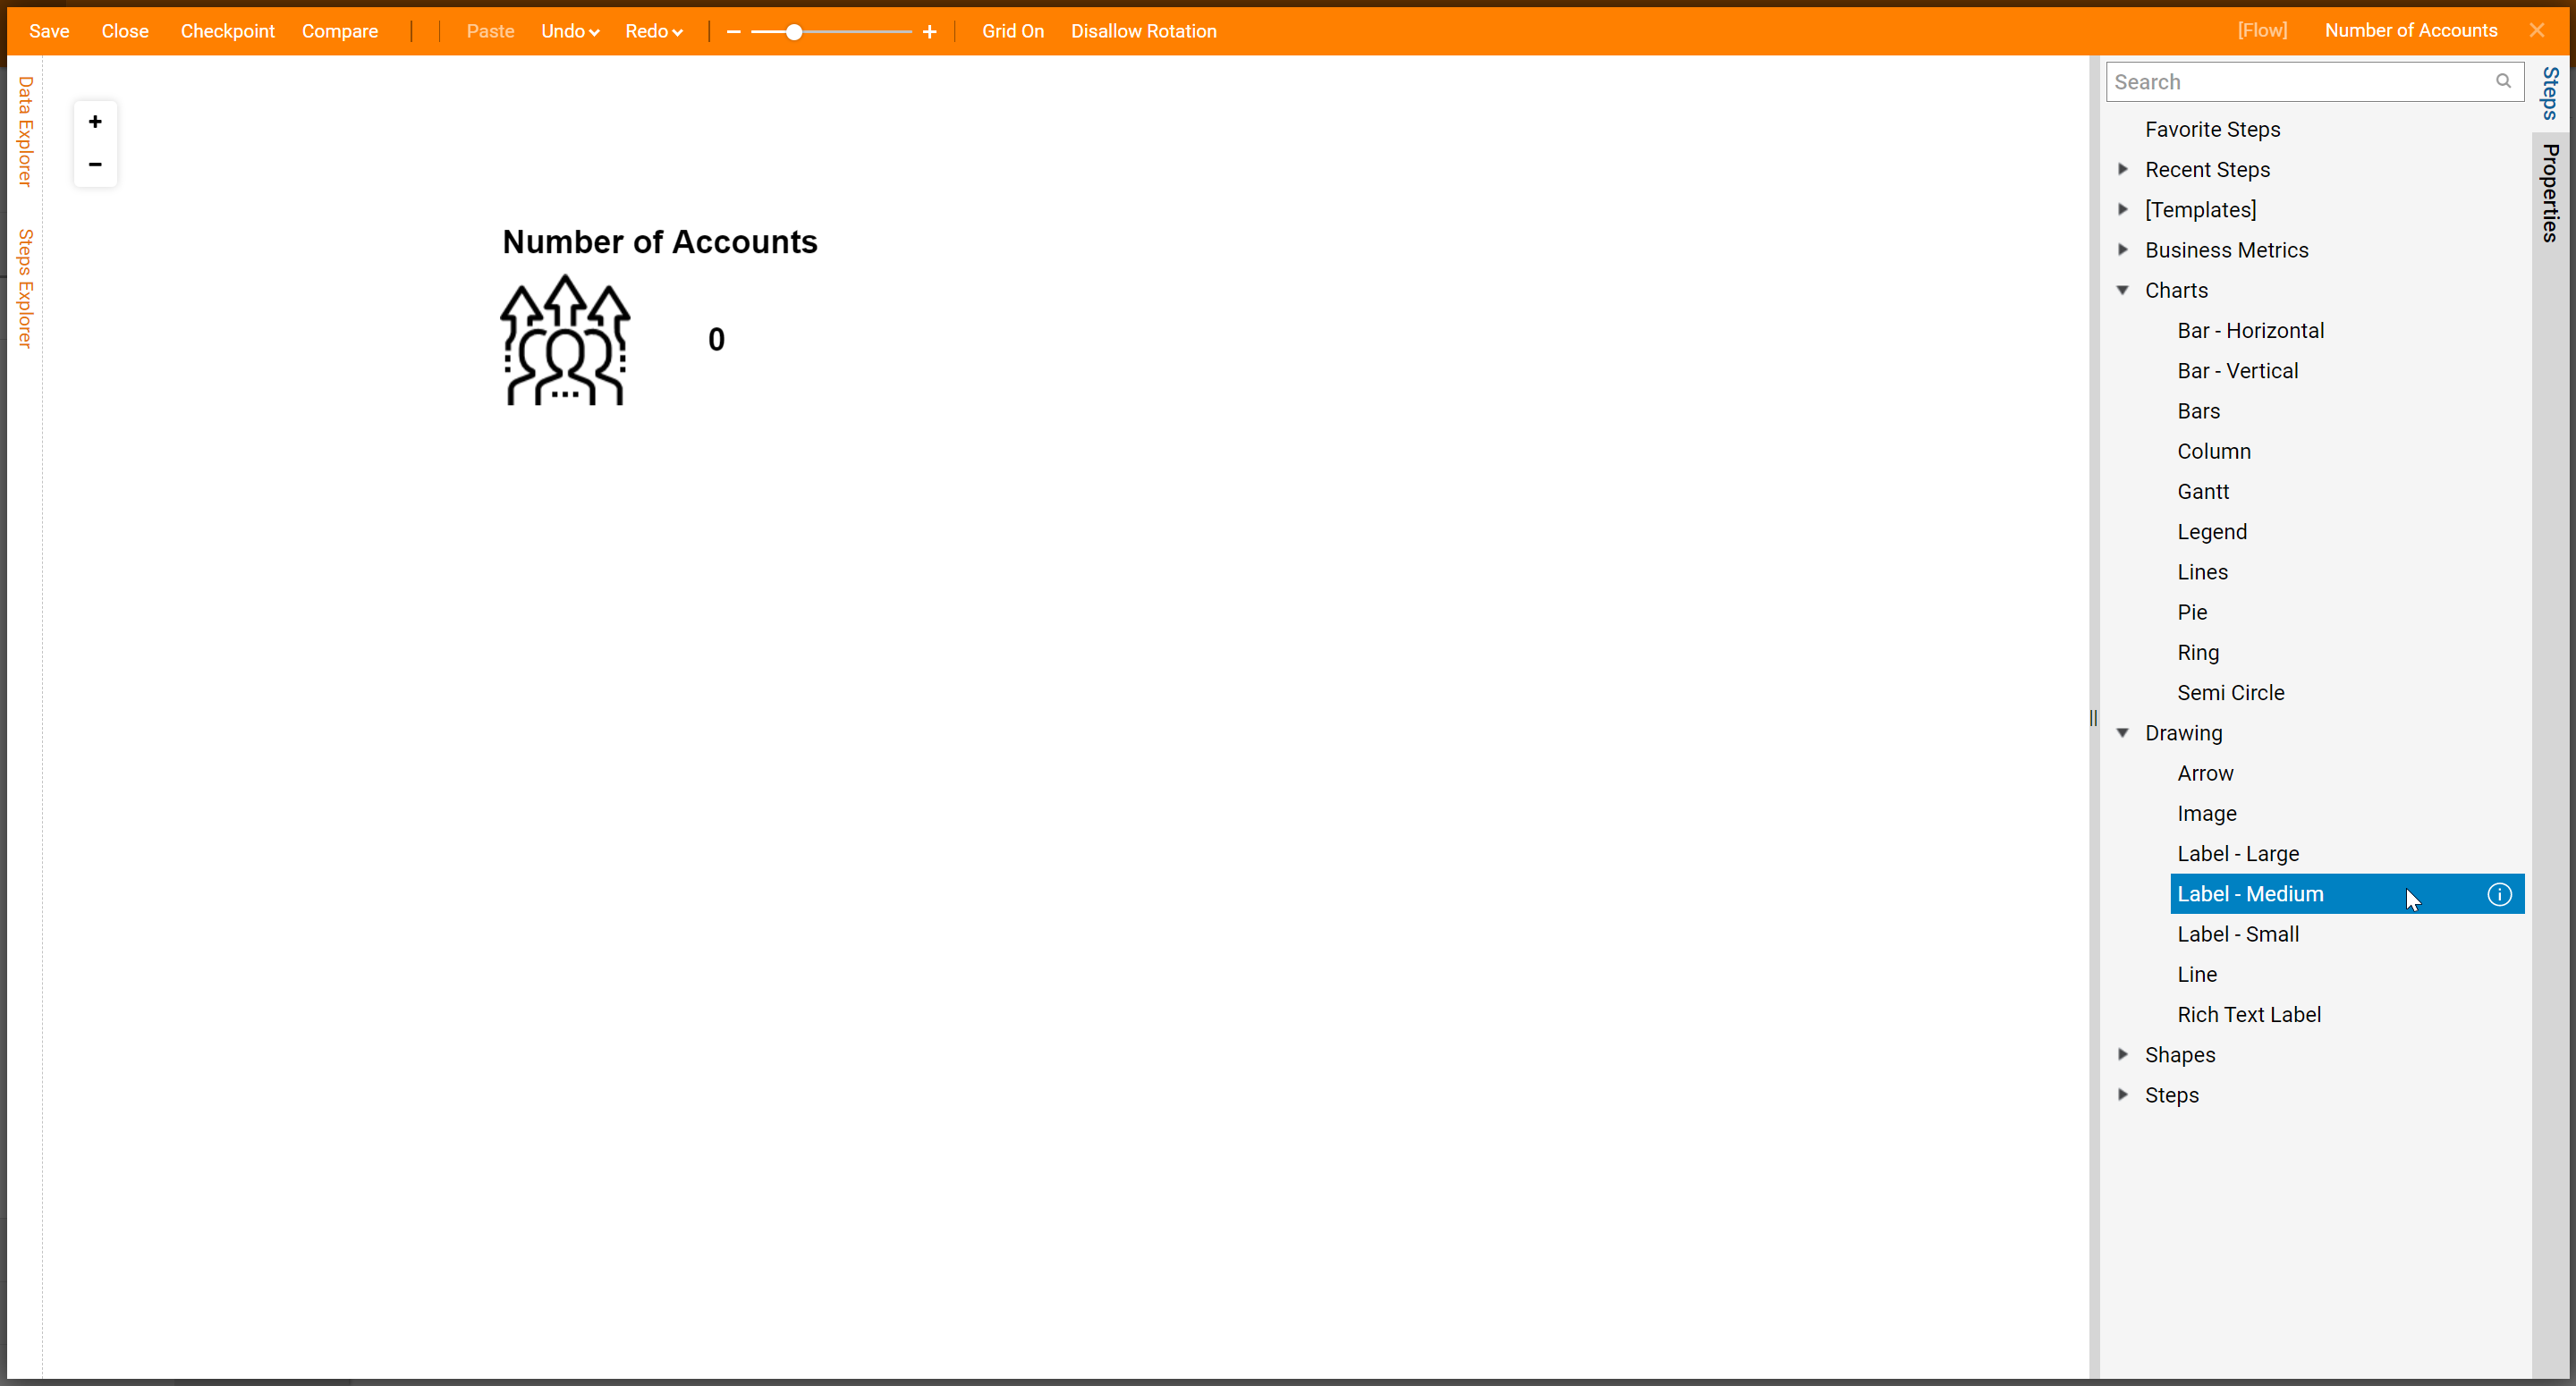
Within the Diagram Tile Designer, there are many options to customize your tile within the Steps panel.
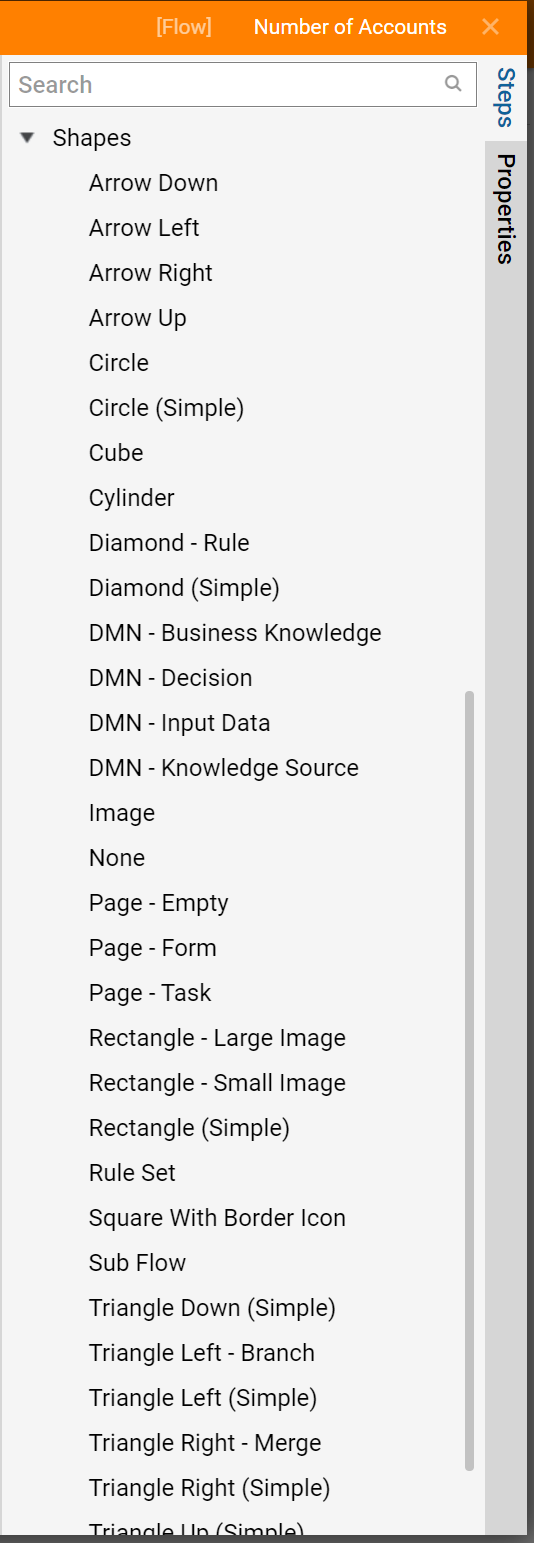
For the first step drag a Image from the Shapes drop down to the workspace.
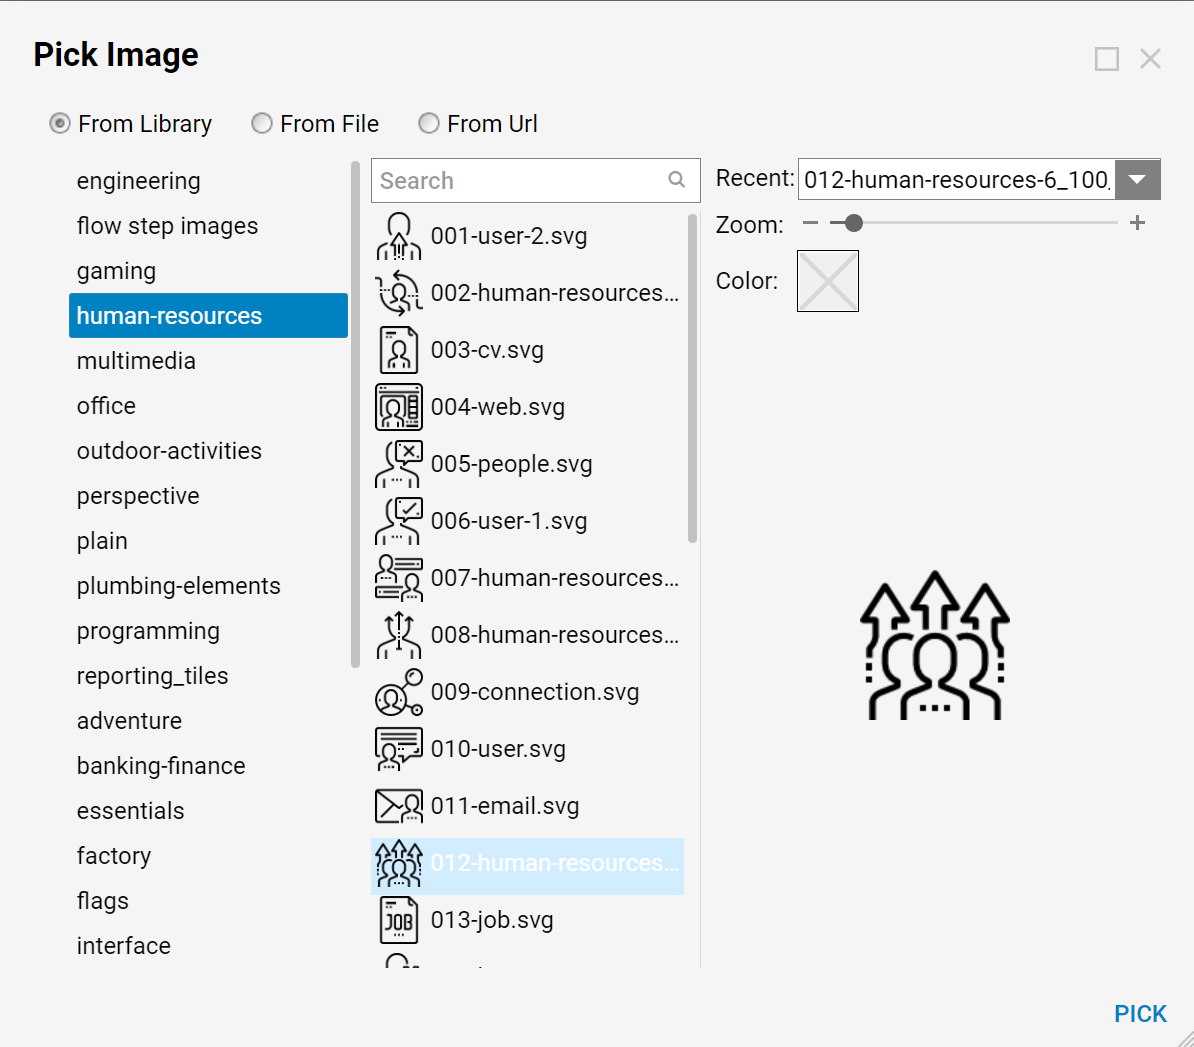
With the Image selected, navigate to the Properties panel and select the icon that shows "... " under Image.
The Pick Image dialog will appear, there are nearly 20,000 icons to choose from within the Decisions Library. Icon can be uploaded from a computer or by URL. The zoom option allows the image to be made smaller or bigger, icons colors can be changed as well.
Next, drag and drop a Label - Medium for the title and another for the number that will be controlled by data.
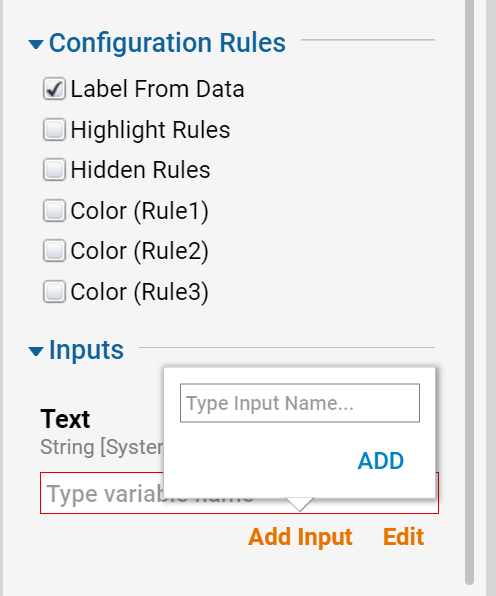
Select the Label that will be controlled by data, within it's Properties panel under Configuration Rules select Label From Data.
Under Inputs, select Add Input. This feature allows the ease of adding an input for the tile component, this feature also chooses the correct data type automatically.
This tile is complete, Save and Close to return to the Page Designer.
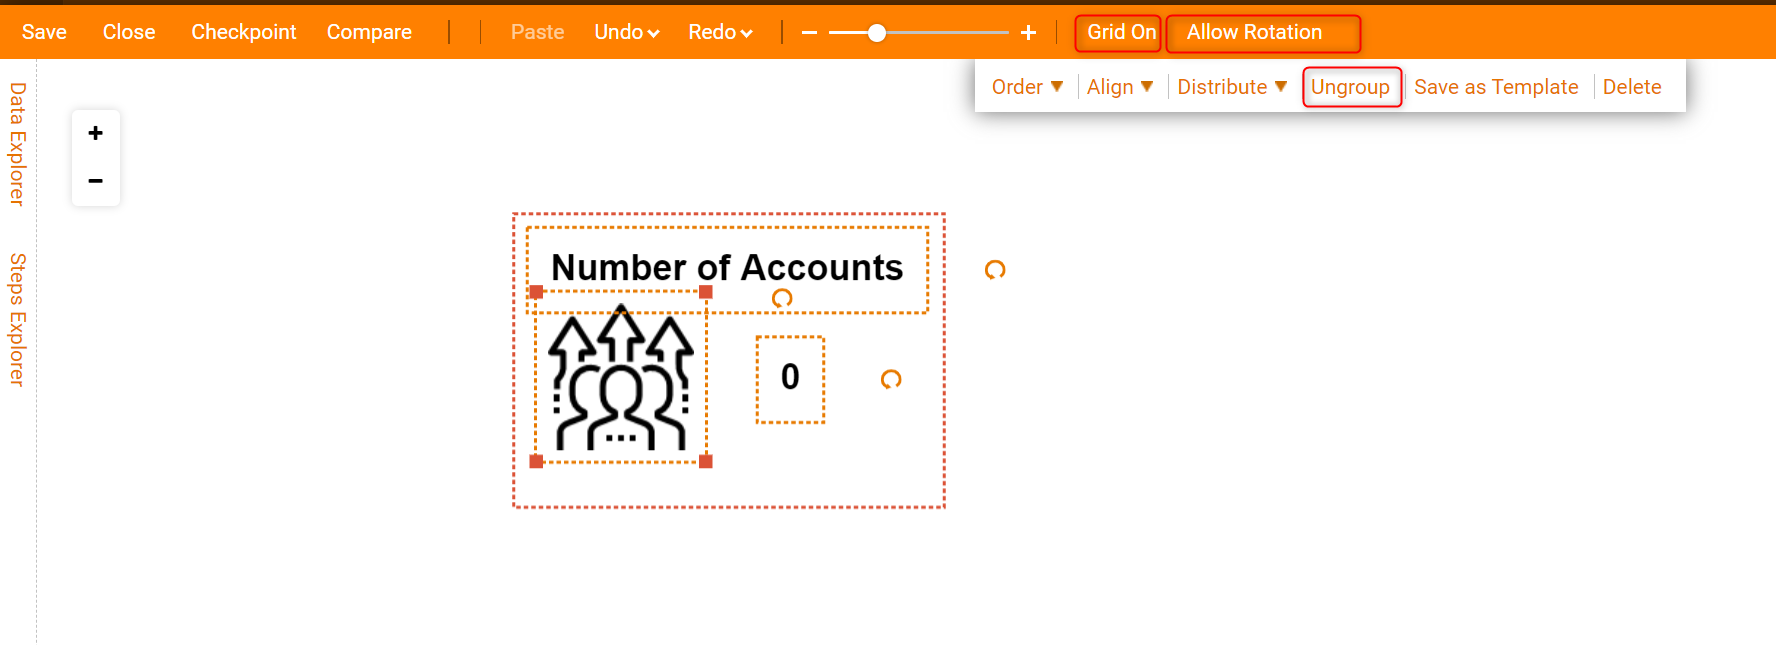
Click and drag around all elements, or select one element and hold control while selecting other elements. With multiple elements selected the option to Group is available. This allows the user to group elements together and move them around together. Another option available is to save groups as a template to use again.
Grid On/Off turns a grid on the background to assist in keeping elements level.
Allow Rotation, turns on rotation for elements to be rotated 360°.
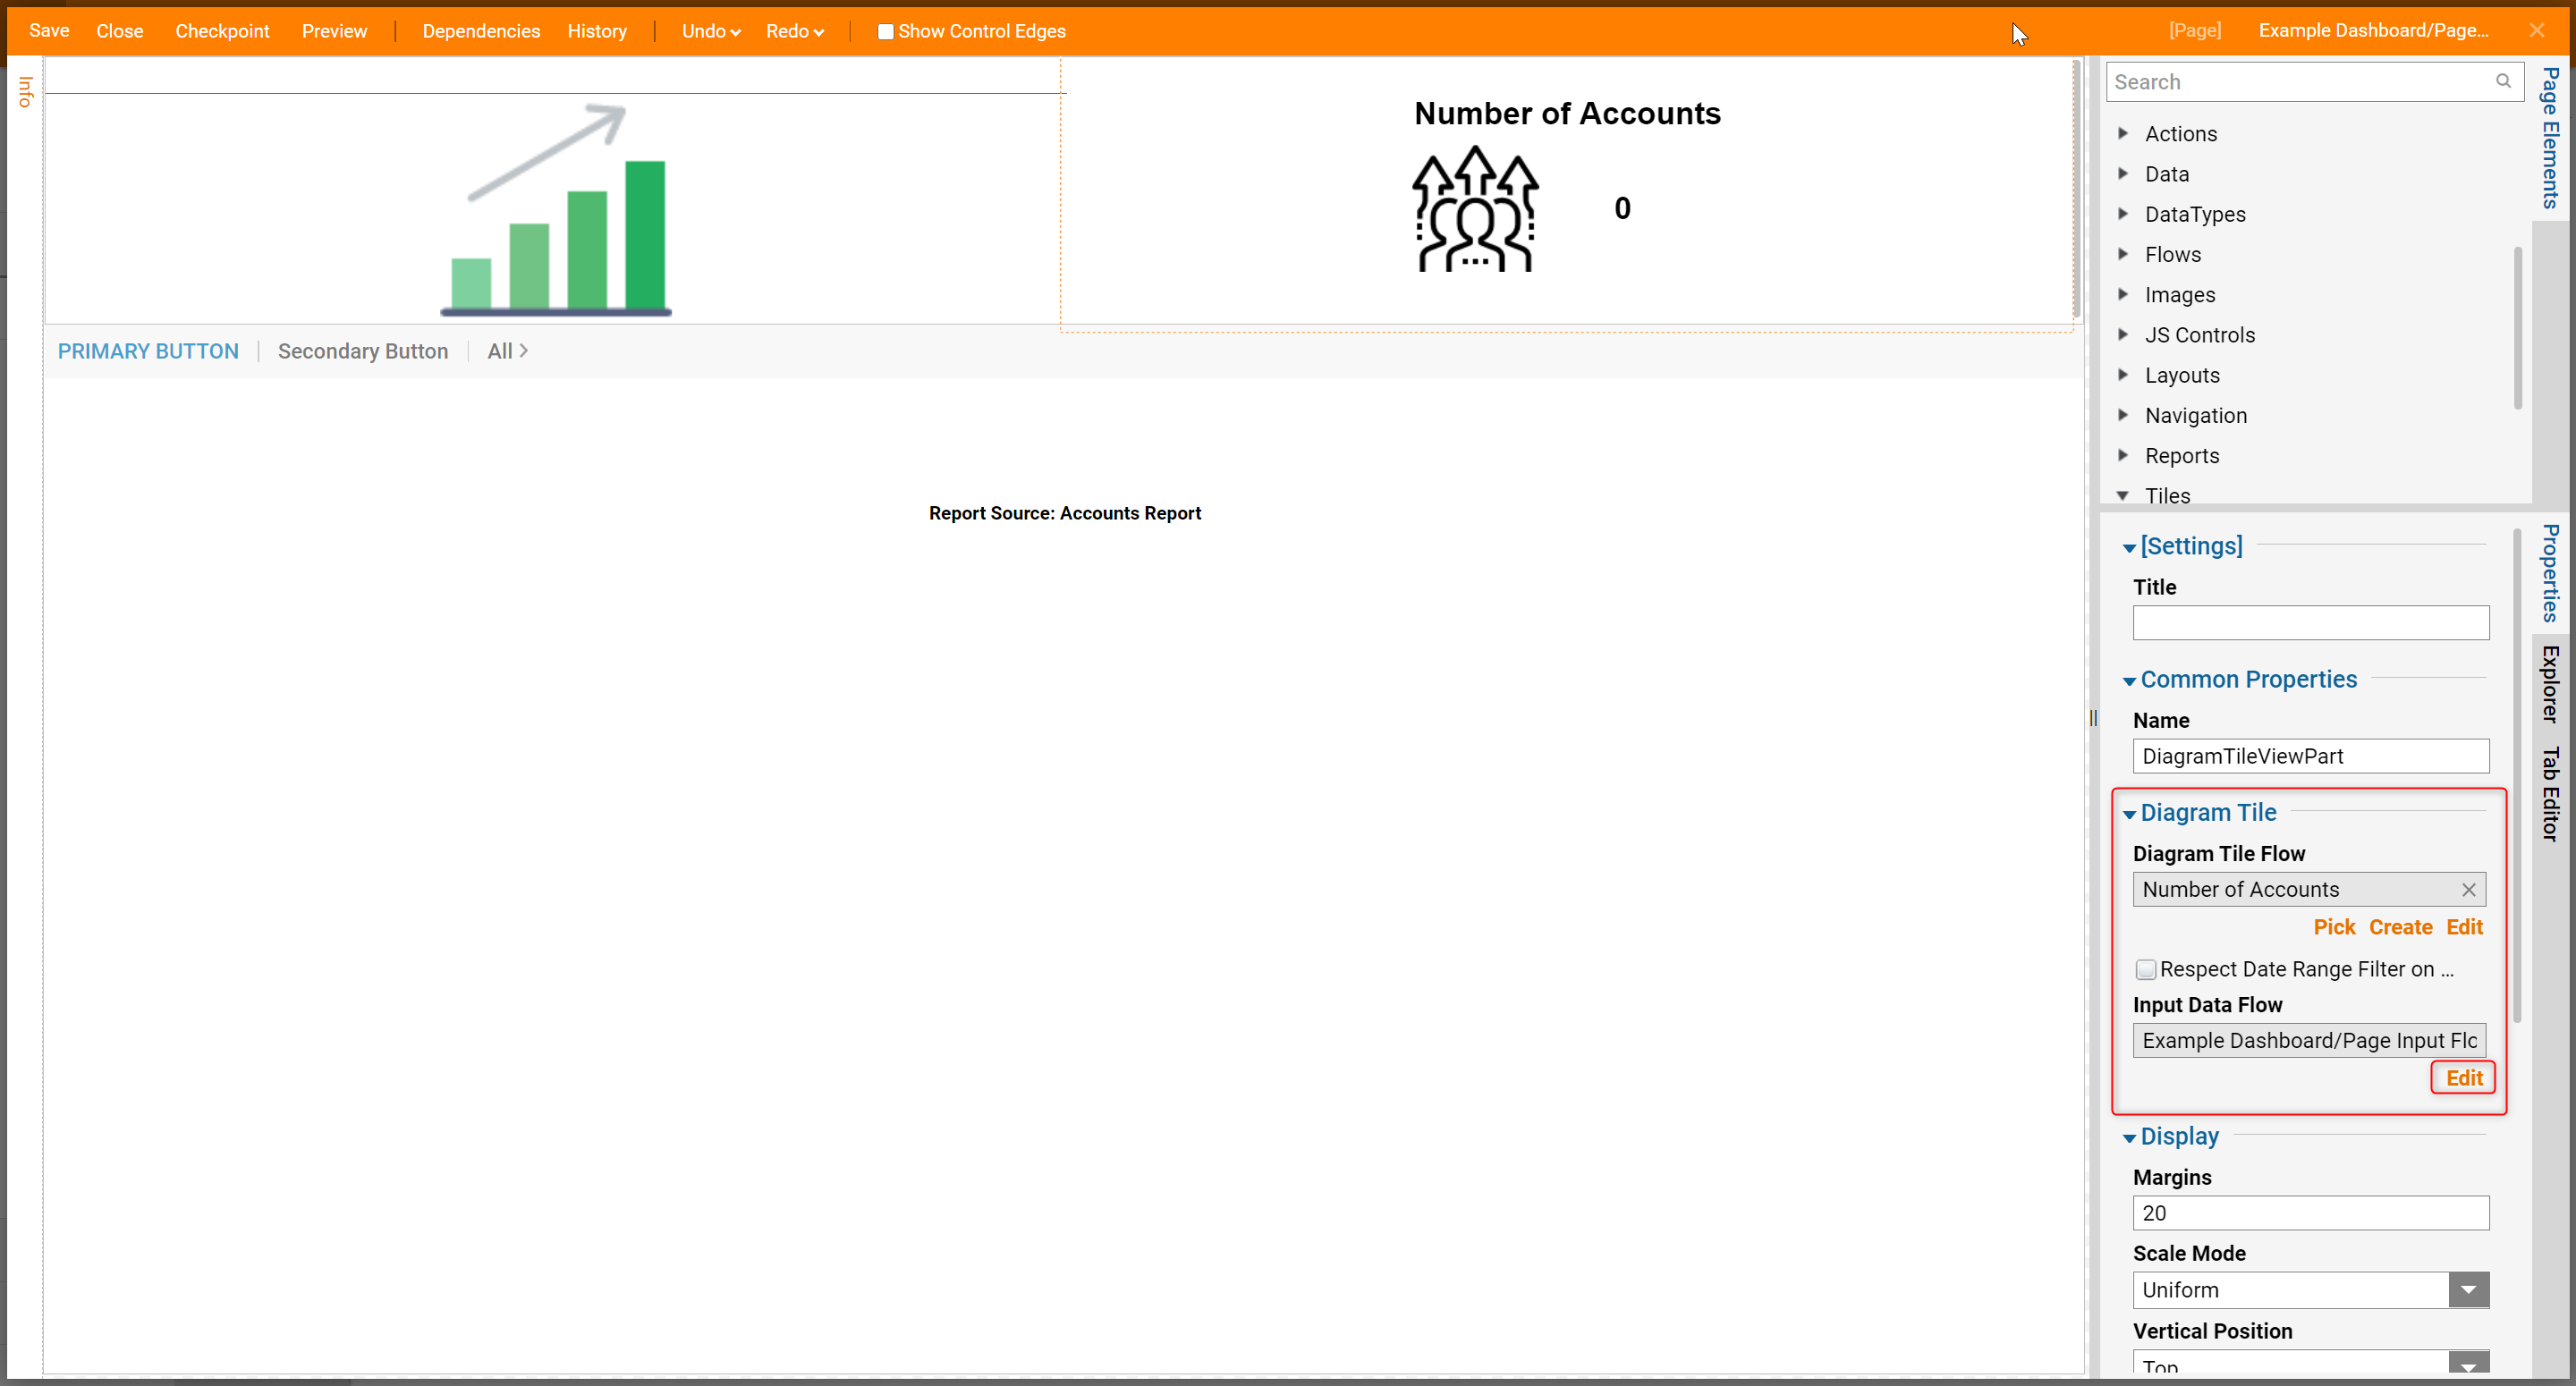
The Diagram Tile will be configured within the Properties panel with the tile selected. Under Diagram Tile, the Diagram Tile Flow what we just finished creating.
To configure and edit the data going into the Diagram Tile select Edit under Input Data Flow.
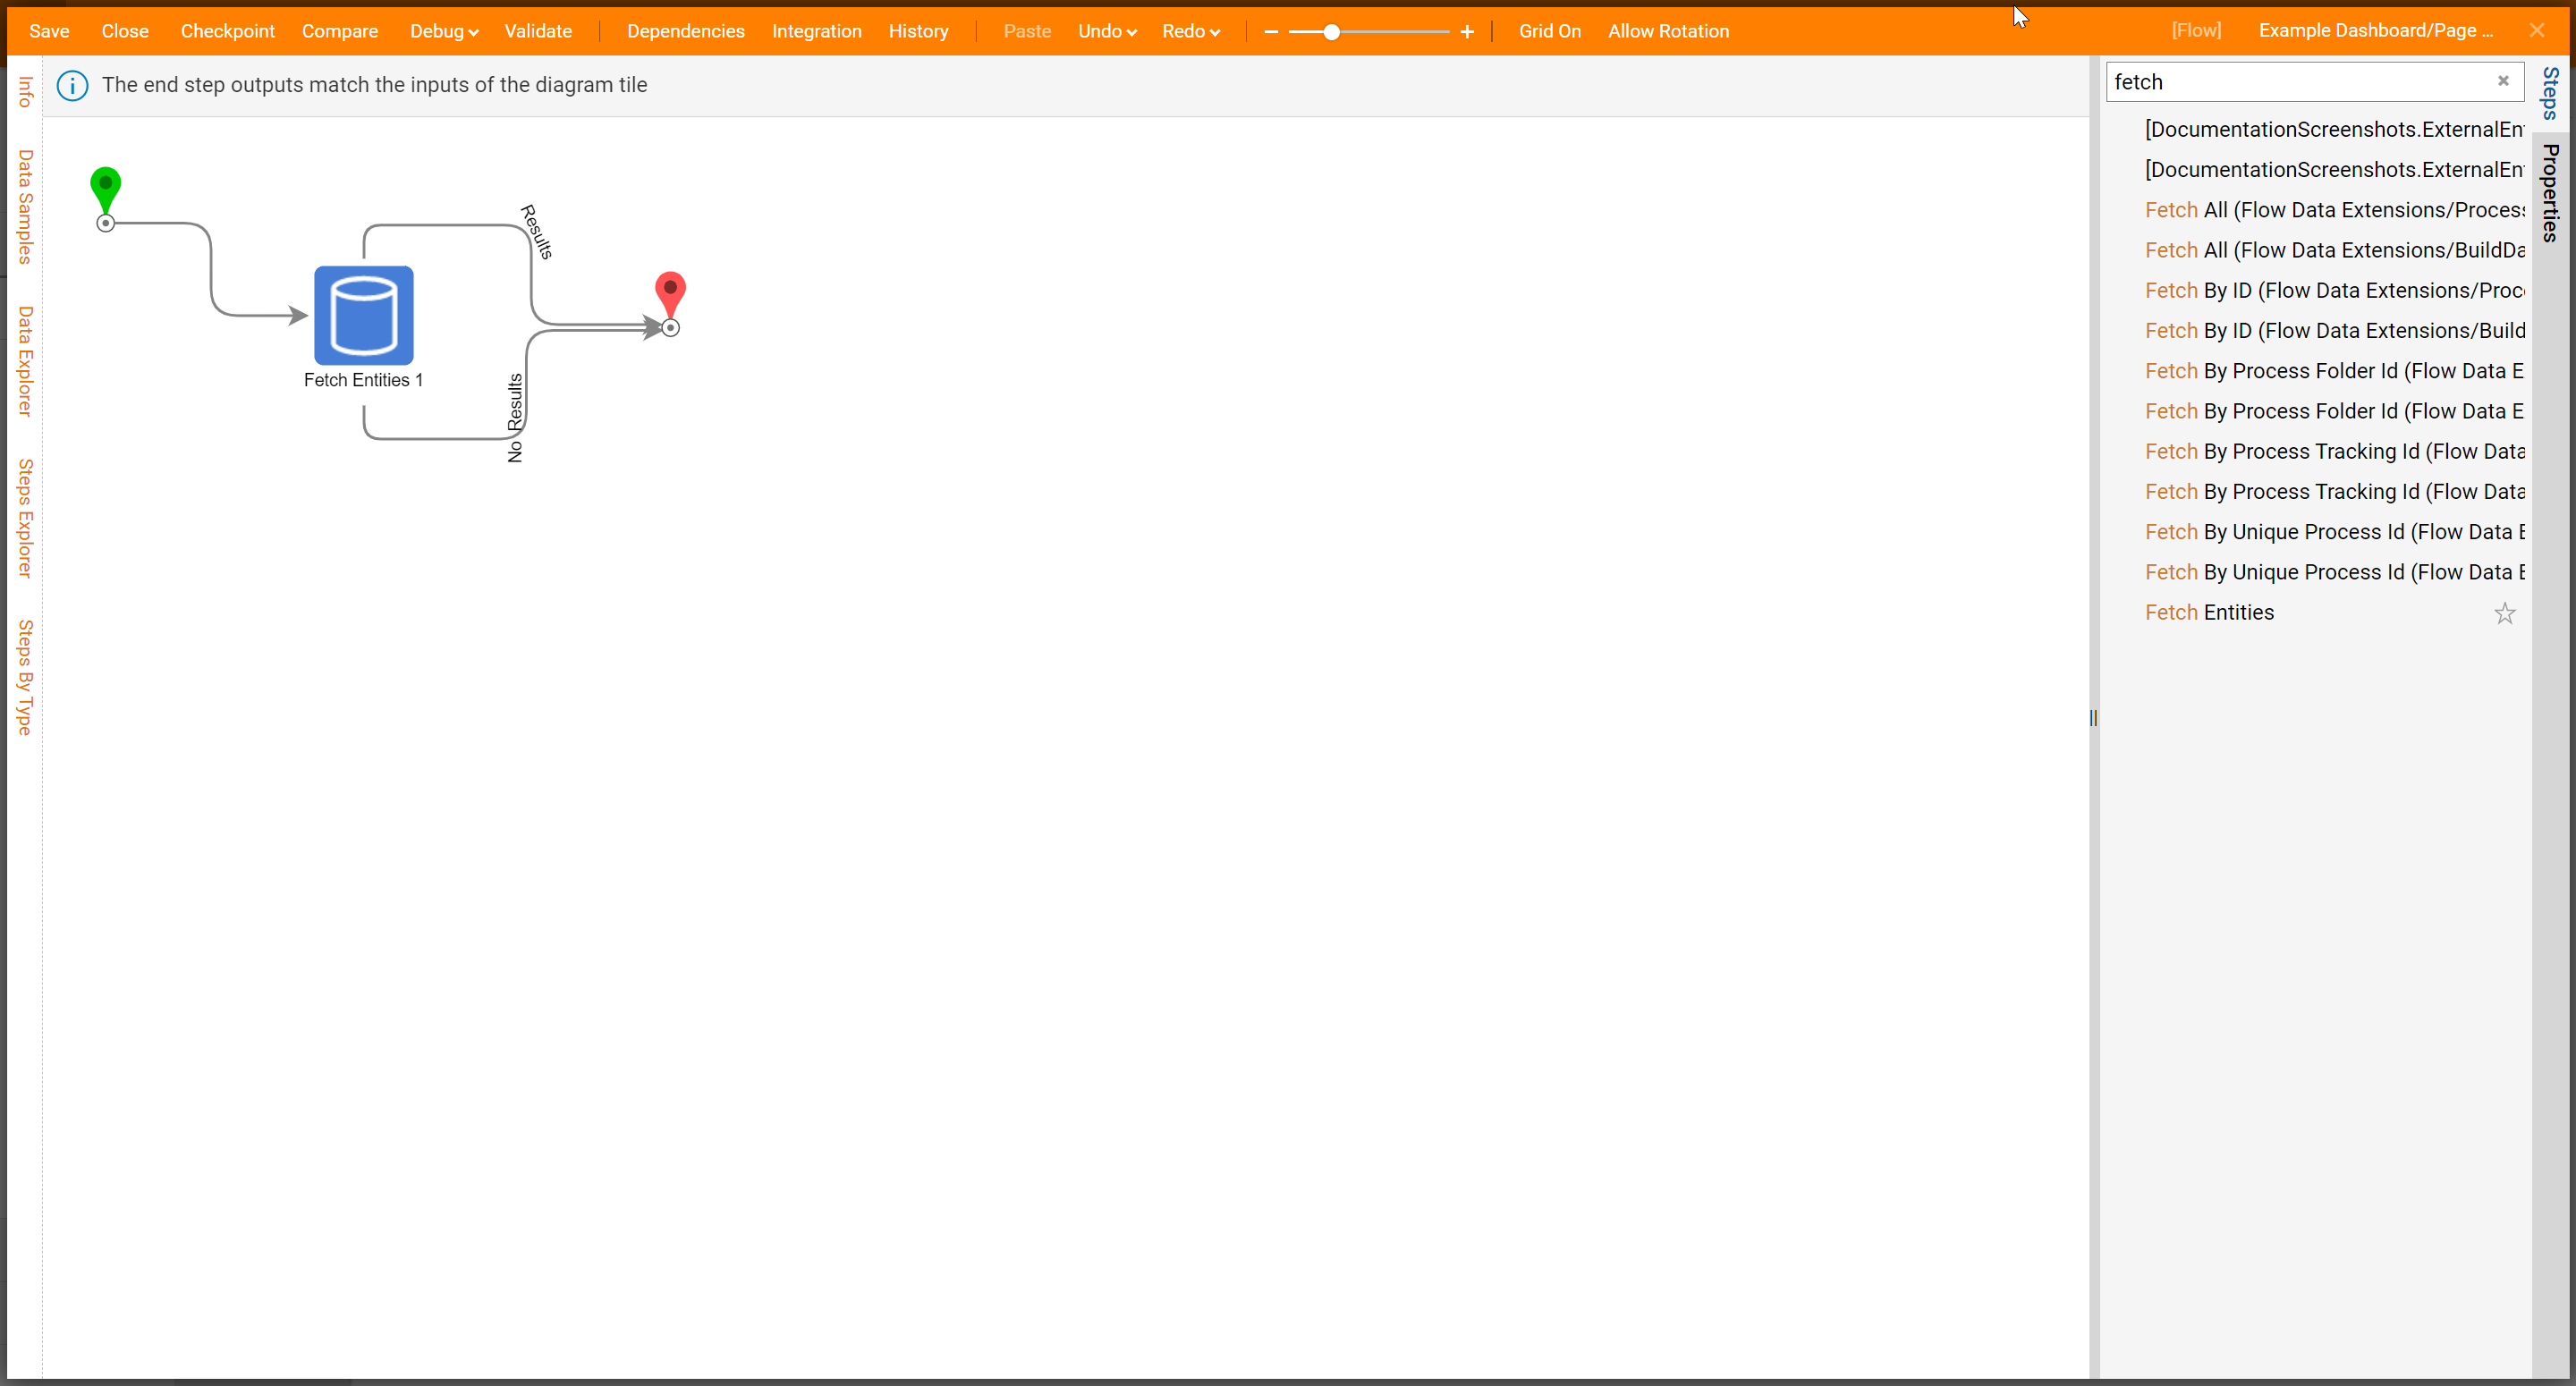
Within the Steps panel, drag and drop a Fetch Entities step to collect the Total Accounts.
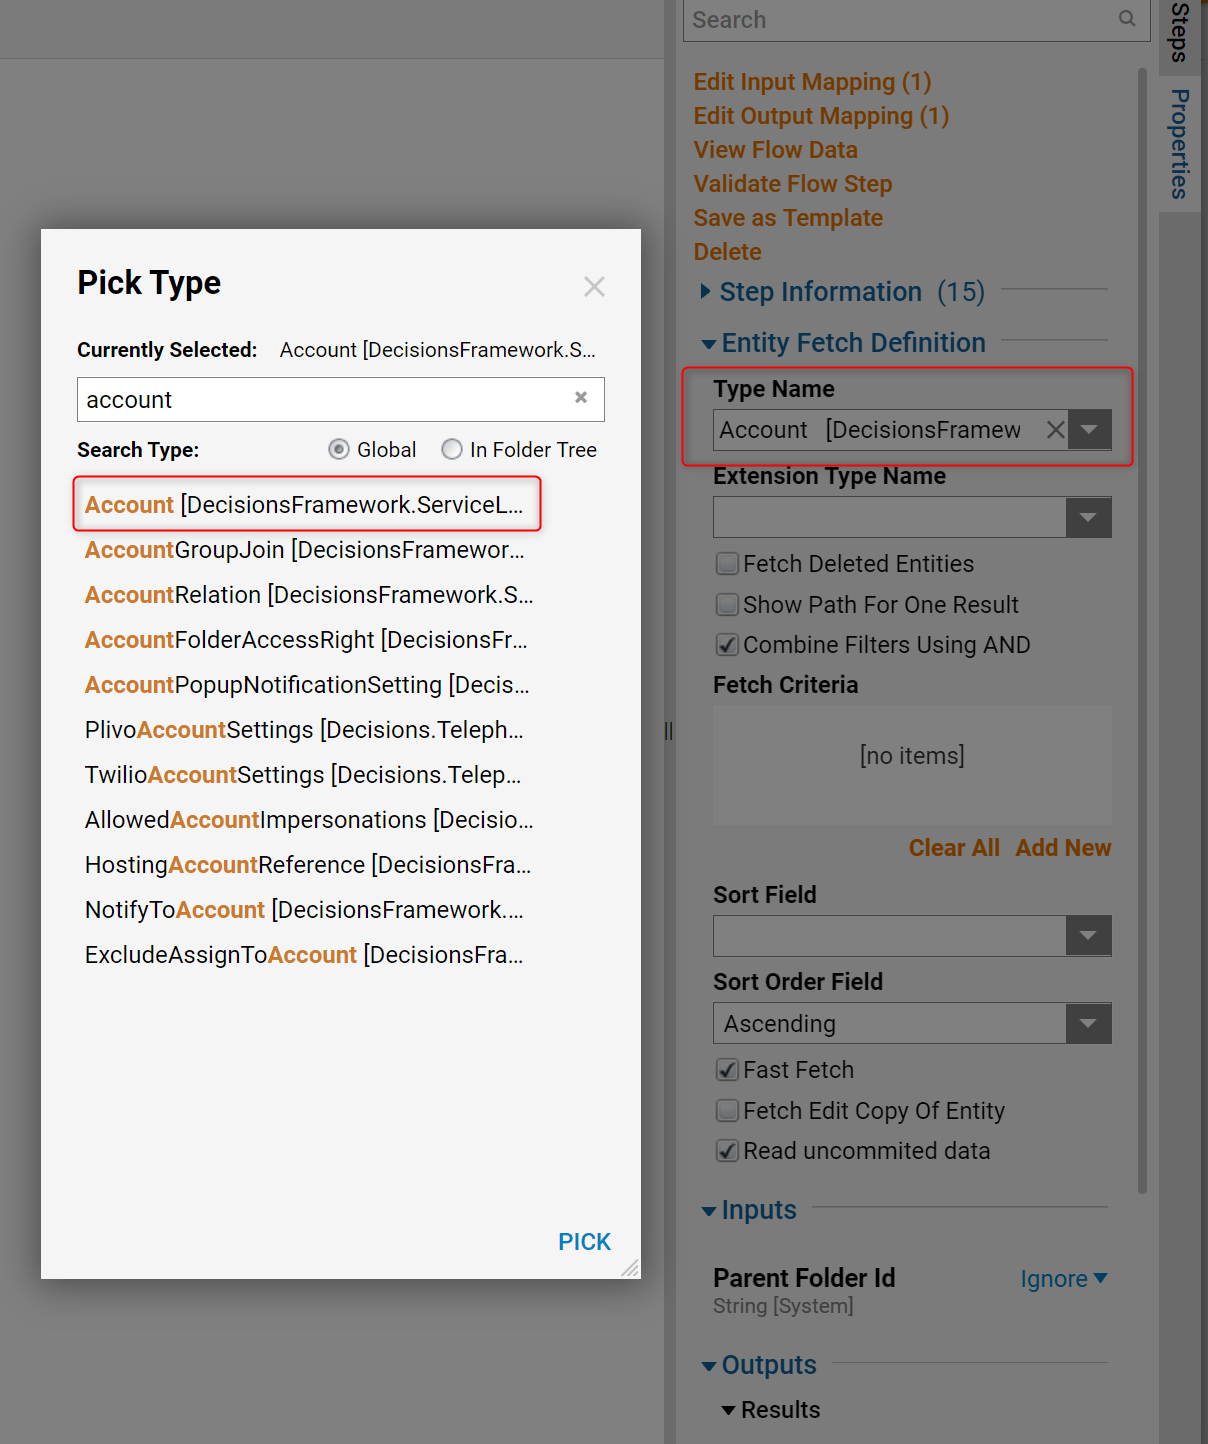
To configure the Fetch Entities step to find all accounts, in the Type Name > Pick Type dialog select Account [DecisionsFramework].
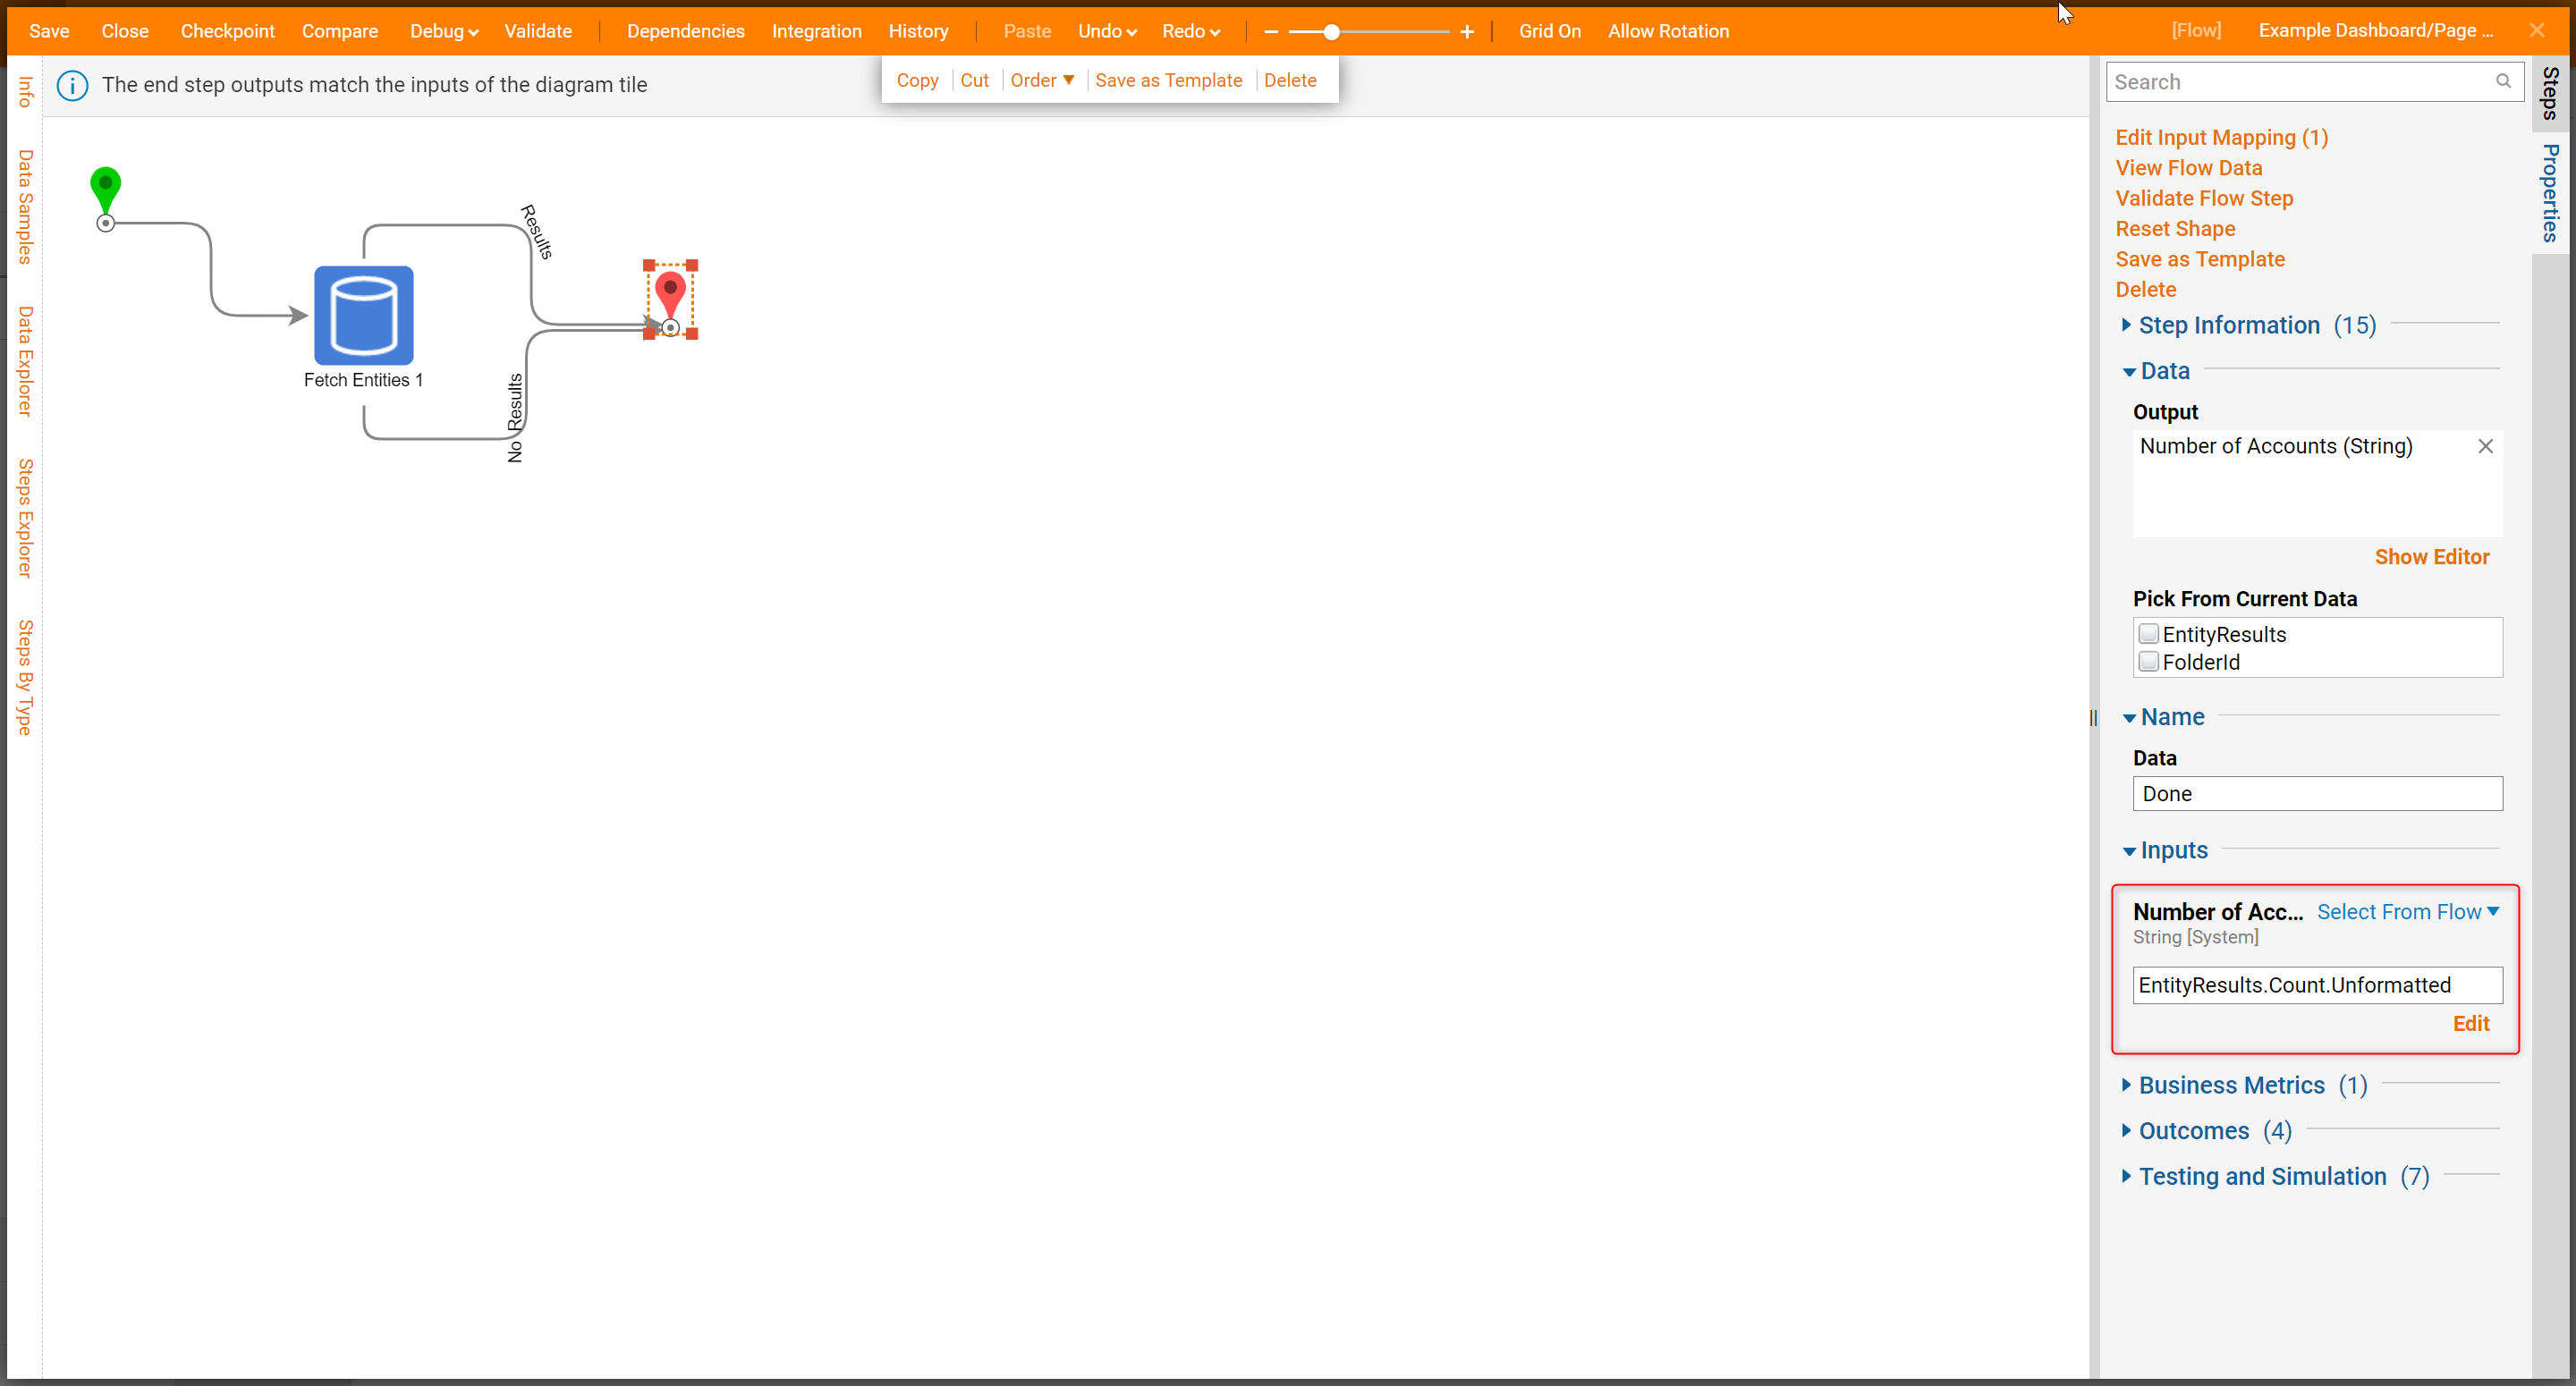
For the End step input, select Select From Flow then Pick. Select the output from the Fetch Entities step.
The End step will already be set up to intake the data that is set up as inputs in the Diagram Tile. In this example, the flow engine is fetching all accounts to map into this step. Save and Close the Flow designer and the Page Designer.
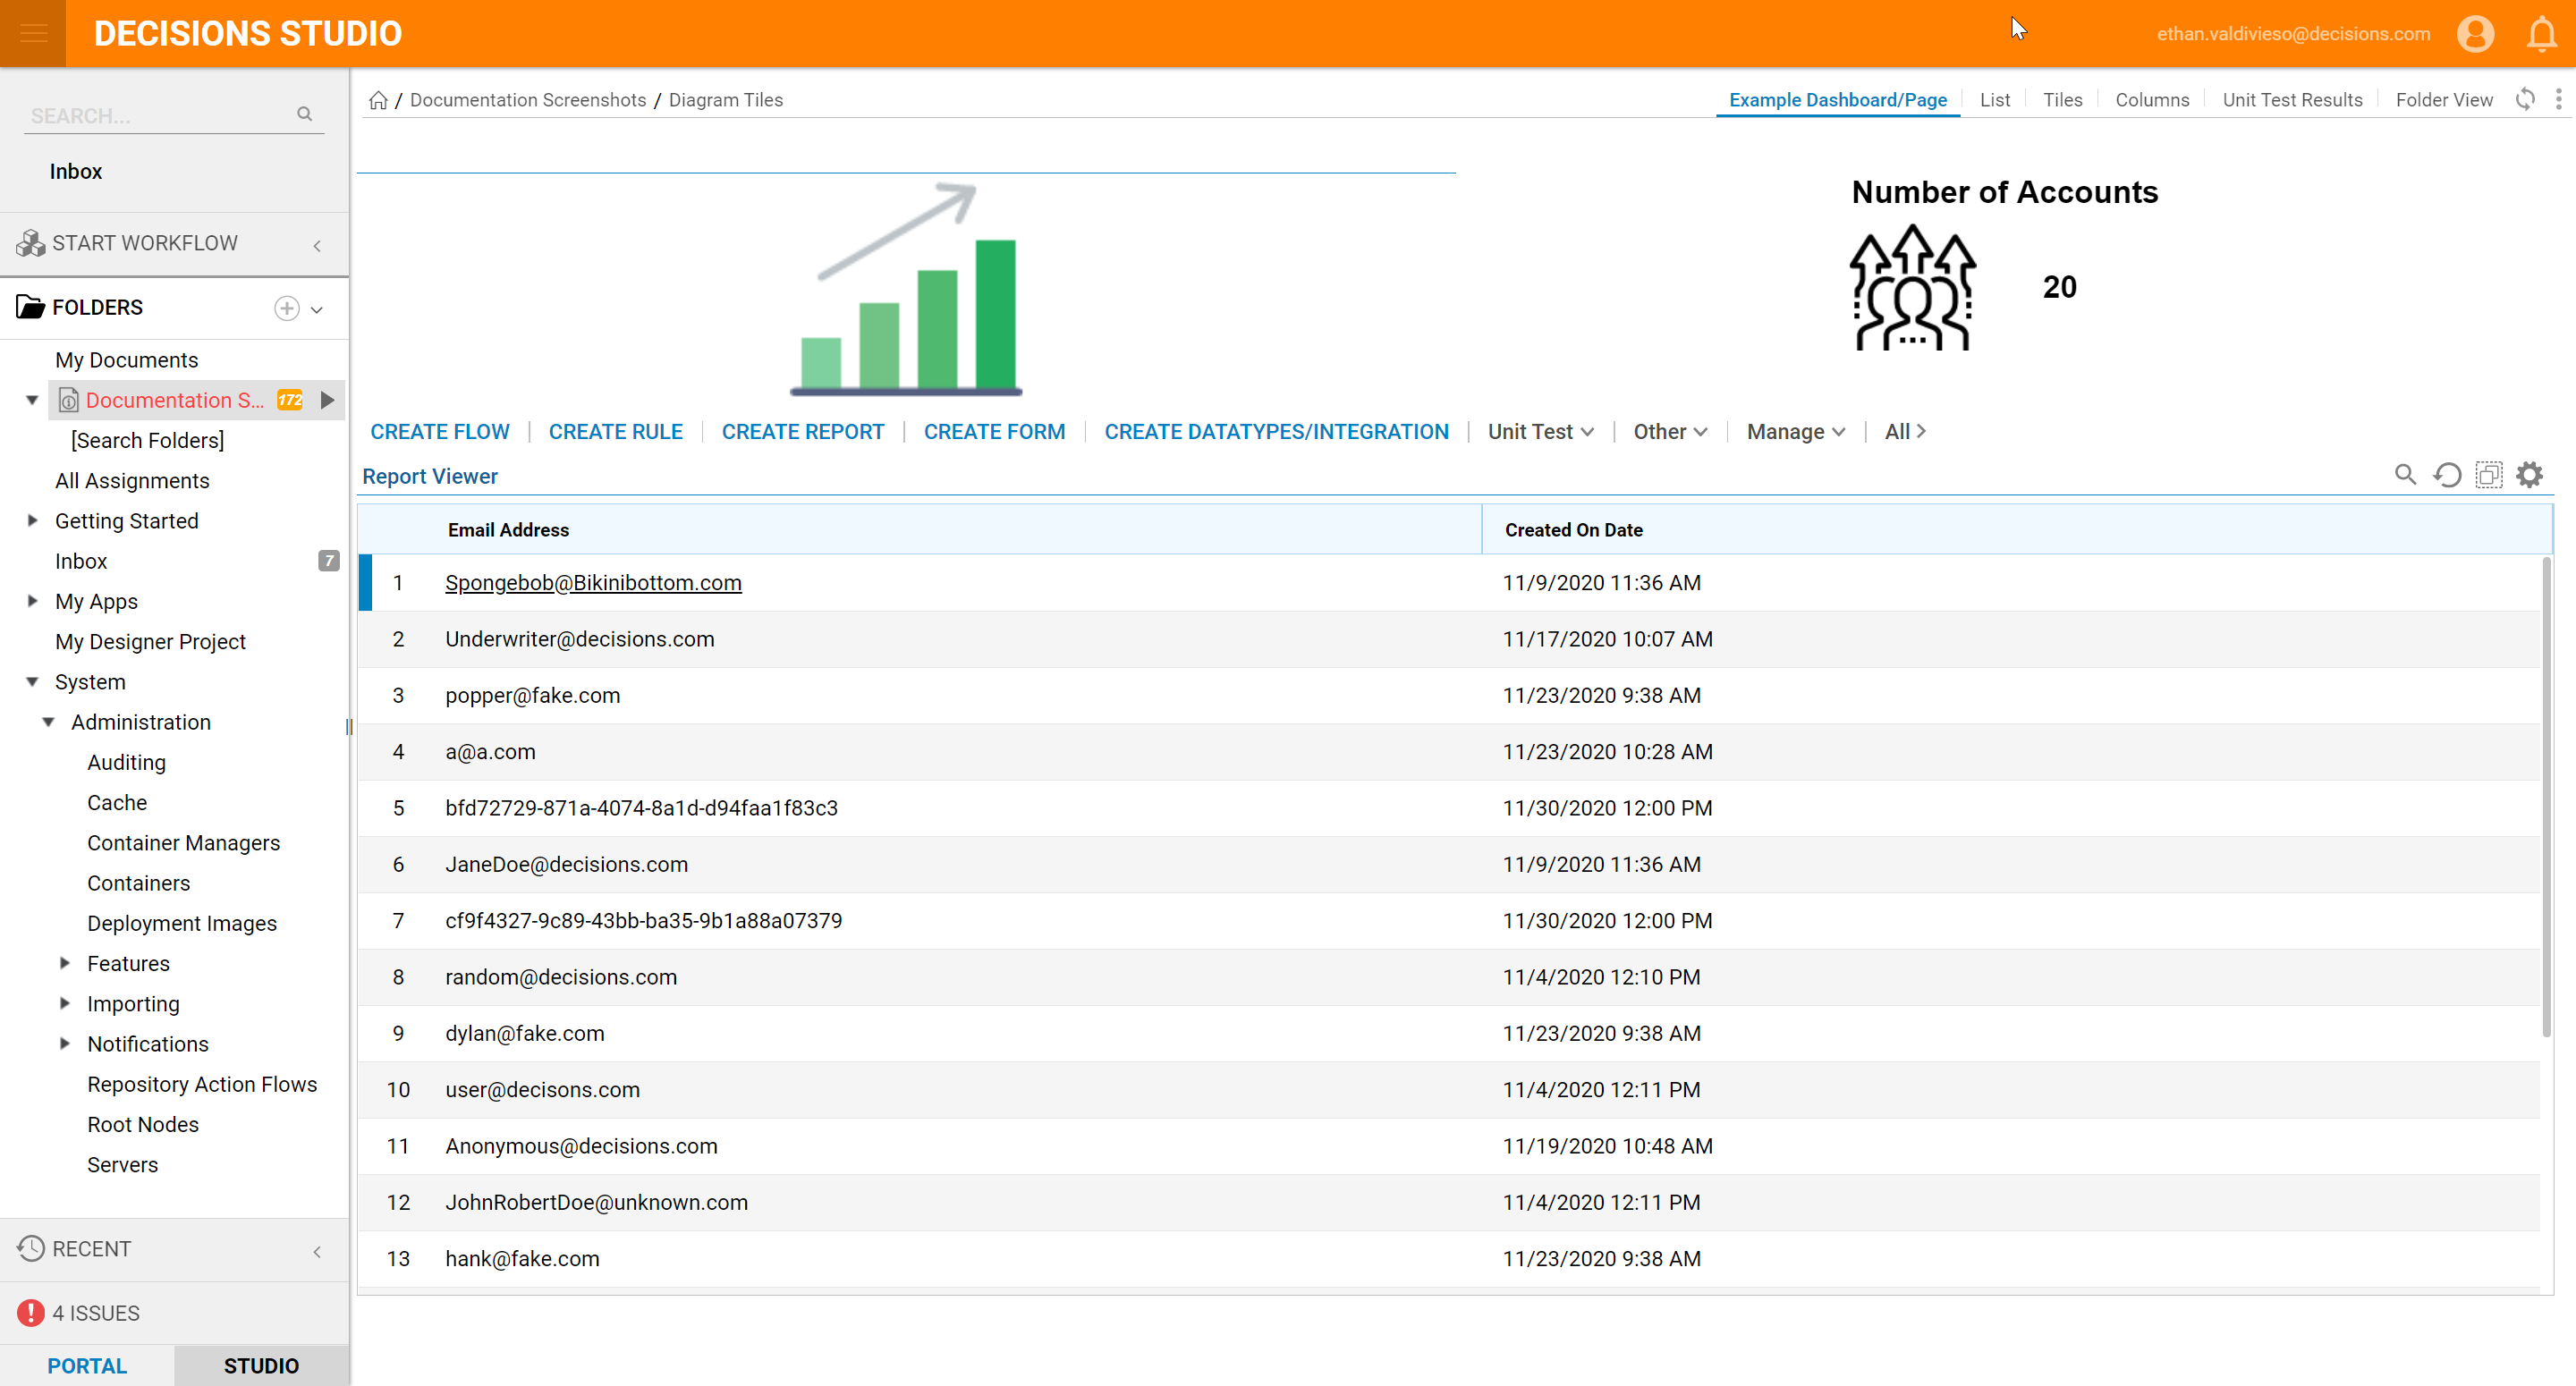
Below shows the completed Diagram Tile. The page is displayed through a folder.
