Overview
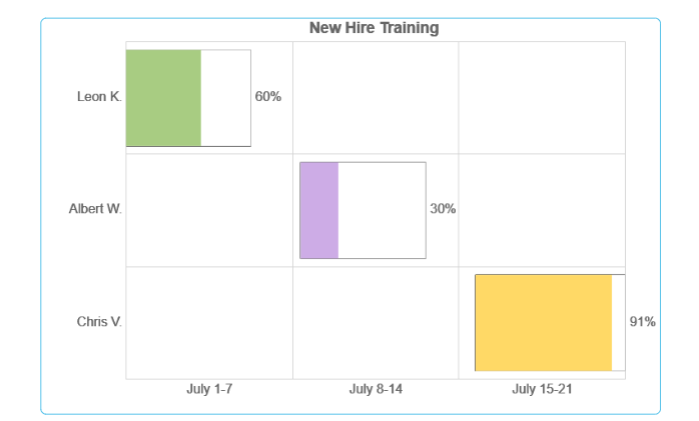
Gantt Charts are a type of horizontal bar graph used in managing projects and keeping track of time spent completing various parts of a project and the progress on each part. These charts can be easily implemented and configured as Diagram Tiles in the Decisions environment to show customized data from the project on a Page or Dashboard.
Example
This example demonstrates how to create a Gantt Chart that can be viewed from a Page or Dashboard.
Begin in a Designer Folder, and select Create Report in the bottom action panel.
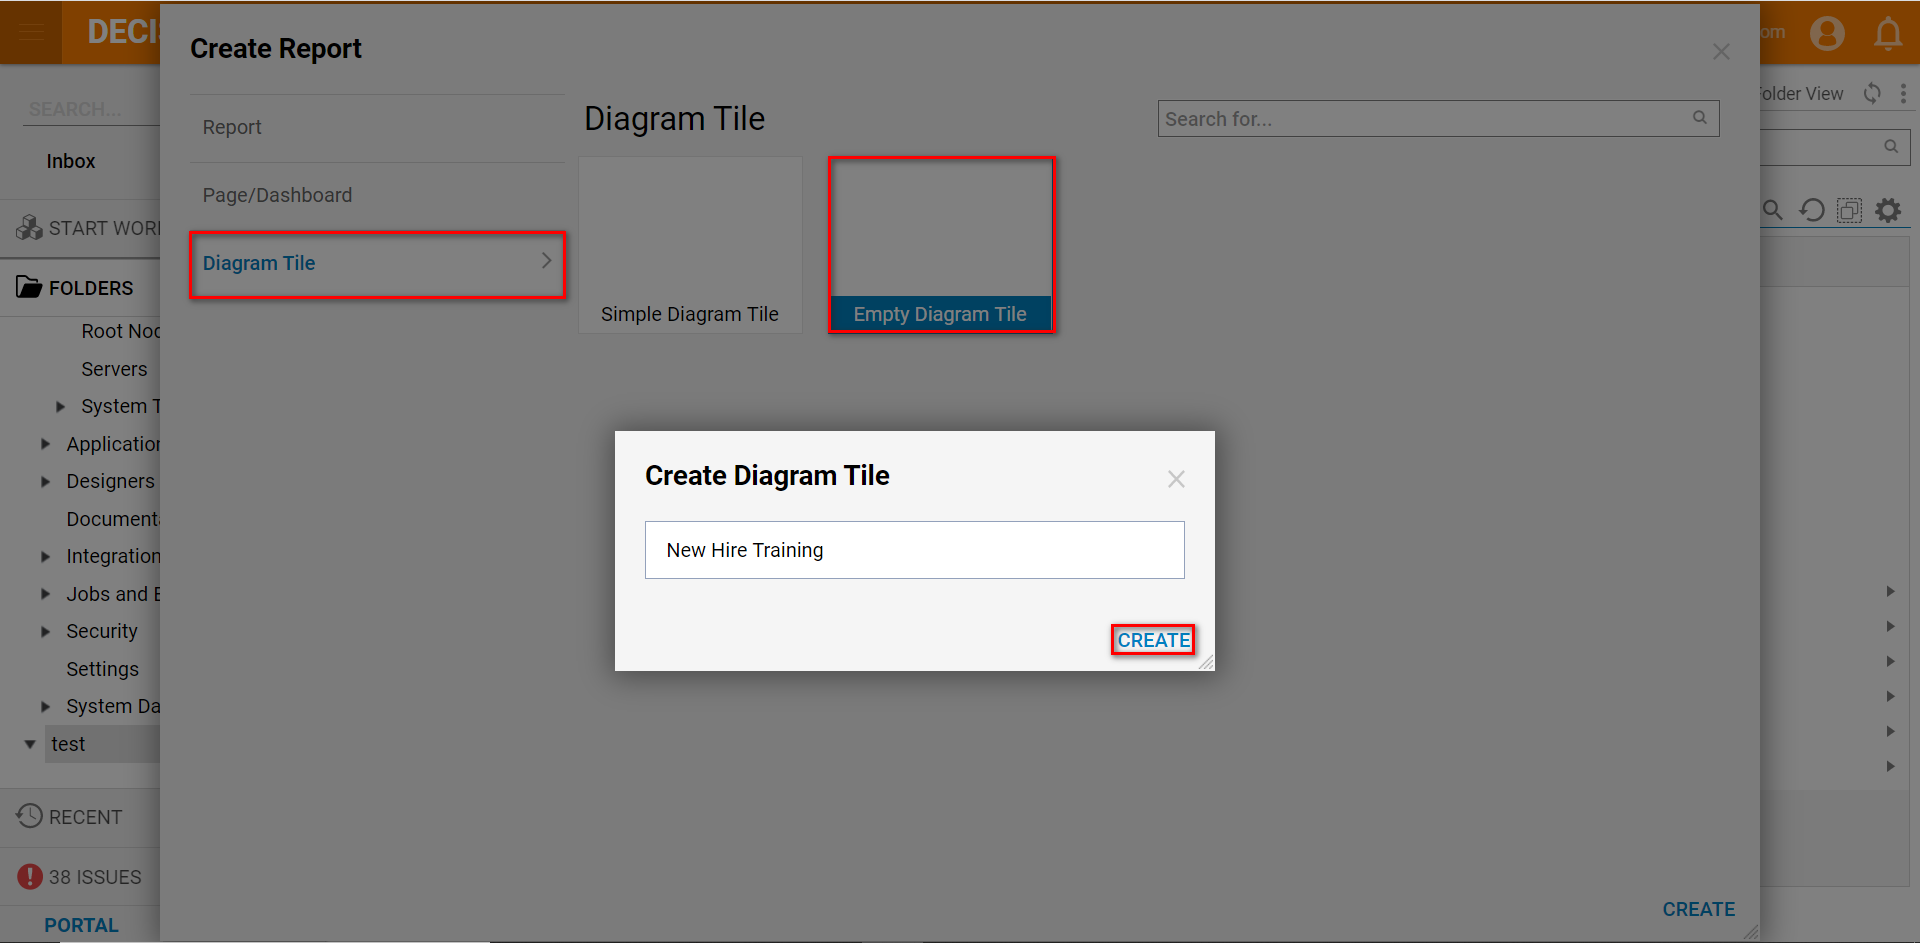
Select Empty Diagram Tile. Name the Diagram Tile and select Create.
Next, add a Gantt Chart to the diagram tile. Do this by navigating the Steps tab on the right and going to Charts > Gantt. Drag and drop the chart into the designer.
.png)
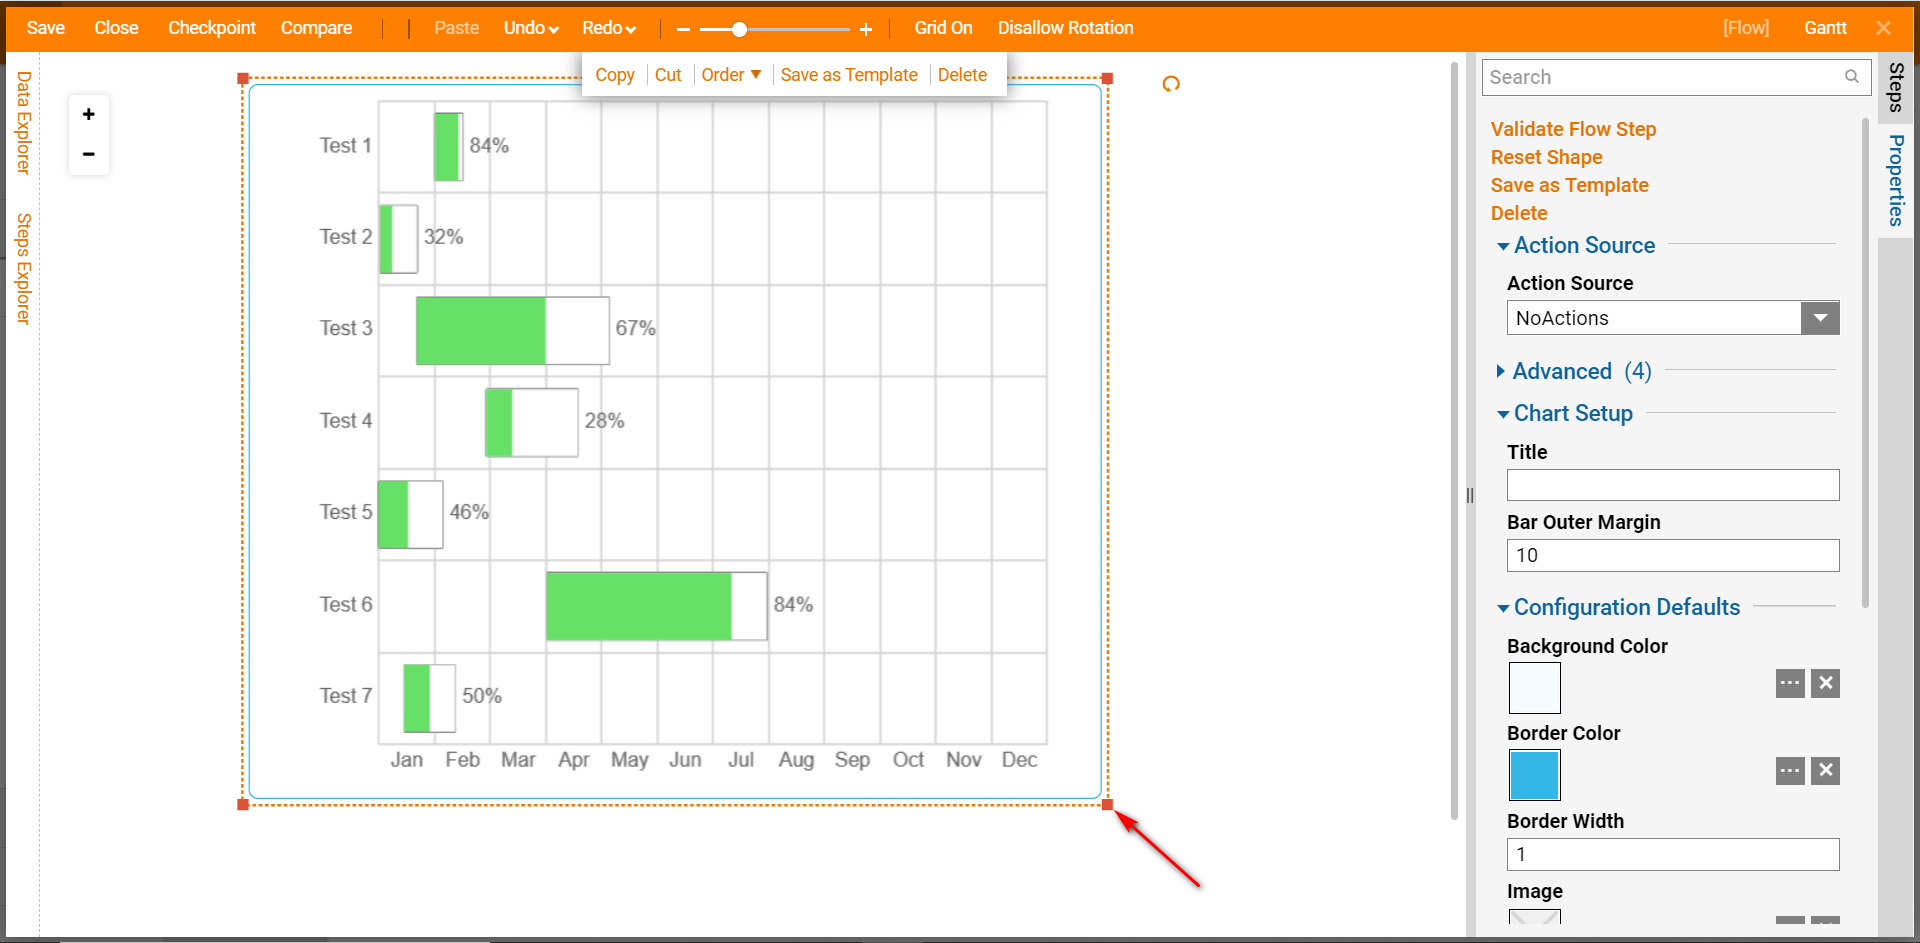
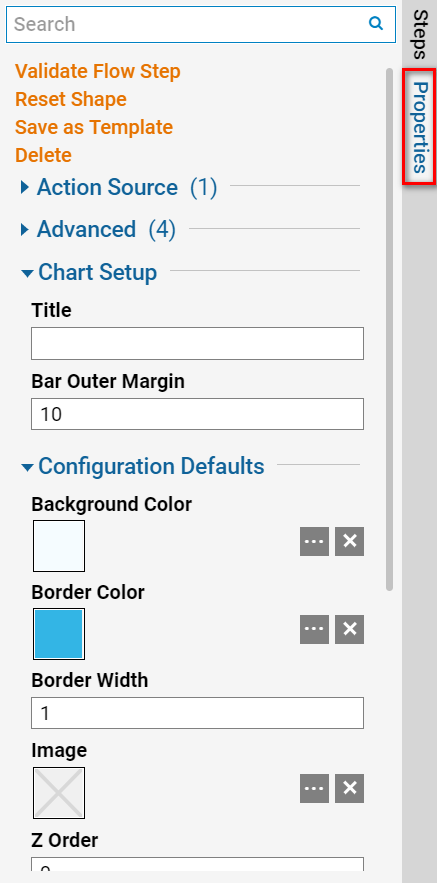
To configure the various aspects of the chart, select the Properties tab for the Gantt Chart. This tab provides options to alter the chart style, name the chart, and configure data inputs.
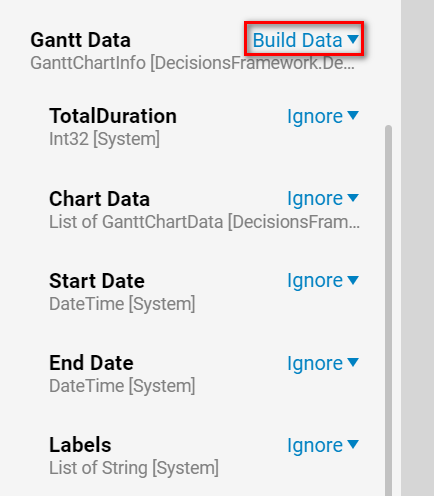
Given that Gantt Data is a composite data type, it is necessary to use a Build Data mapping to expose the multiple elements of the data type. These elements allow the user to set the various parameters that are visible in the chart.
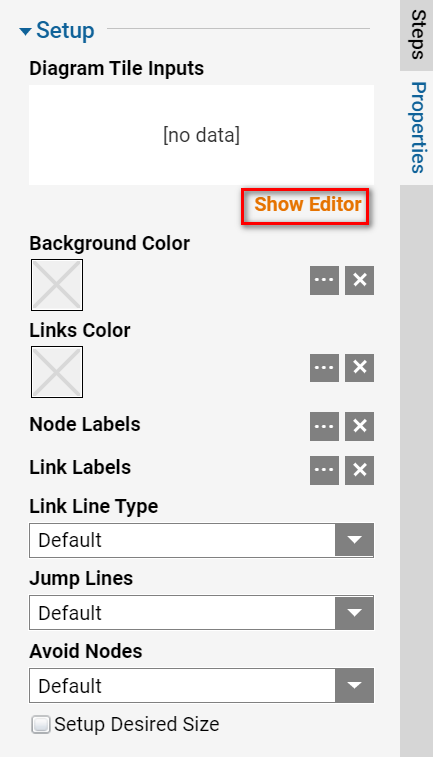
Next, click off the Gantt Chart and select the Diagram Tile Properties tab. Under Diagram Tile Inputs, select Show Editor. This provides the Gantt Chart with inputs to populate the chart.
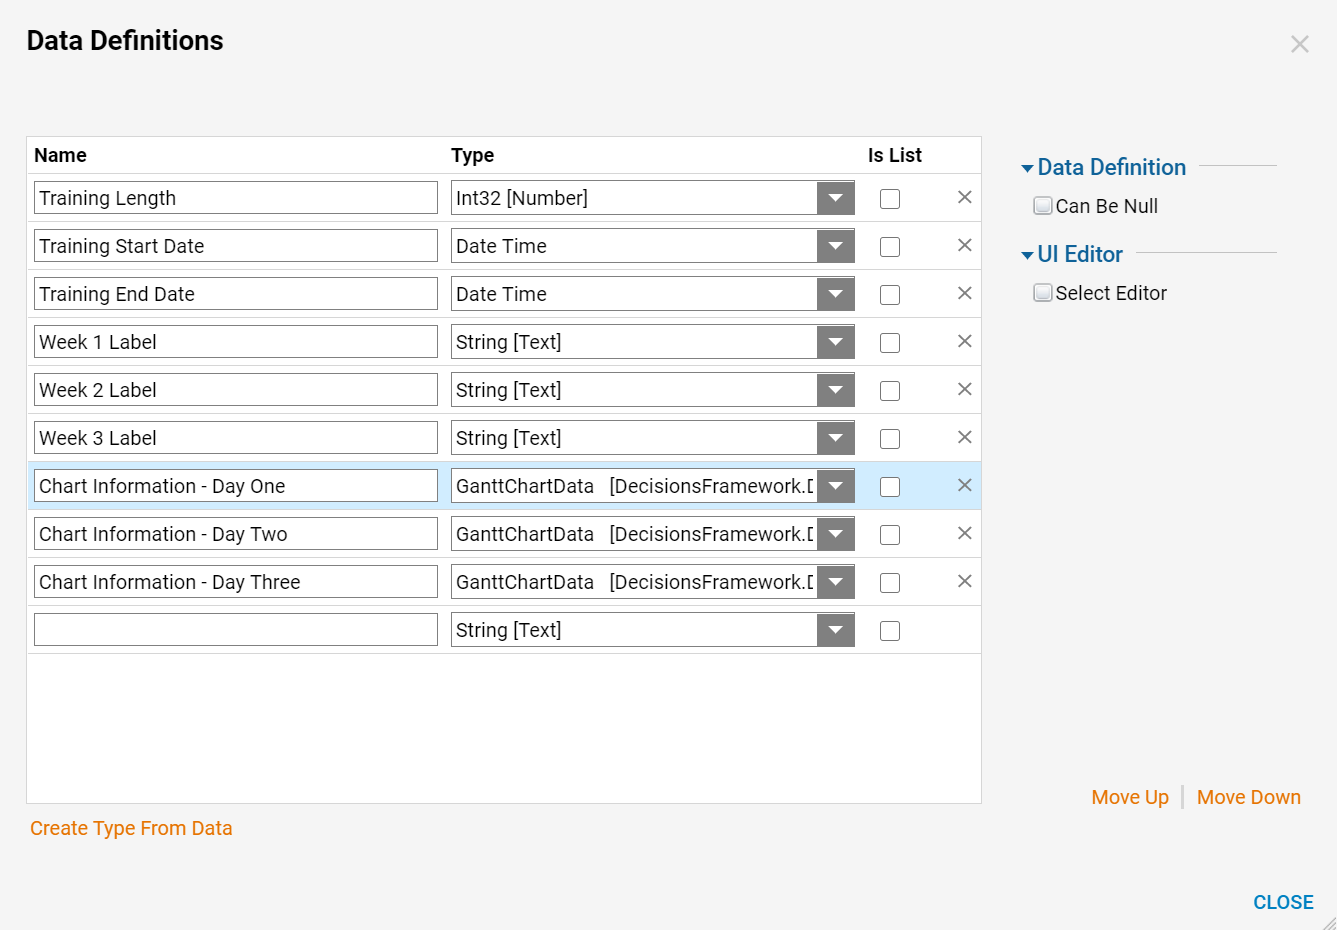
Create three labels (String) to denote the time frame of the chart as well as chart information (GanntChartData) for each training day. Finally, create data fields for the training start date, end date (Date Time), and duration (Int32). 'Close' to save definitions and close the panel.
Select the Gantt Chart and scroll down to the step inputs in the Properties tab on the right. Under Gantt Data select the Build Data mapping from the drop-down, then Build Array on Chart Data. This is necessary to expose the various properties of Chart Data, as the data itself is a composite data type. Add the desired number of inputs to represent each Test and Build Data for each one. Then, Constant Map data relating to each value of the Chart Data, beginning with 'Duration'.
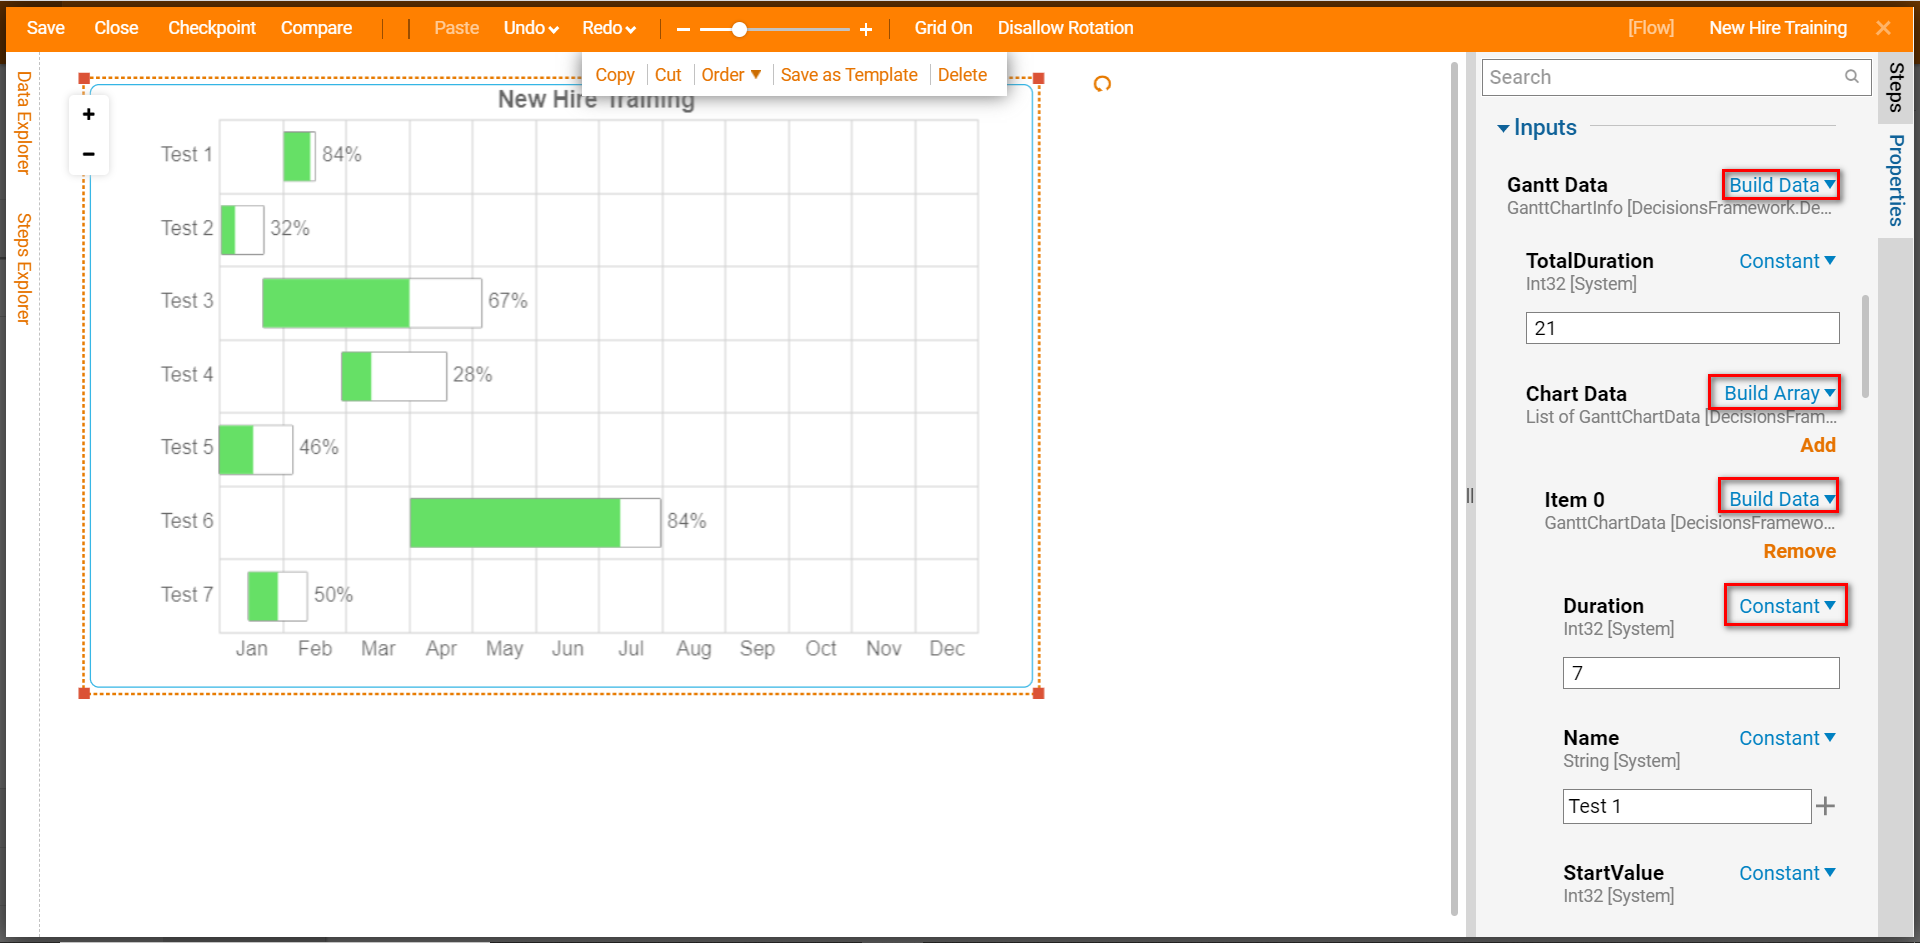
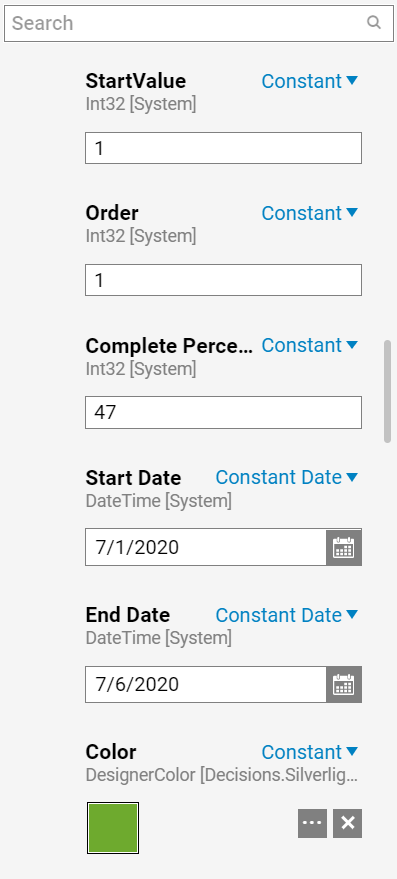
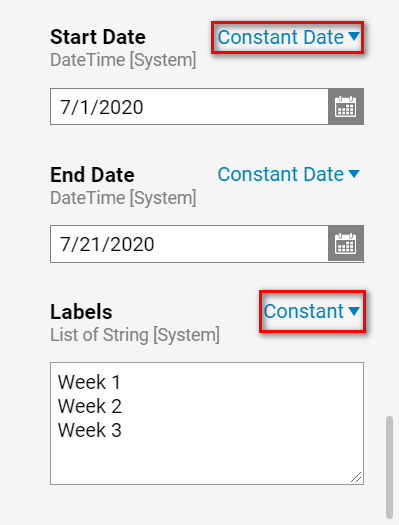
After mapping these values, 'Constant' map the desired dates to represent the beginning and end values of the chart.
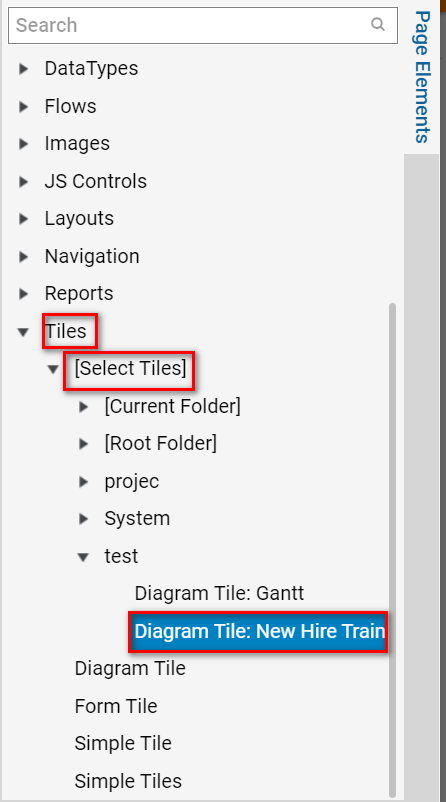
'Save' and 'Close' the form Designer, then navigate to the page that will display the Gantt Chart; then, drag and drop the Gantt Chart from Tiles > Select Tiles > [Name of Designer Folder] from the Page Elements tab on the right.

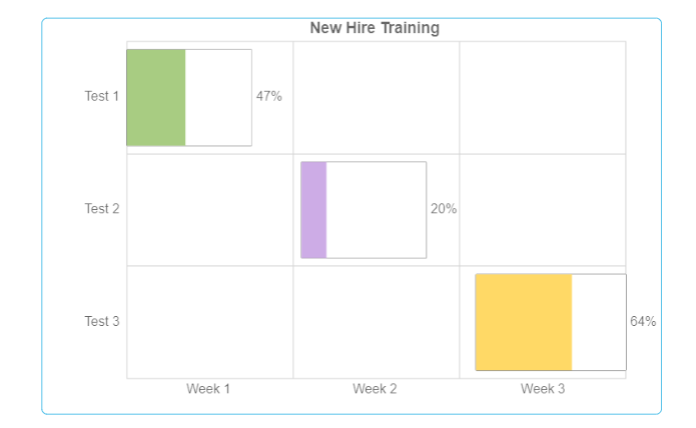
Dragging in this Tile will display the Gantt Chart with the newly configured static data values on the page.
To dynamically populate a Gantt Chart, begin by selecting the Diagram Tile and click on the Properties tab on the right-hand side. Under Diagram Tile, find the Input Data Flow and select Edit.
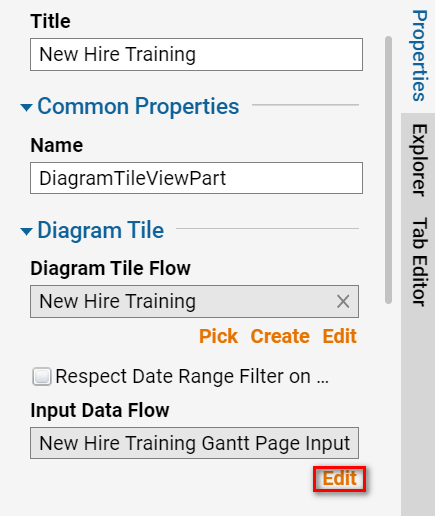
This Input Data Flow functions to output data to the Gantt Chart's input data. The output data is defined in the End step of the Flow.
To create these definitions, utilize a series of Create Data steps with Fetch Entities steps to pull and filter out specific criteria. Then, select the End step and from the Properties tab, map the Outputs via the Edit Input Mappings or Show Editor button.
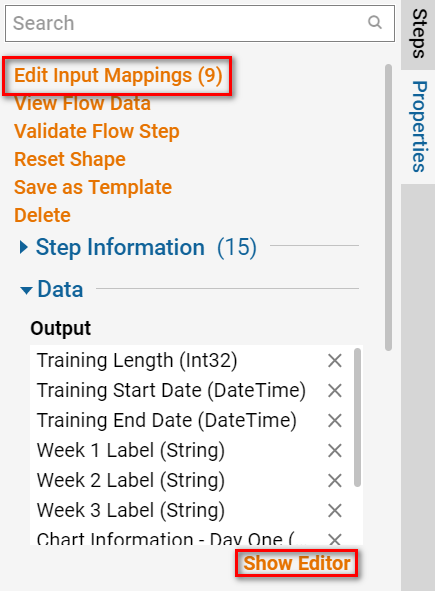
Save and close this Flow. Now, when navigating to the dashboard see the Gantt Chart is being populated with information pertaining to the project's progress.
