Overview
Within a Report, Series are sets of data made from the subtotals of grouped data fields within that report. When more than one set of data has been grouped, a Multi-Series can be used on certain views of the Report. This data can then be added to a Multi-Series Chart that will display the subtotals of multiple data fields within the chart type that is selected. This is best used when visual representation is needed for multiple pieces of data that are related to a single object.
Not just any type of chart view can have multiple series. Multiple Series are available for Areas, Bars, Bubbles, Columns, Dots, Lines, and Stacked Bars.
Example
This tutorial demonstrates how to add Multiple Series to the Chart views on the Report.
In order to add multiple series to the chart view, several Report Subtotals should be defined.
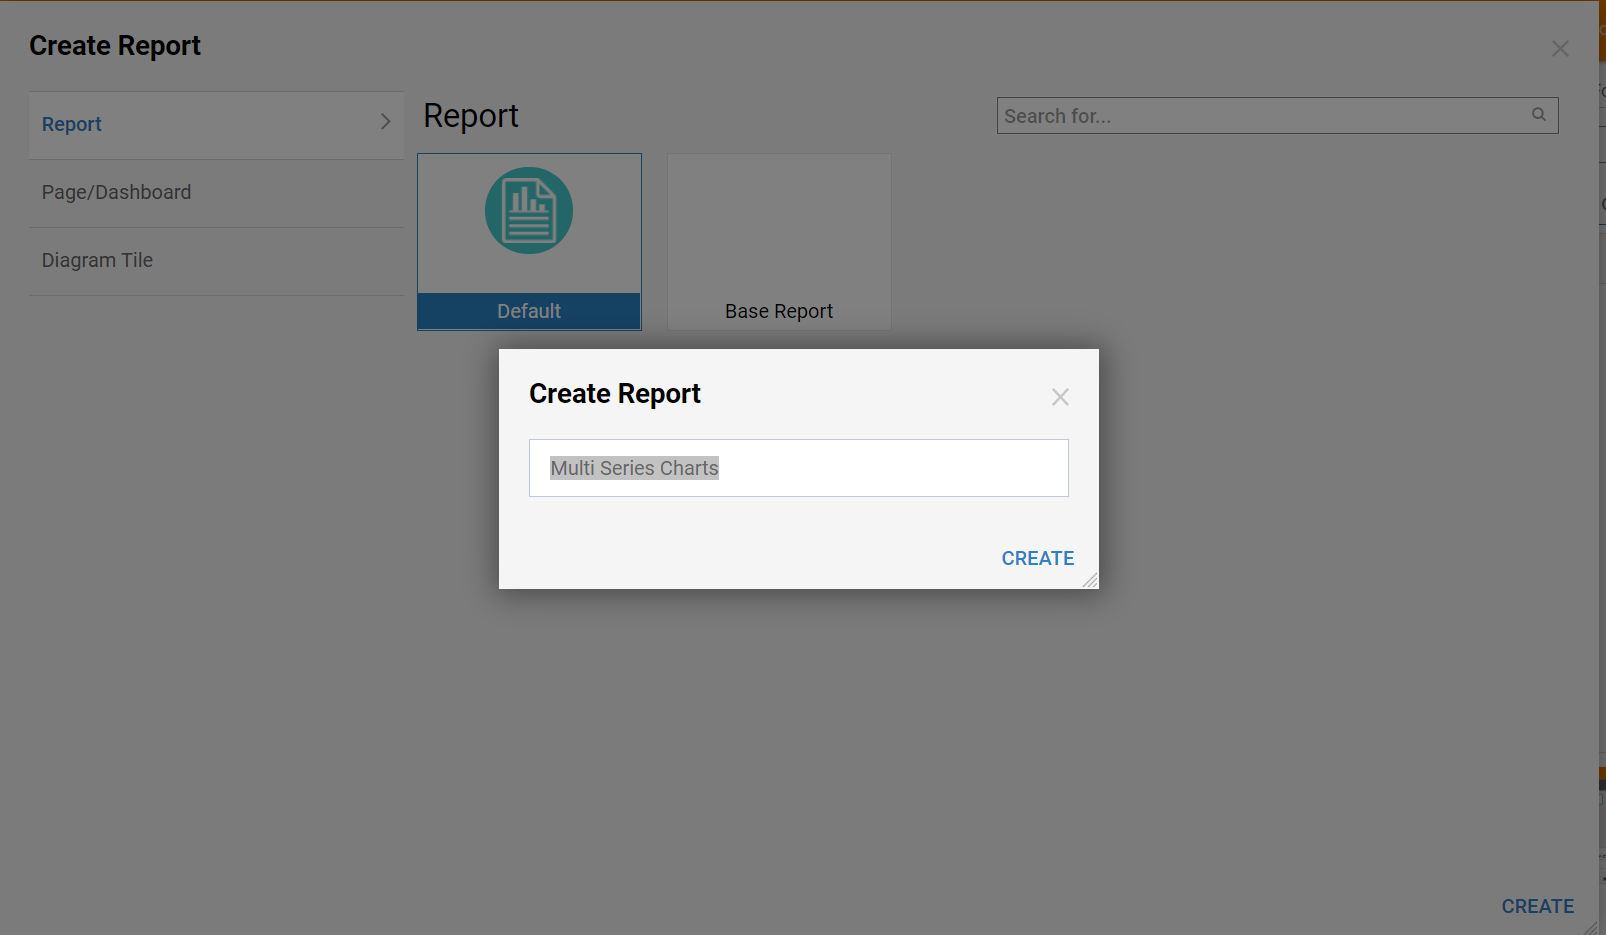
- Navigate to the Designer Folder and click Create Report > Create Report from Folder Actions Panel.
- In the resulting window, Name the Report and select Create to proceed to the Report Designer.
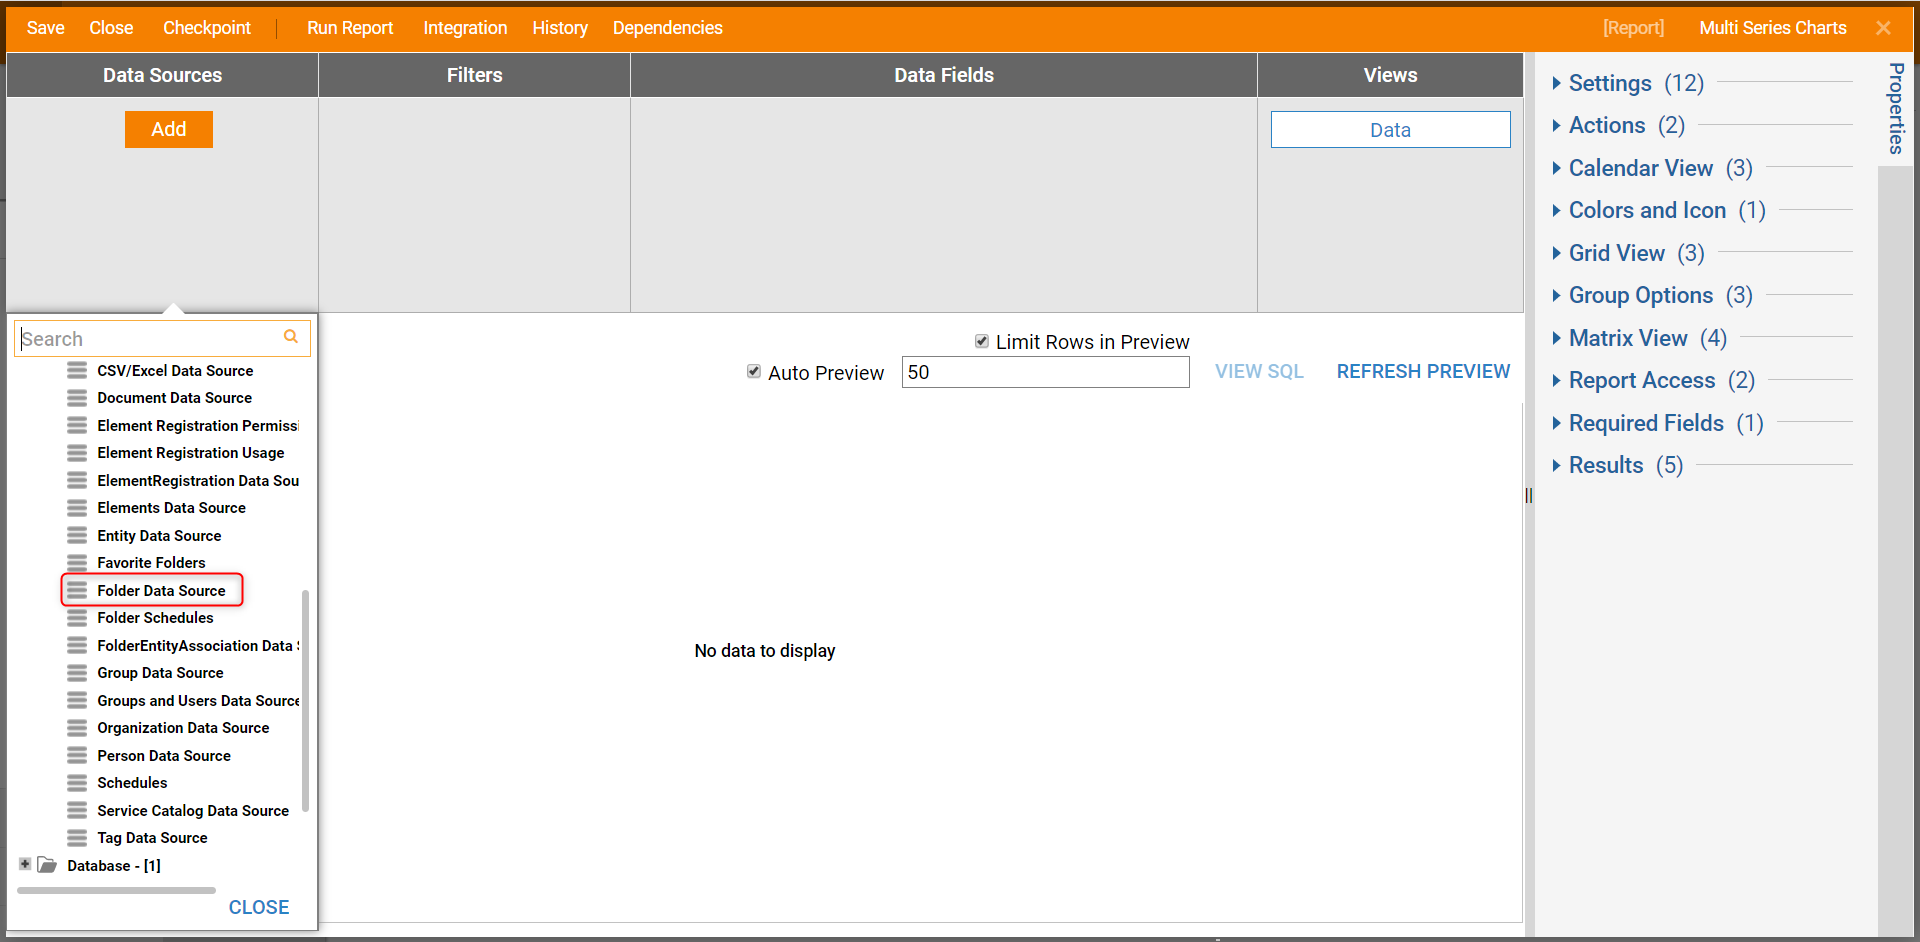
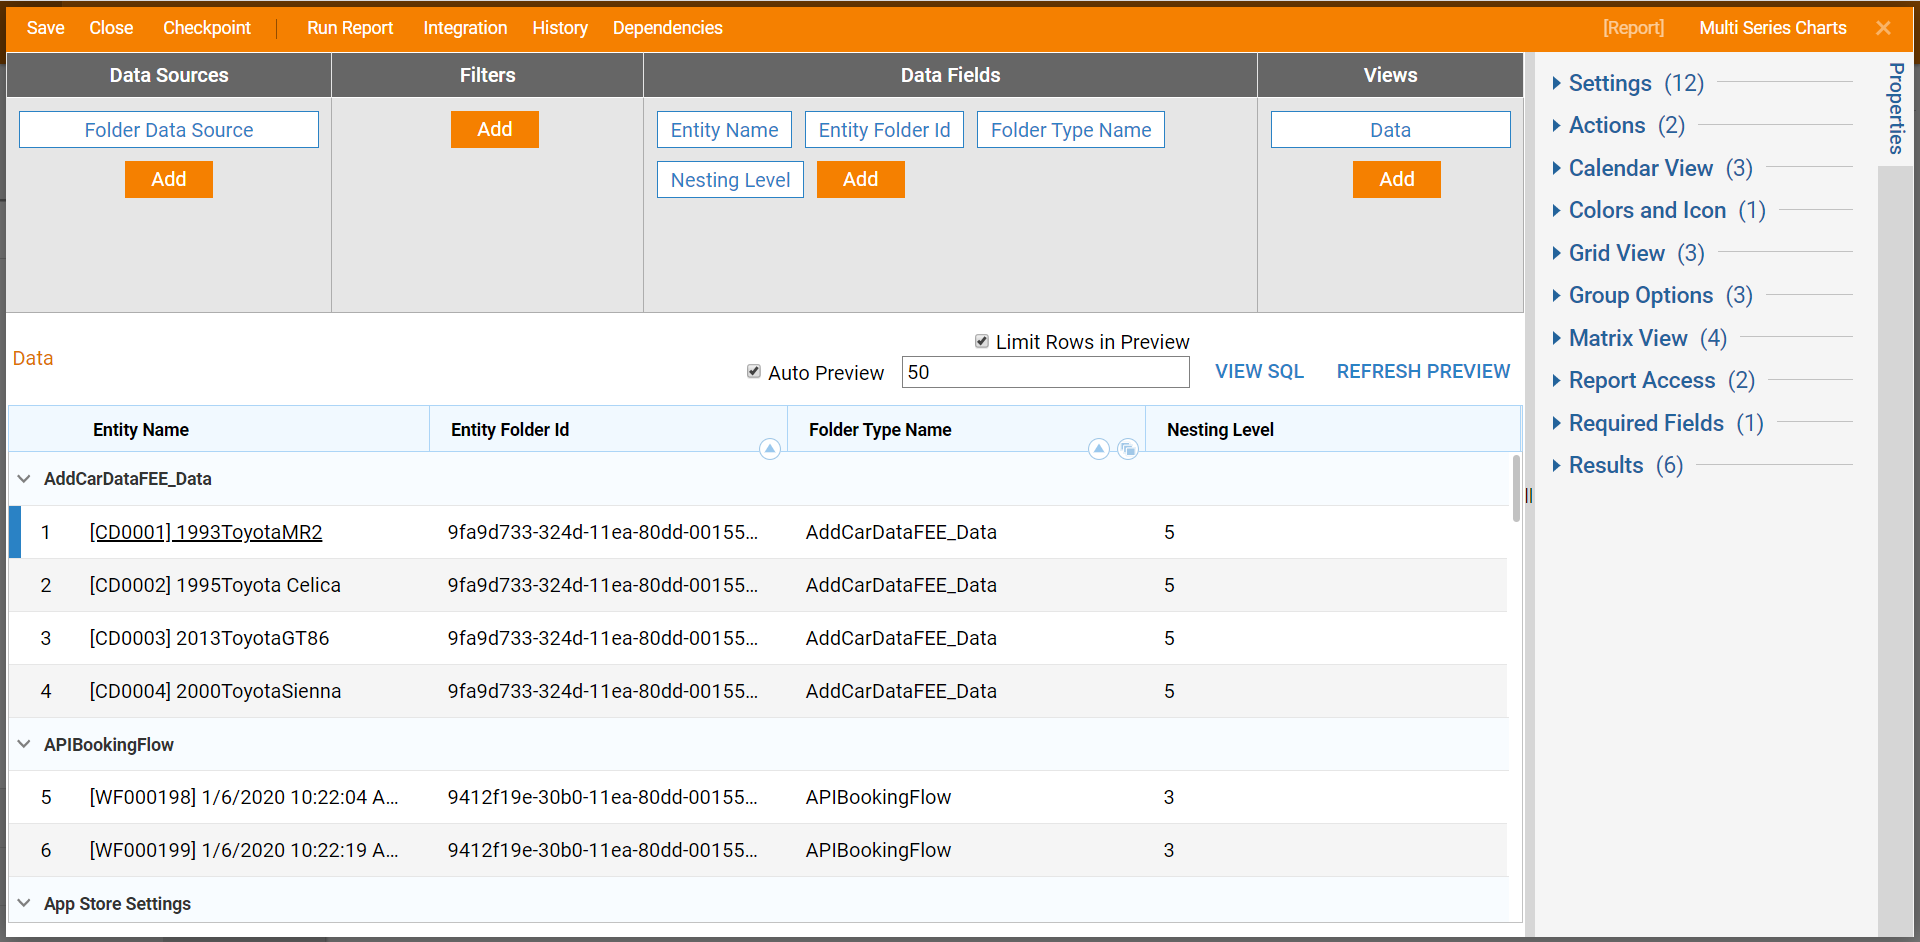
- In the Report Designer, add Data Sources for the Report.
- Expand Data Sources > Common > Folder Data Sources category.
- Next, add desirable Columns from the Data Source tables to populate the Report with data.
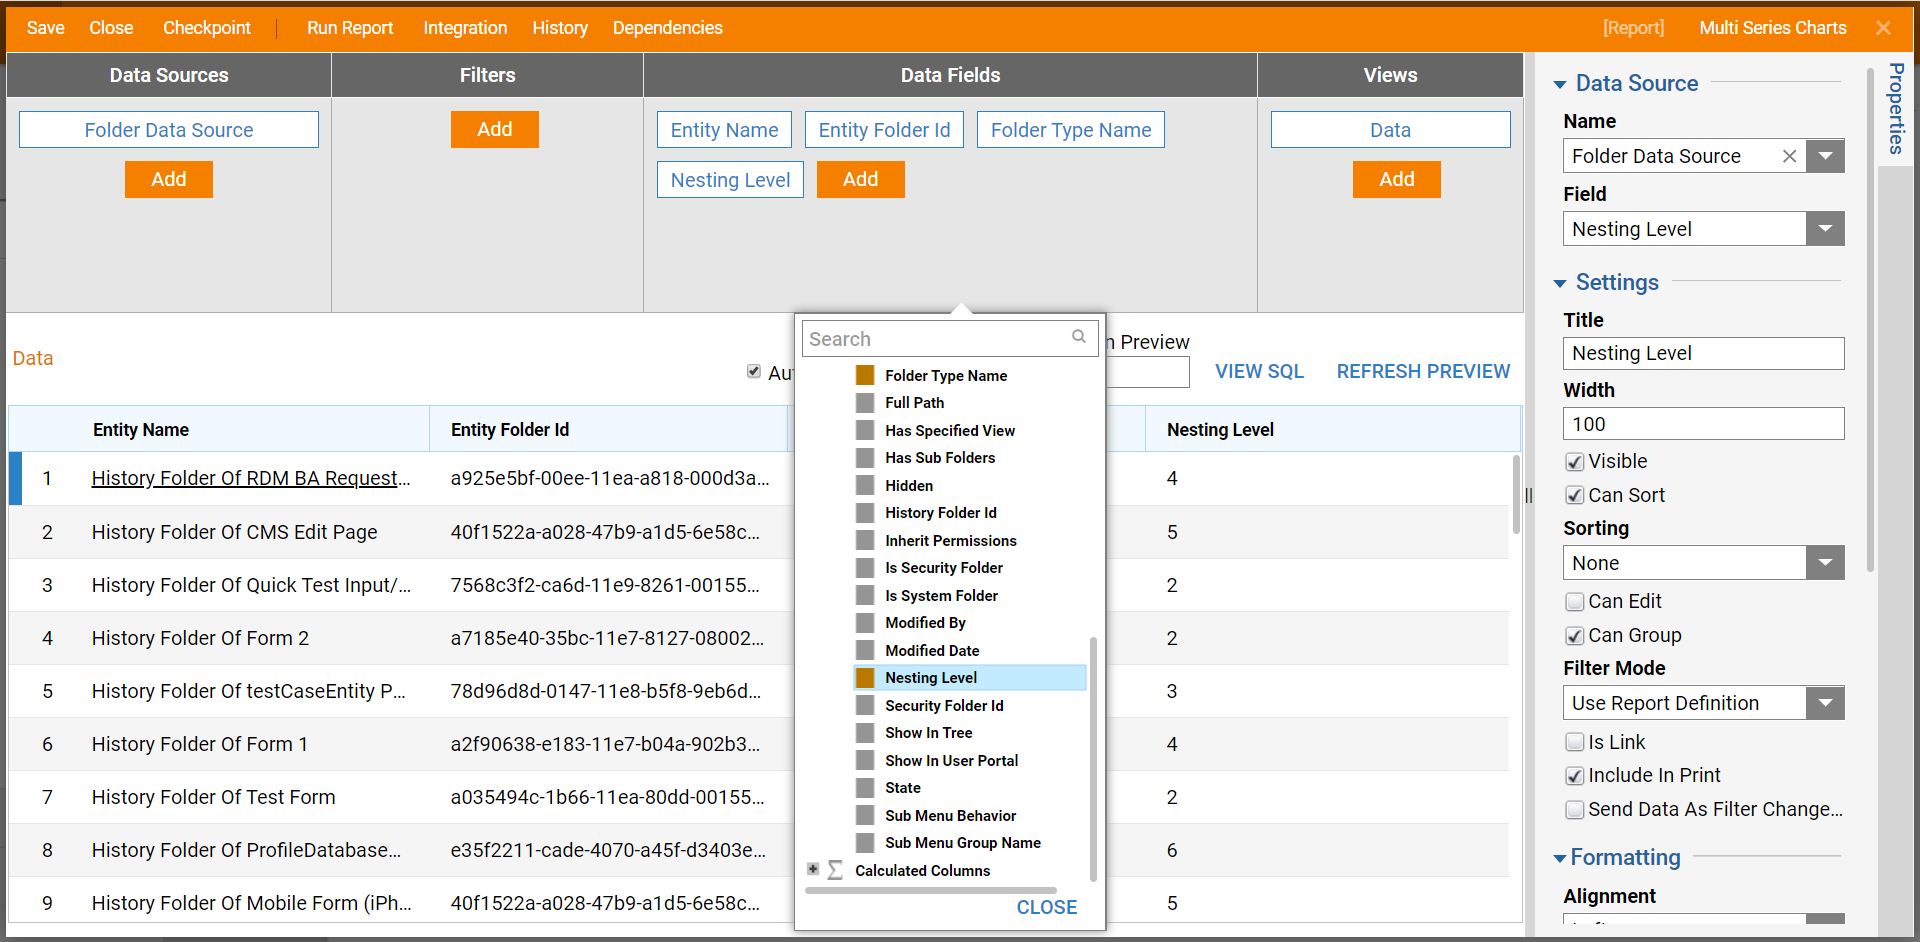
- Group the Report by Entity Folder ID and Folder Type Name.
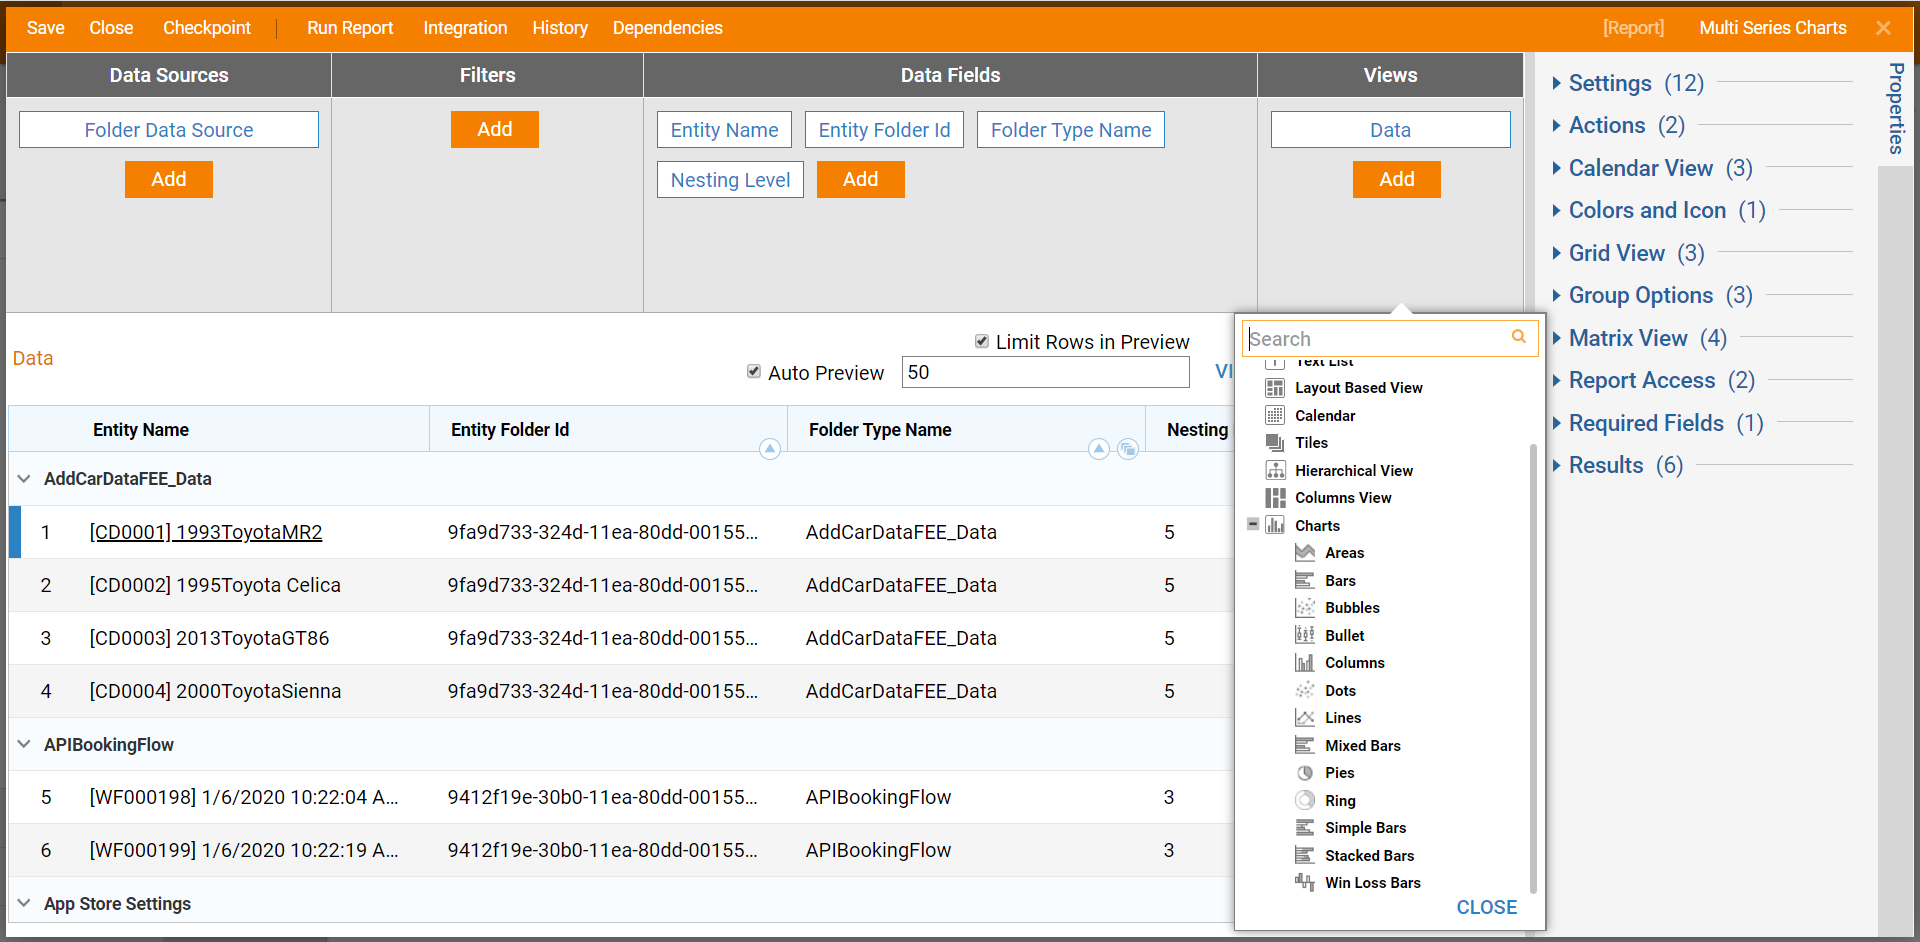
- In the Report Designer select View > Add button.
- Then, pick Bars type from Charts category.
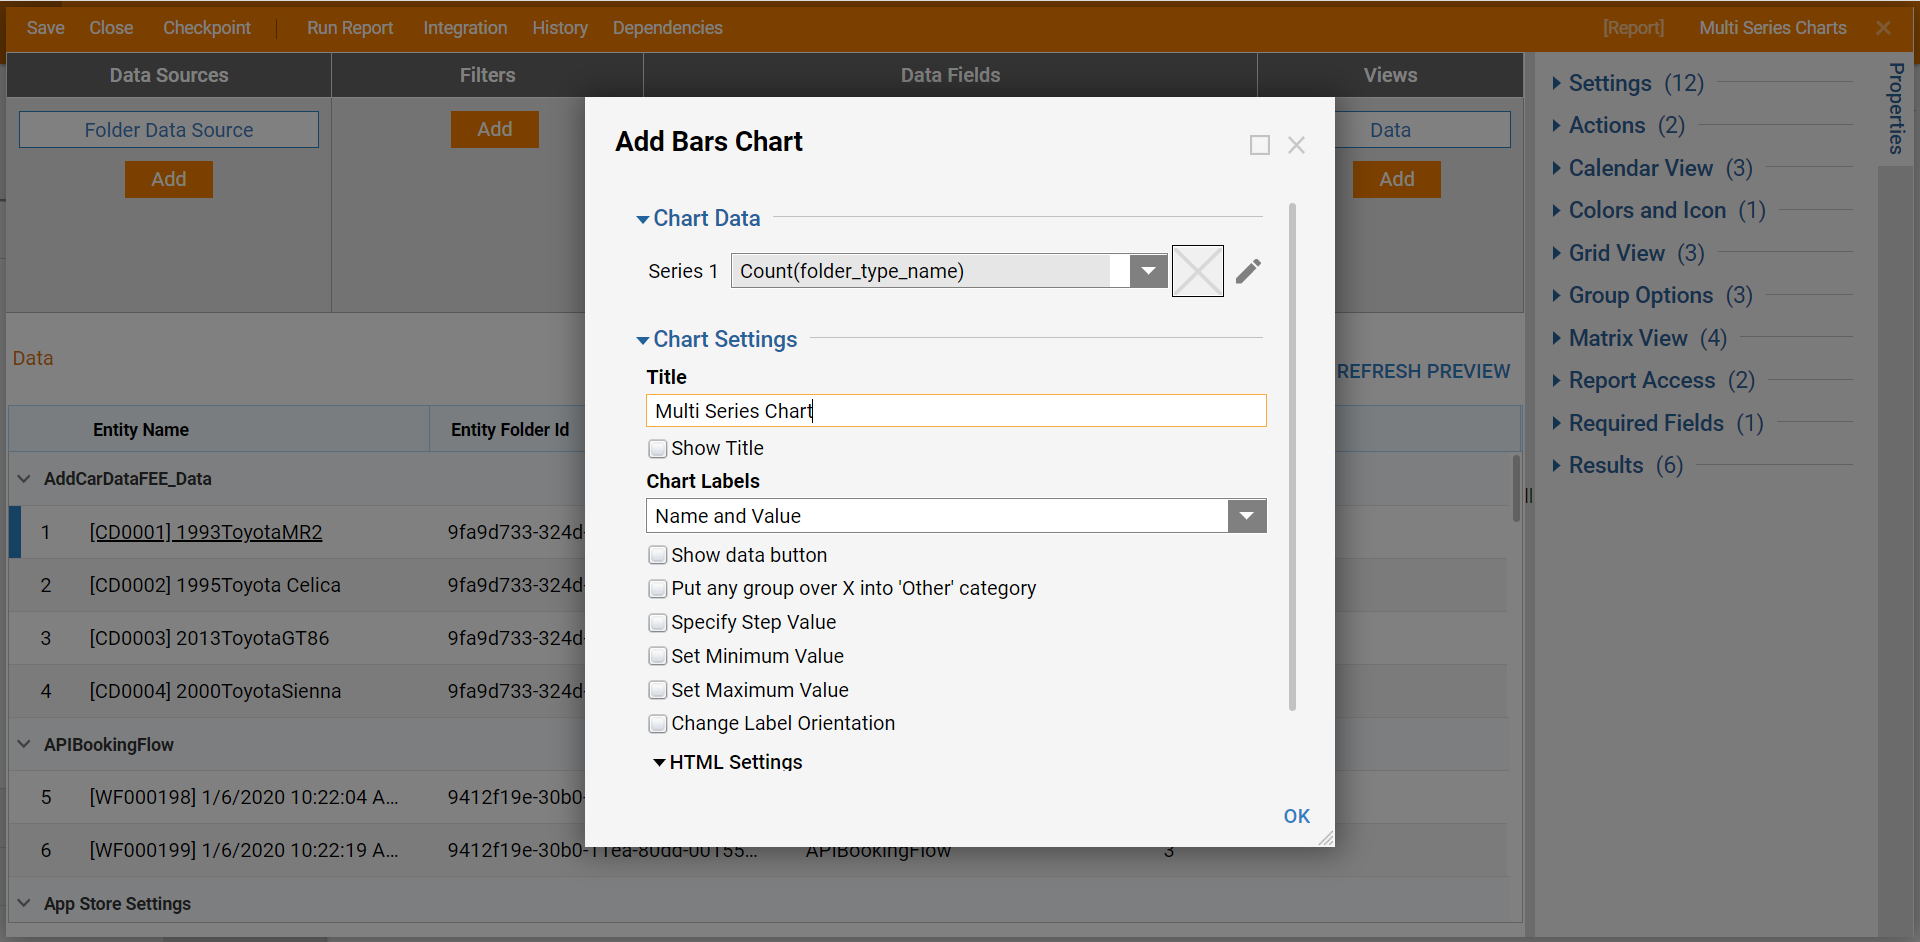
- In the Add Chart dialog, Name the Title.
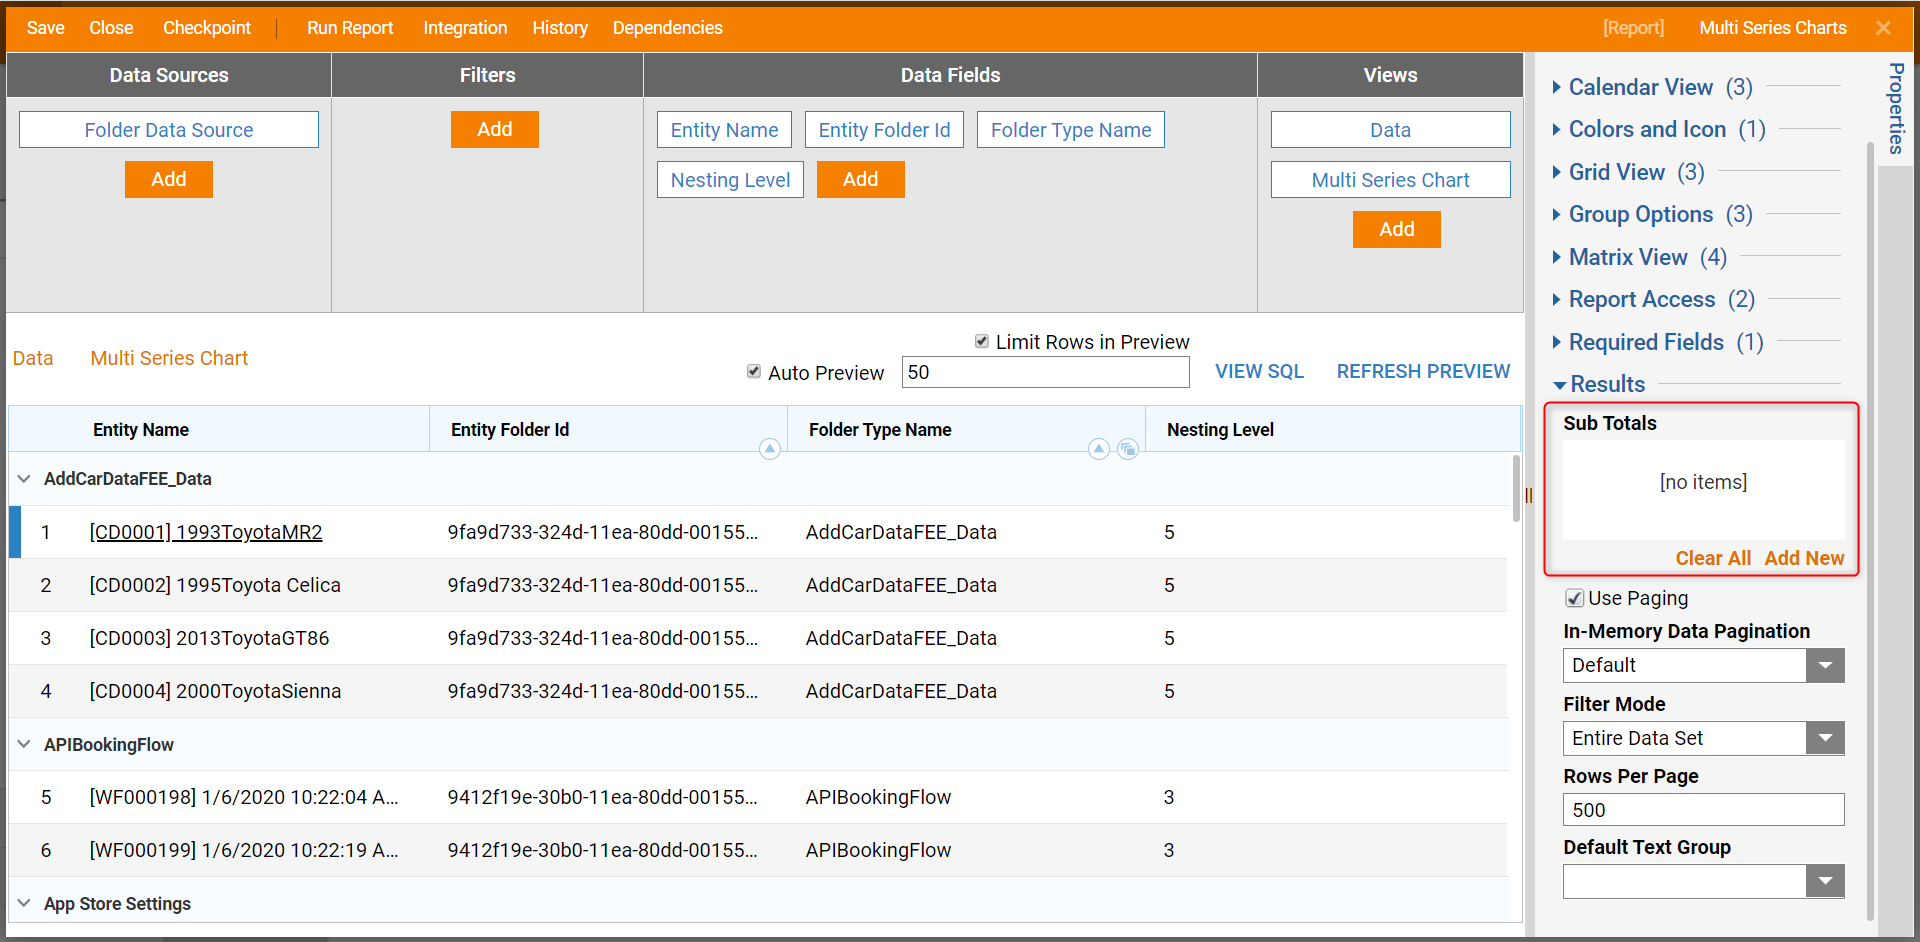
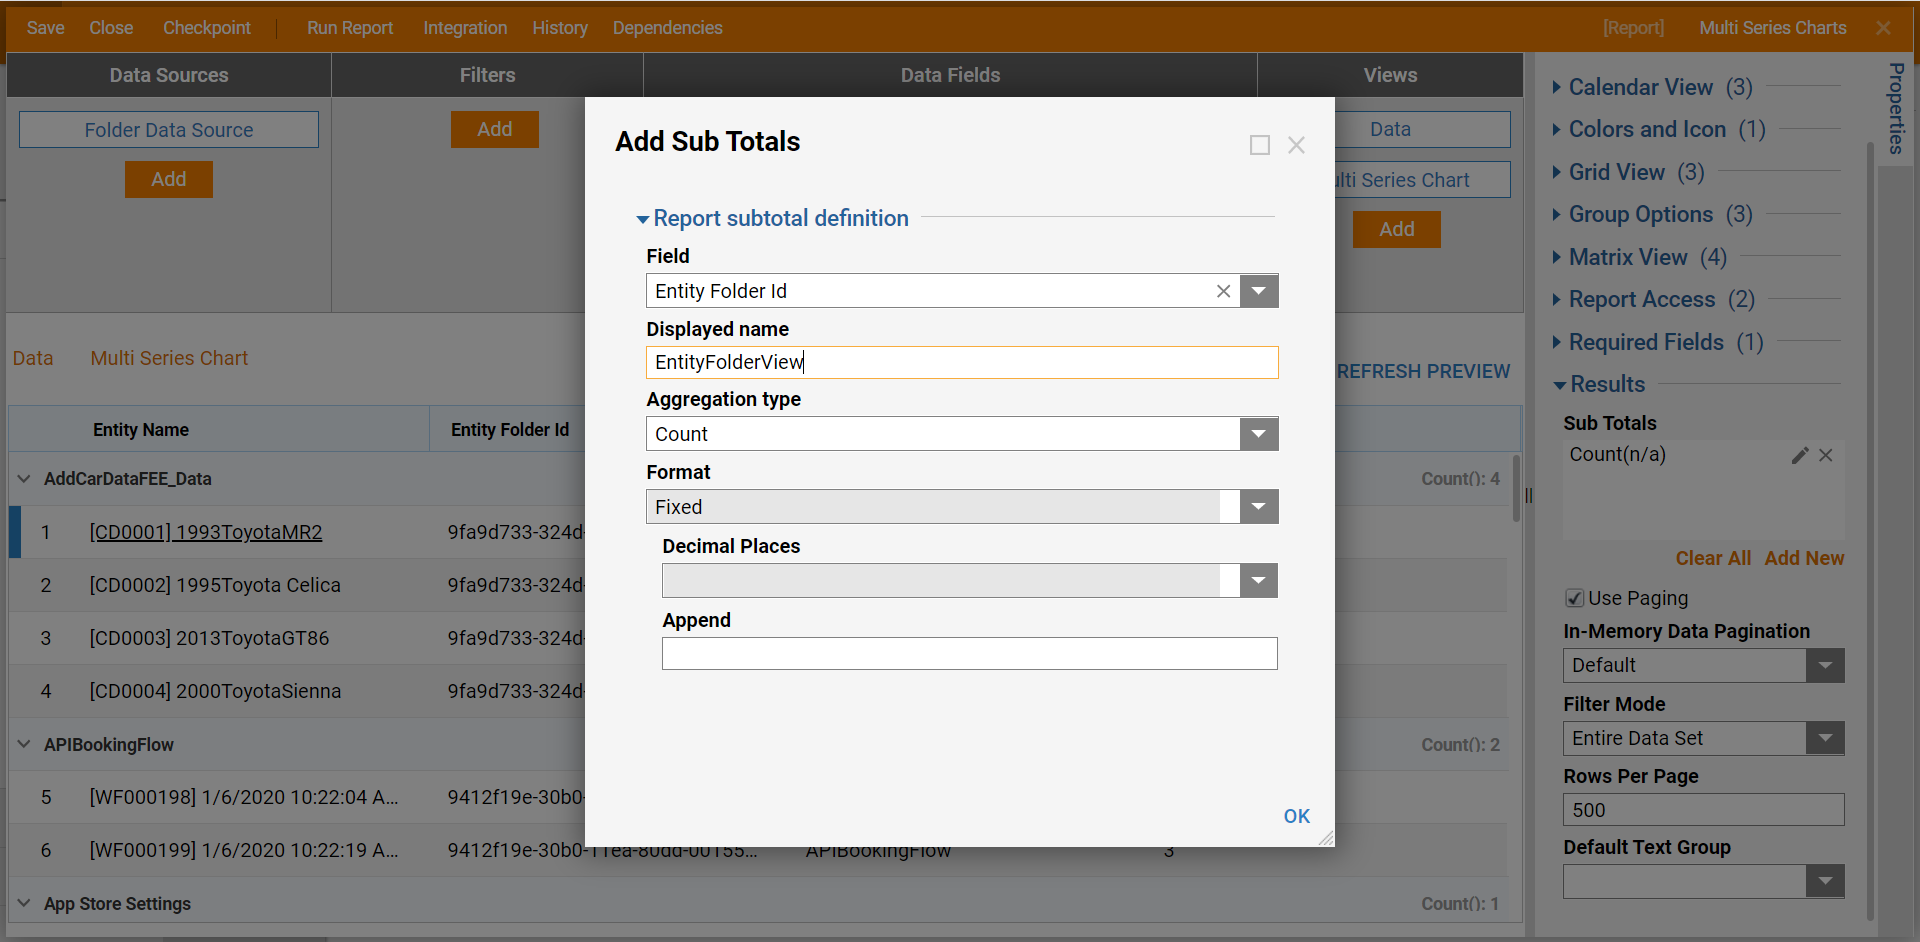
- Then, in the Report settings, locate the Results category and select Add New under Sub Totals text-box.
- In the Add Chart dialog, Name the View.
- Then, from the Field drop-down select Entity Folder ID. Then chose Count as the Aggregation Type.
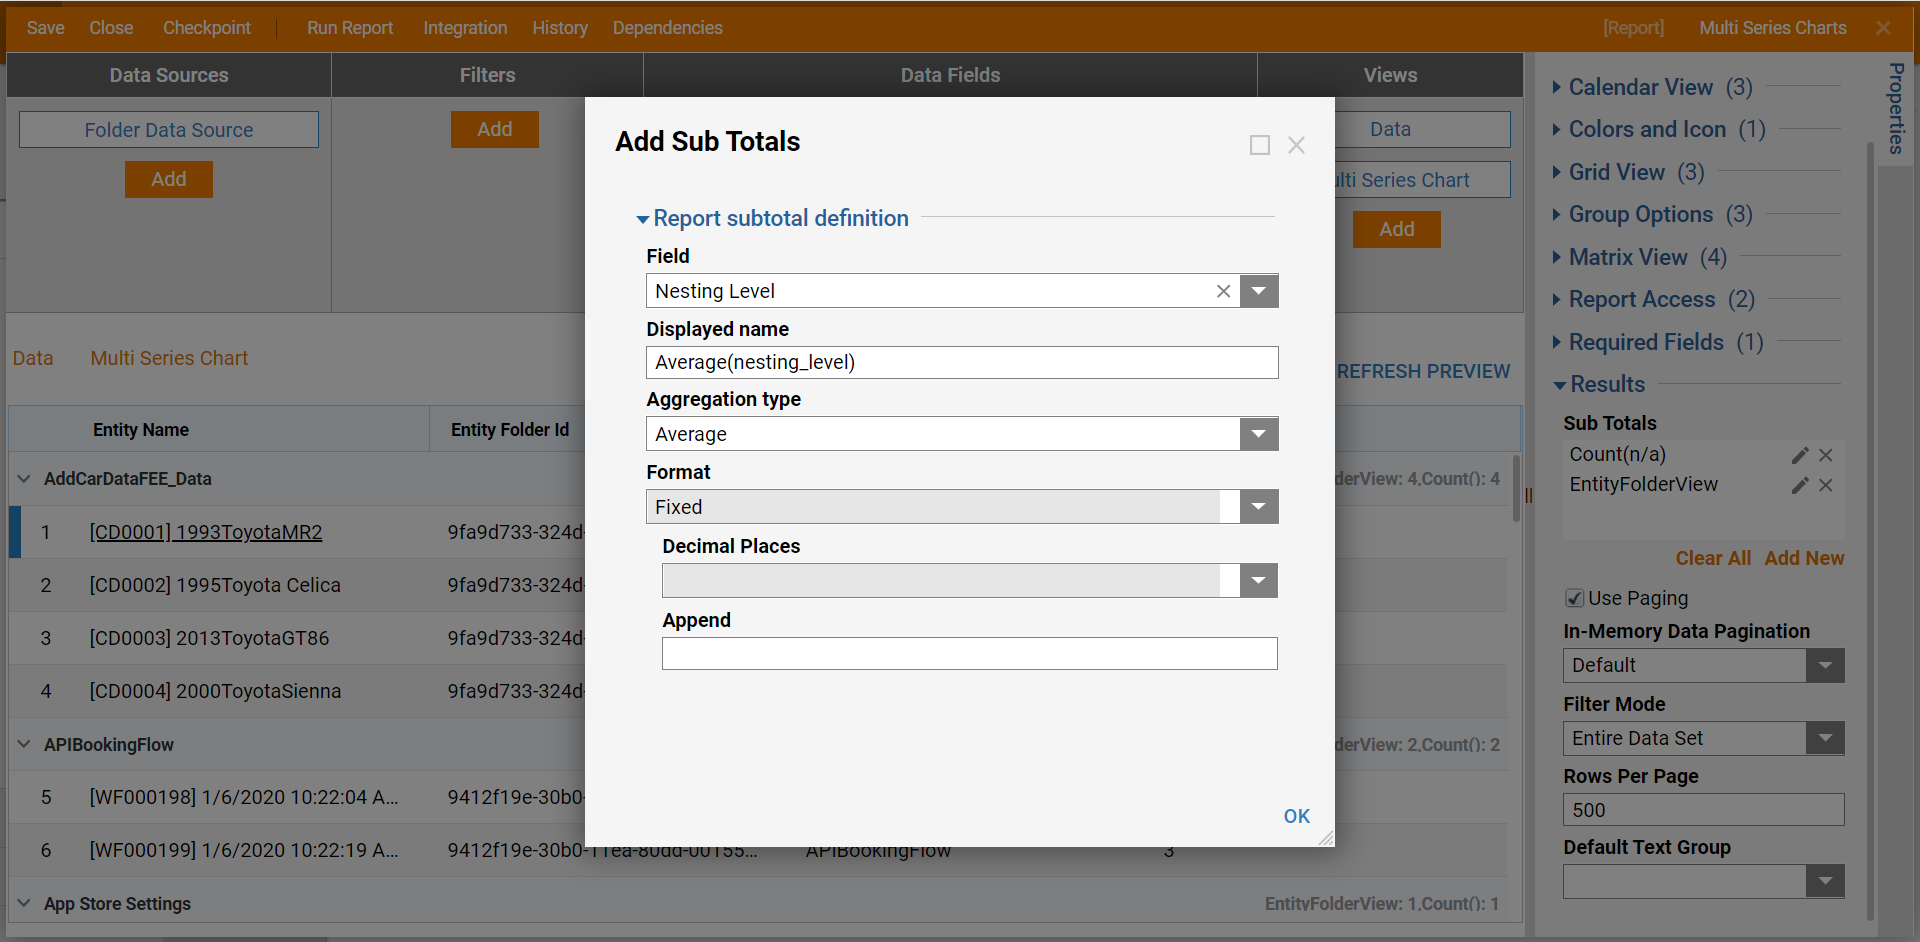
- Next, Add a second Sub Total.
- For the second Sub Total populate the Nesting Level field with the Average Aggregation type.
- In the Report Designer, select the Multi Series Chart button to view the bars chart that was added previously.
- Within the Properties section, under Chart Data add the two subtotals that were created earlier in this example. The Chart updates and shows the Multi-Series.