Overview
This document will demonstrate the tools and ways to troubleshoot DB connection response times. Reports that are sourced by queries from an external database can have slow data retrieval response times. Decisions has some diagnostic tools for users to troubleshoot SQL query calls and Report load times.
Example
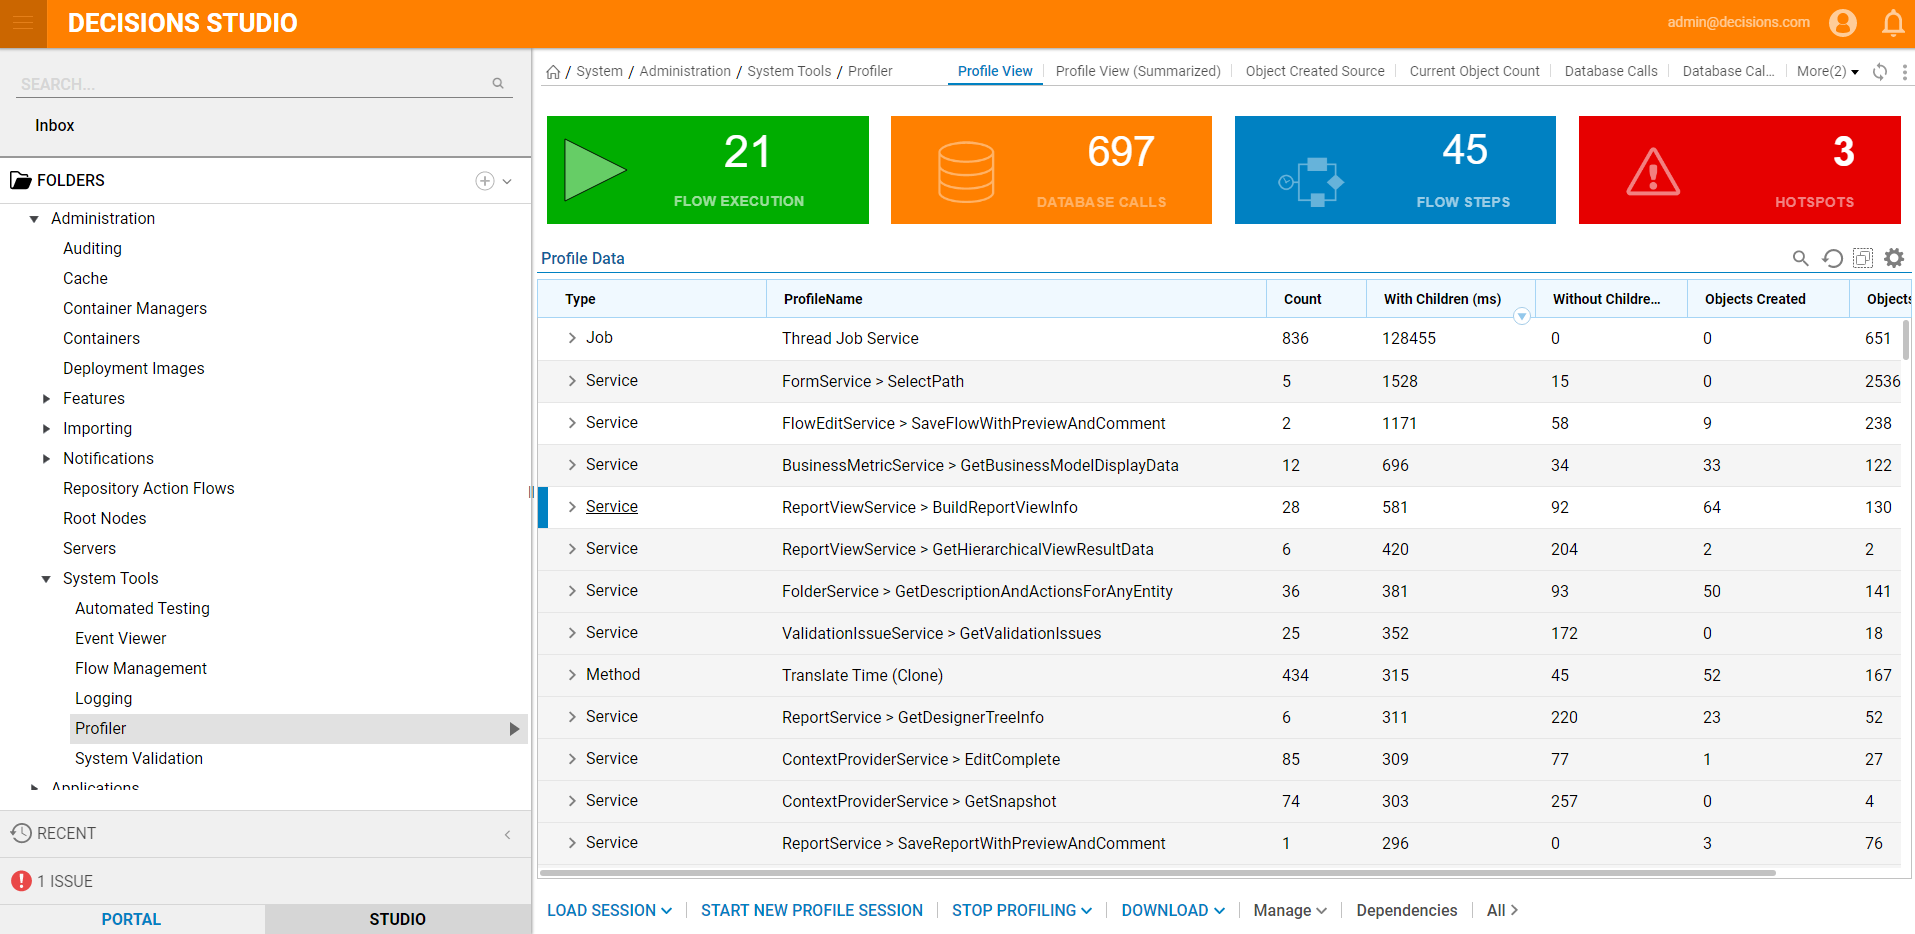
One of the main tools to accomplish this is the Profiler. This is located in System > Administration > System Tools > Profiler. For this example, an external database connection has been configured for Southwind DB. Data is retrieved from the database by a query and a Report displays the fetched information.
- Navigate to any Dashboard and then return to the Profiler.
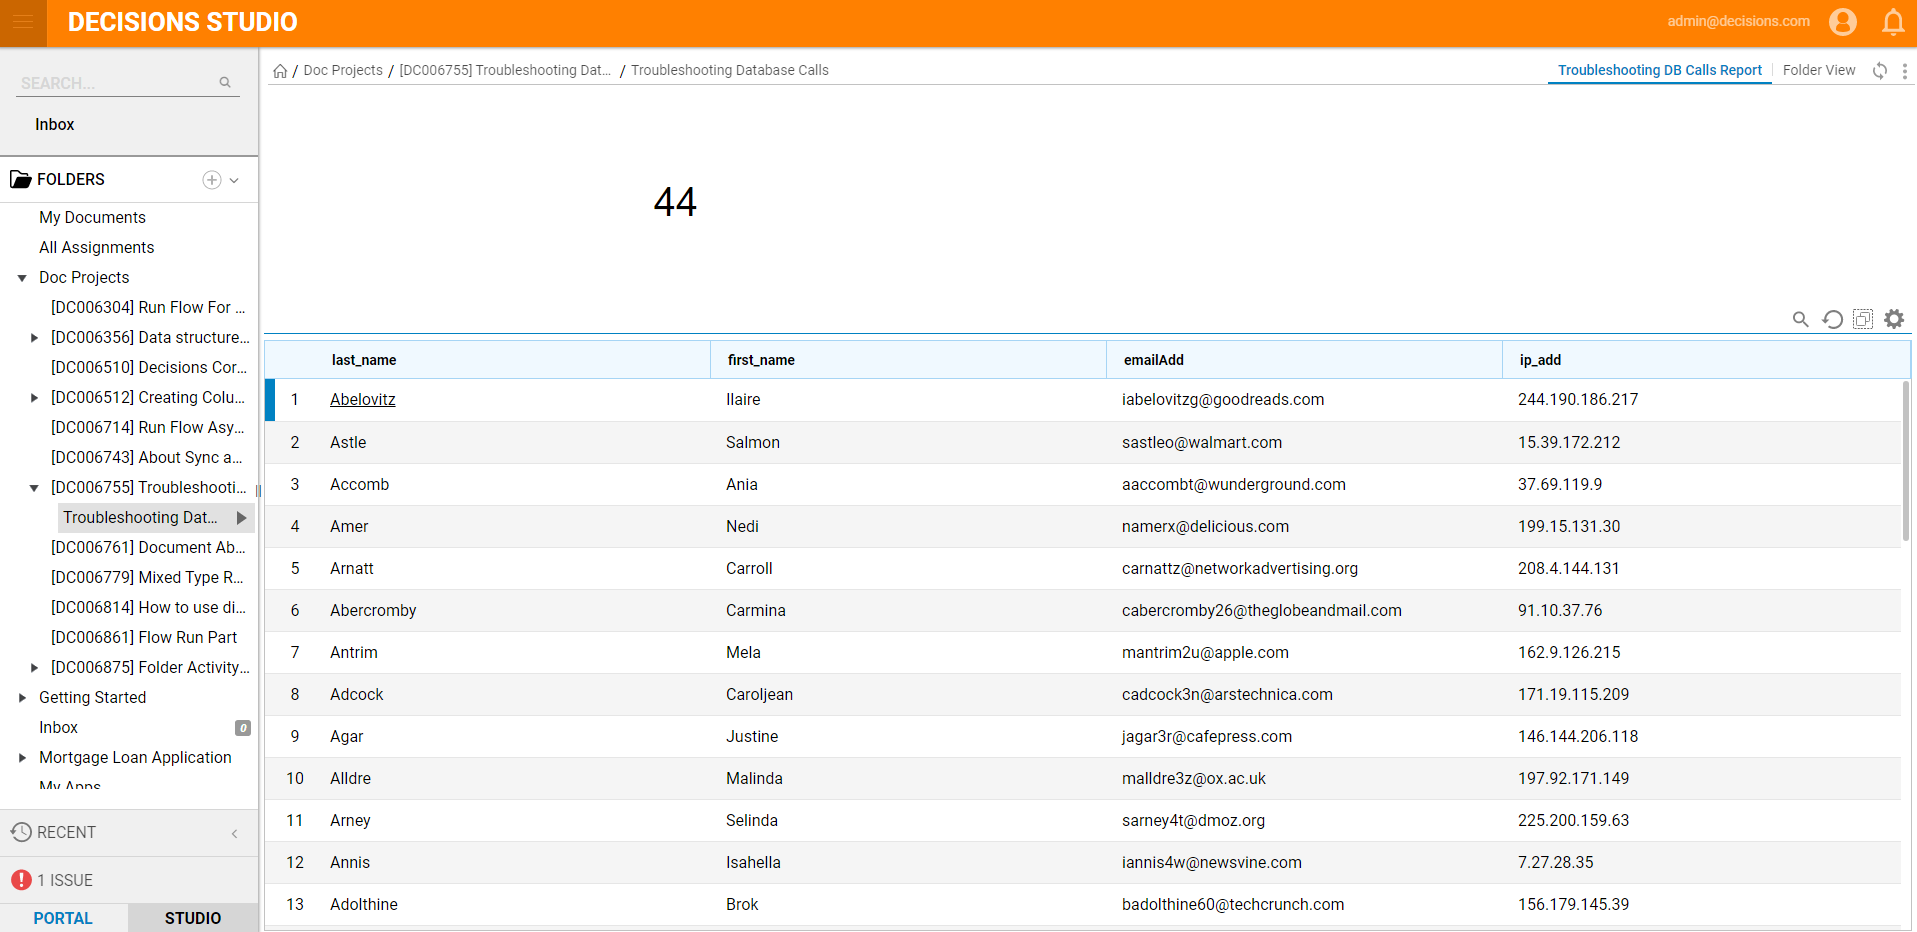
- When this report has been refreshed, the Profiler will capture the query response time.
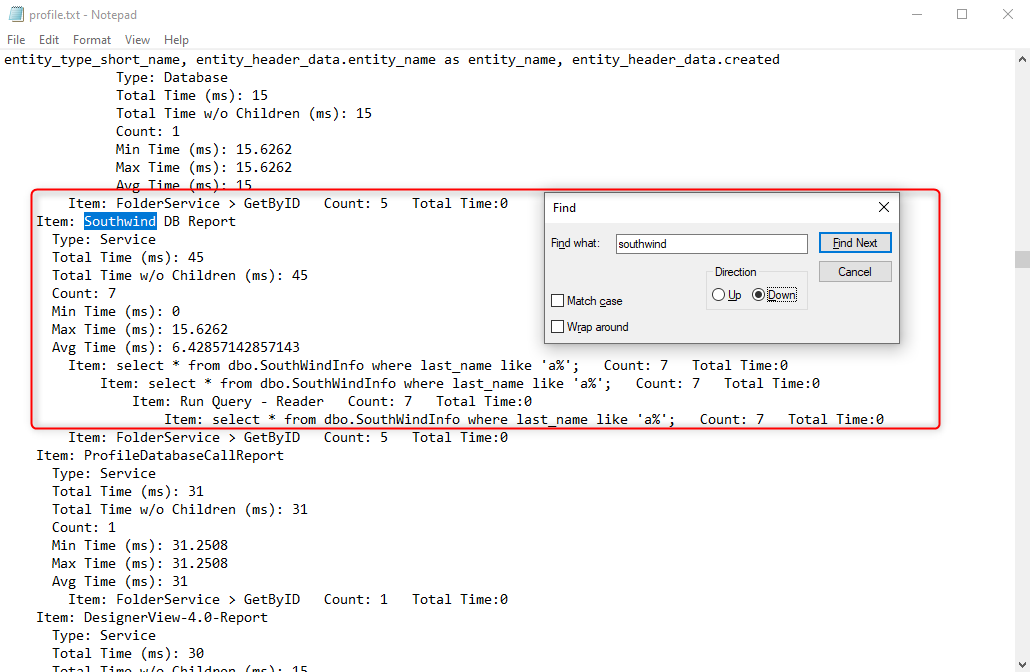
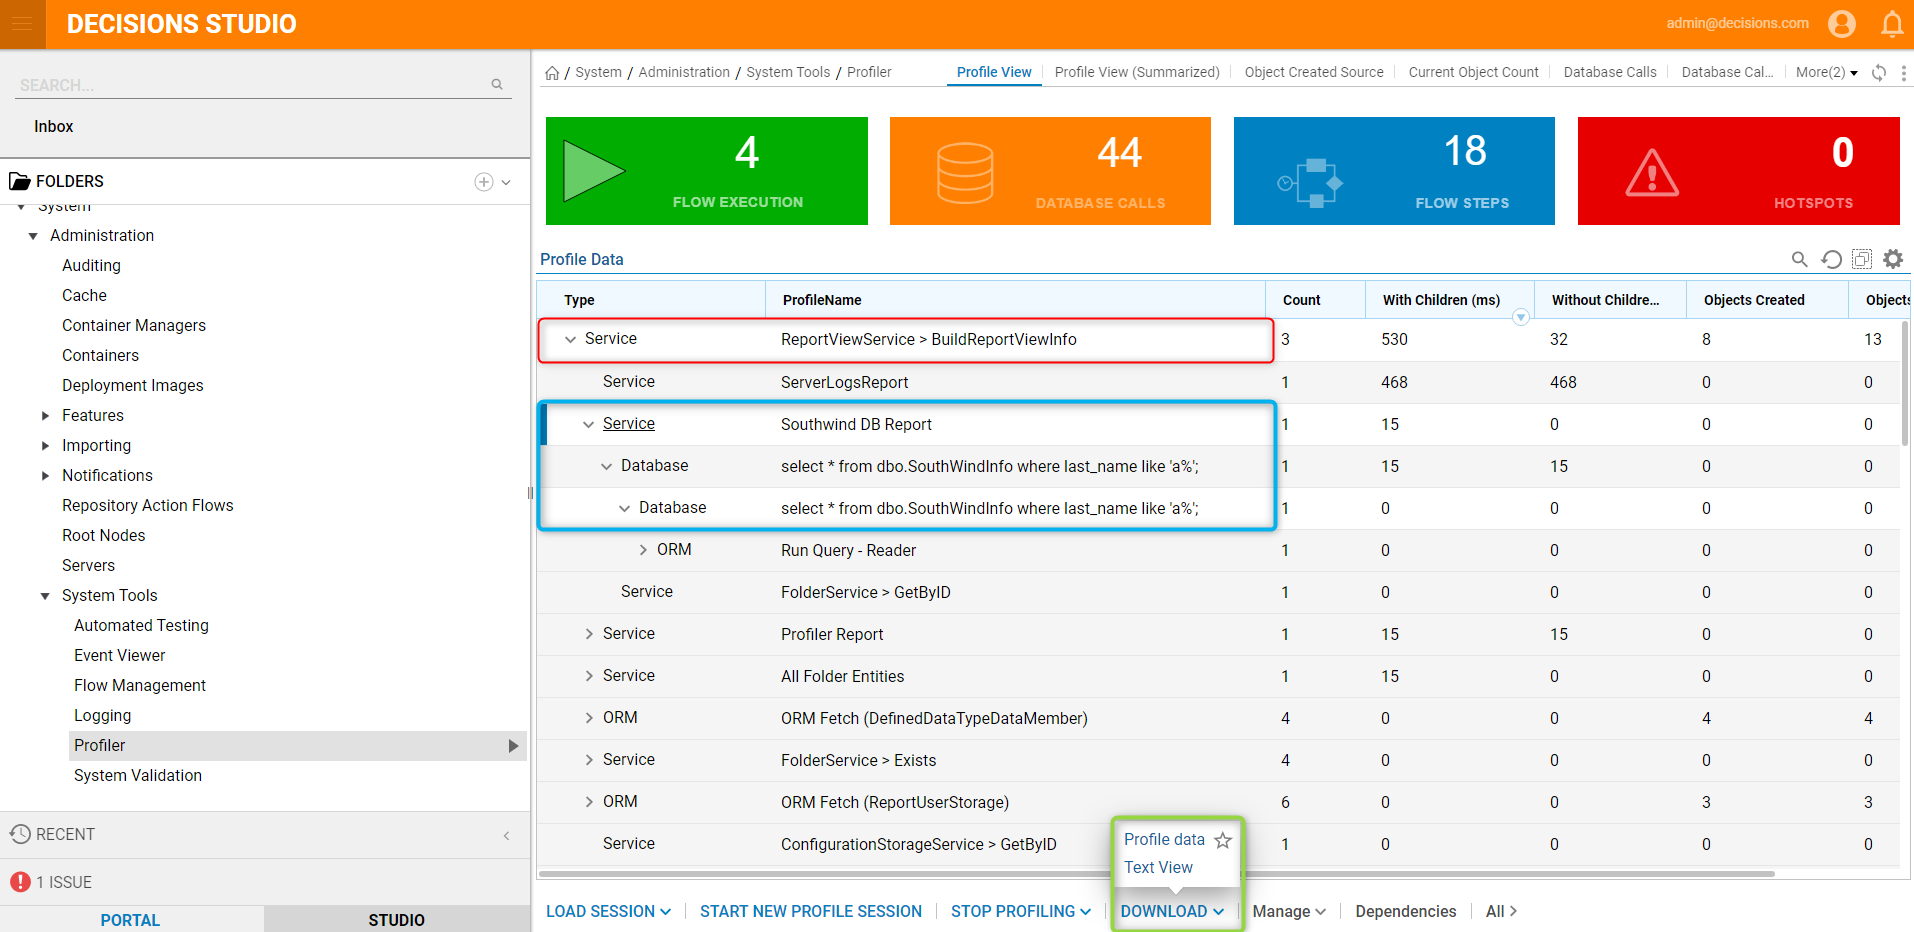
- The information can be viewed by expanding the ReportViewService > BuildReportViewInfo.For detailed information, click Download > Text View.
- This action will download the Profiler text file. The file will have details on the load time of the Report.
- This information can be utilized to help determine if stored procedures or caching will need to be used to speed up Report load times.