Overview
Business Metrics are quantifiable values that measure the success and efficiency of a given business process. For more information, see About Business Metrics.
Example
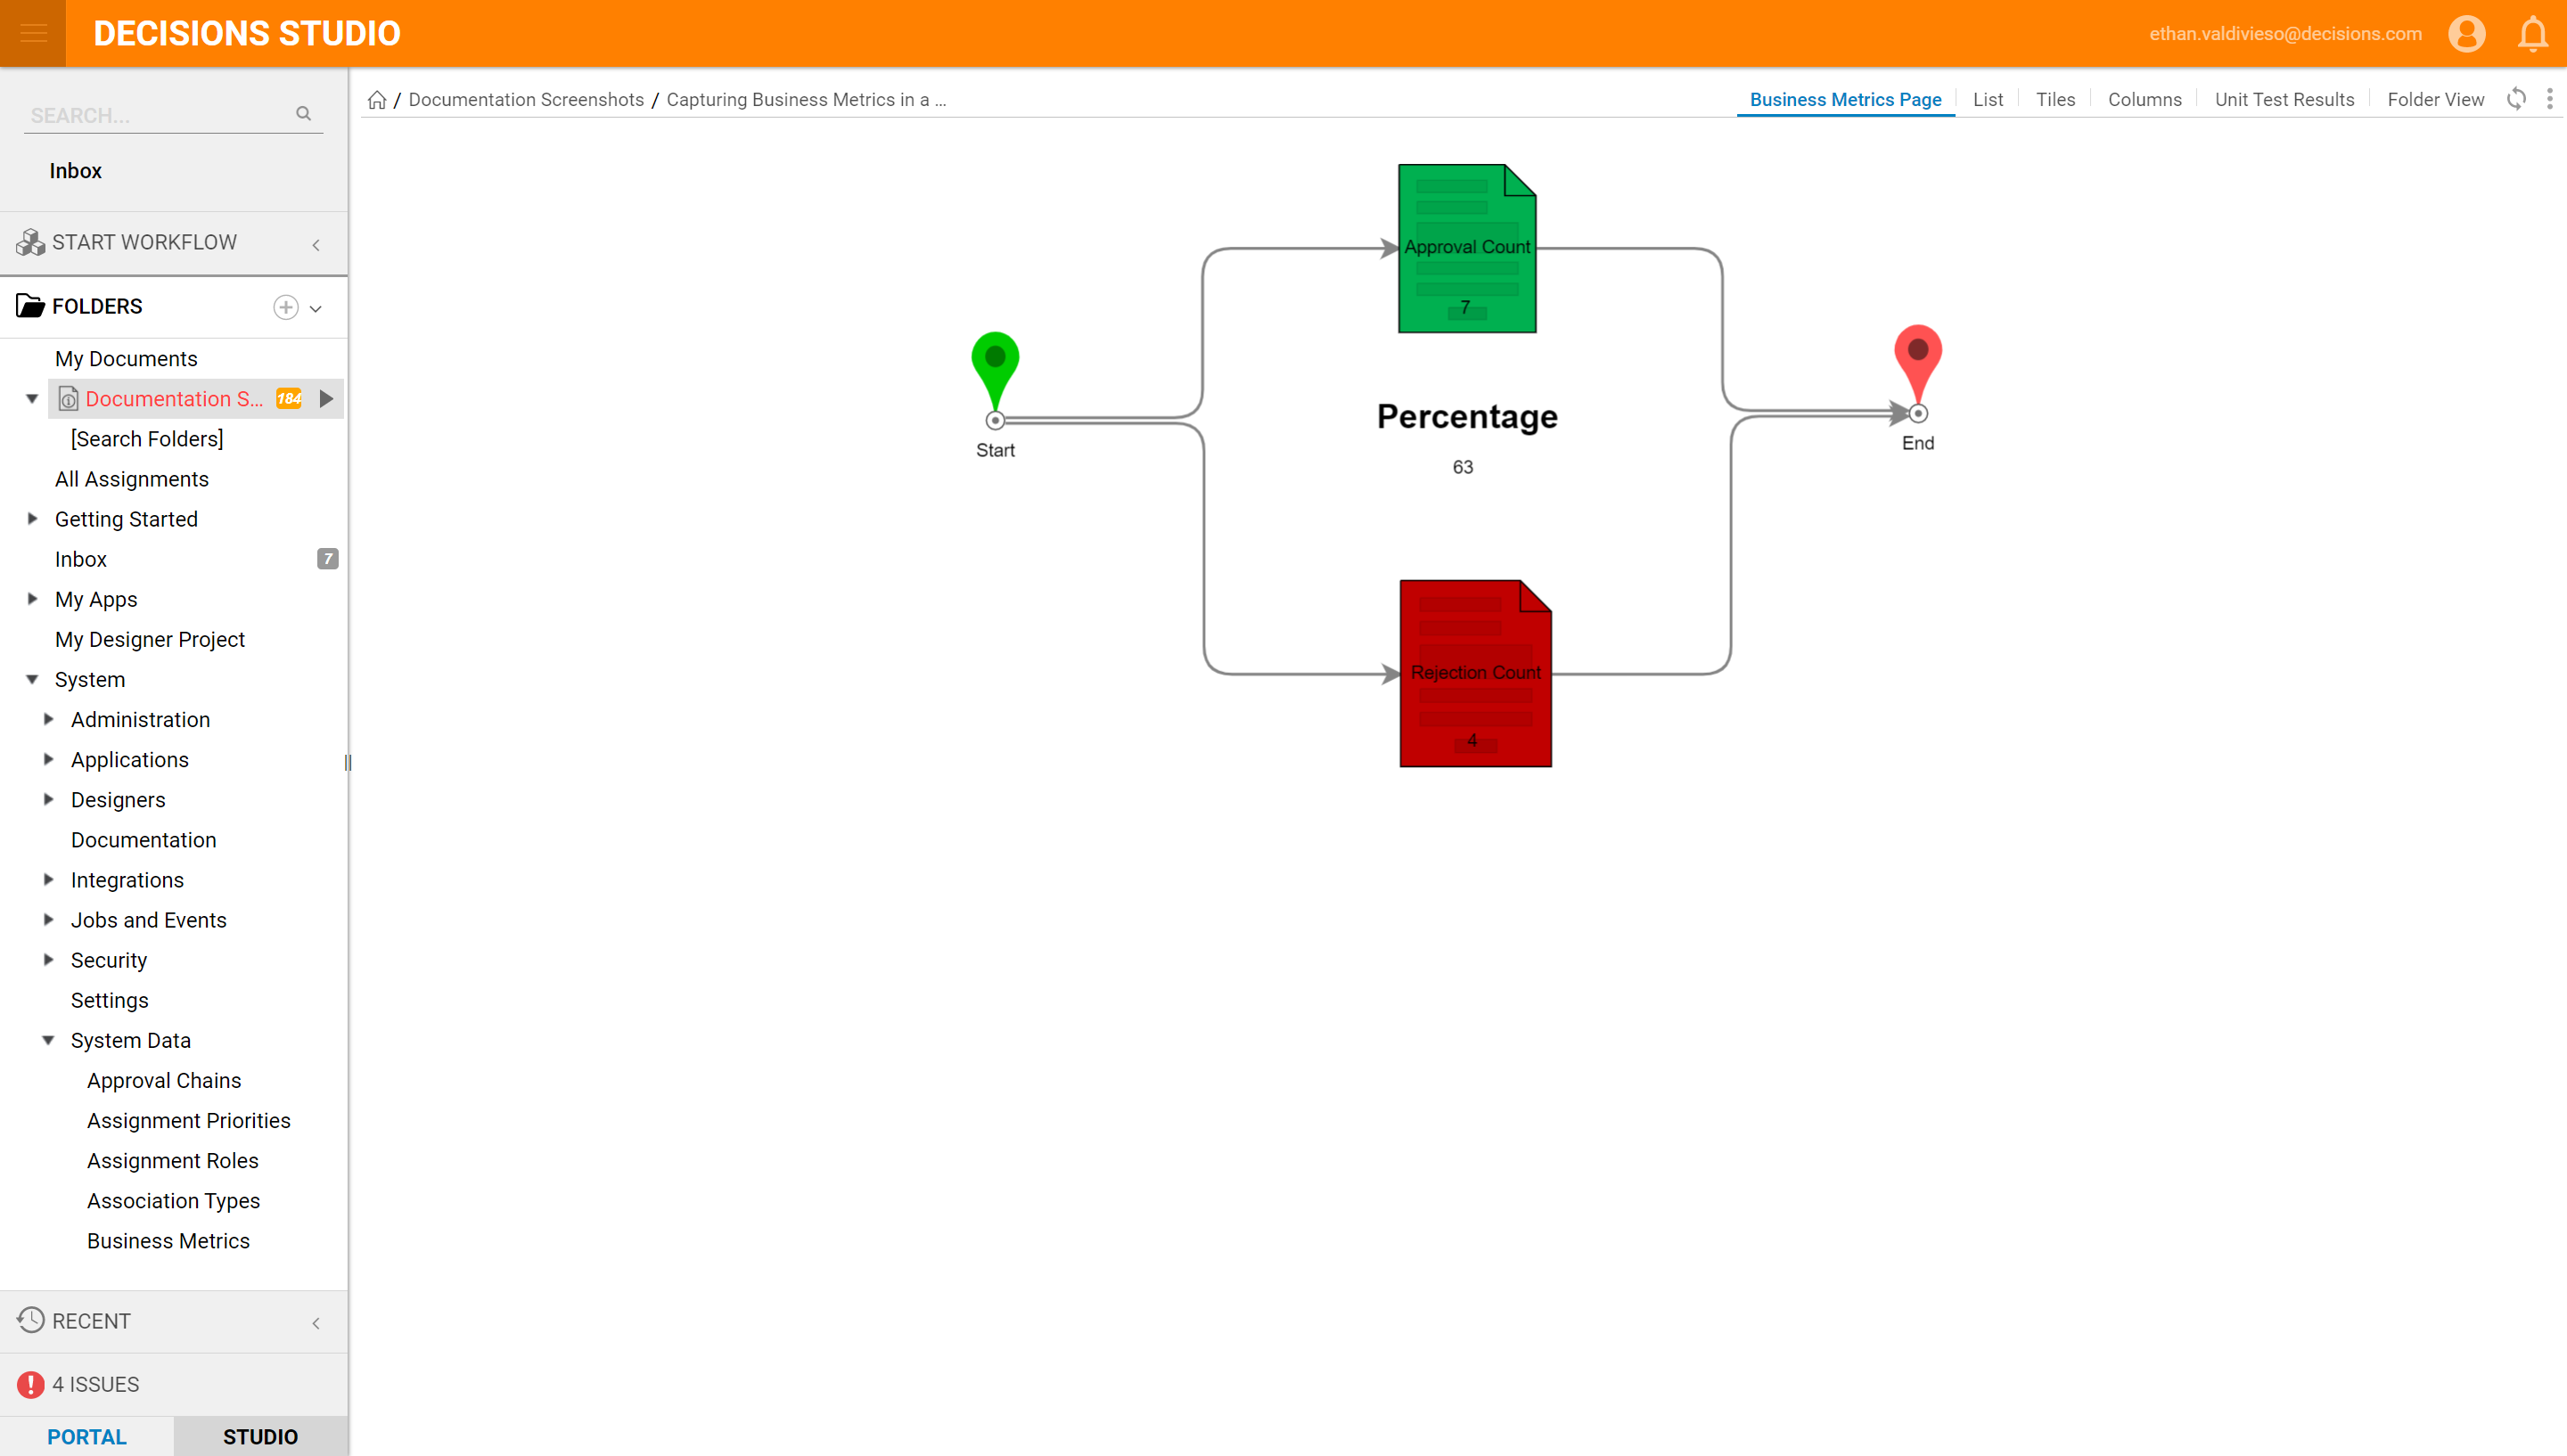
In this example, Decisions lets you choose the Flow Step(s) associated with that application as relevant business metrics and display it in a dashboard for analysts to see. This example tracks approvals versus rejections for a flow.
First, you must define your metrics. This will have an impact on the model building later.
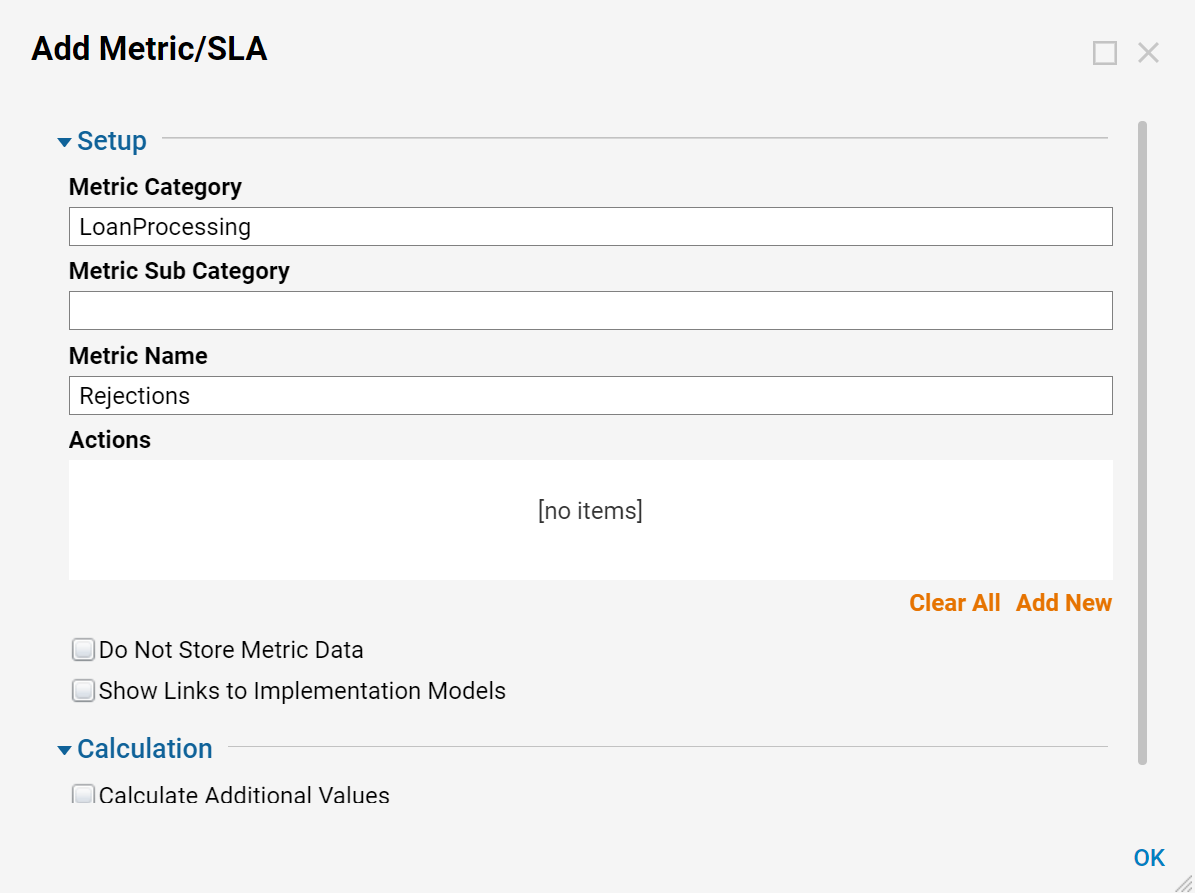
Define your metrics by going to System> System Data> Business Metrics/ SLAs. Select Add Metrics/SLA
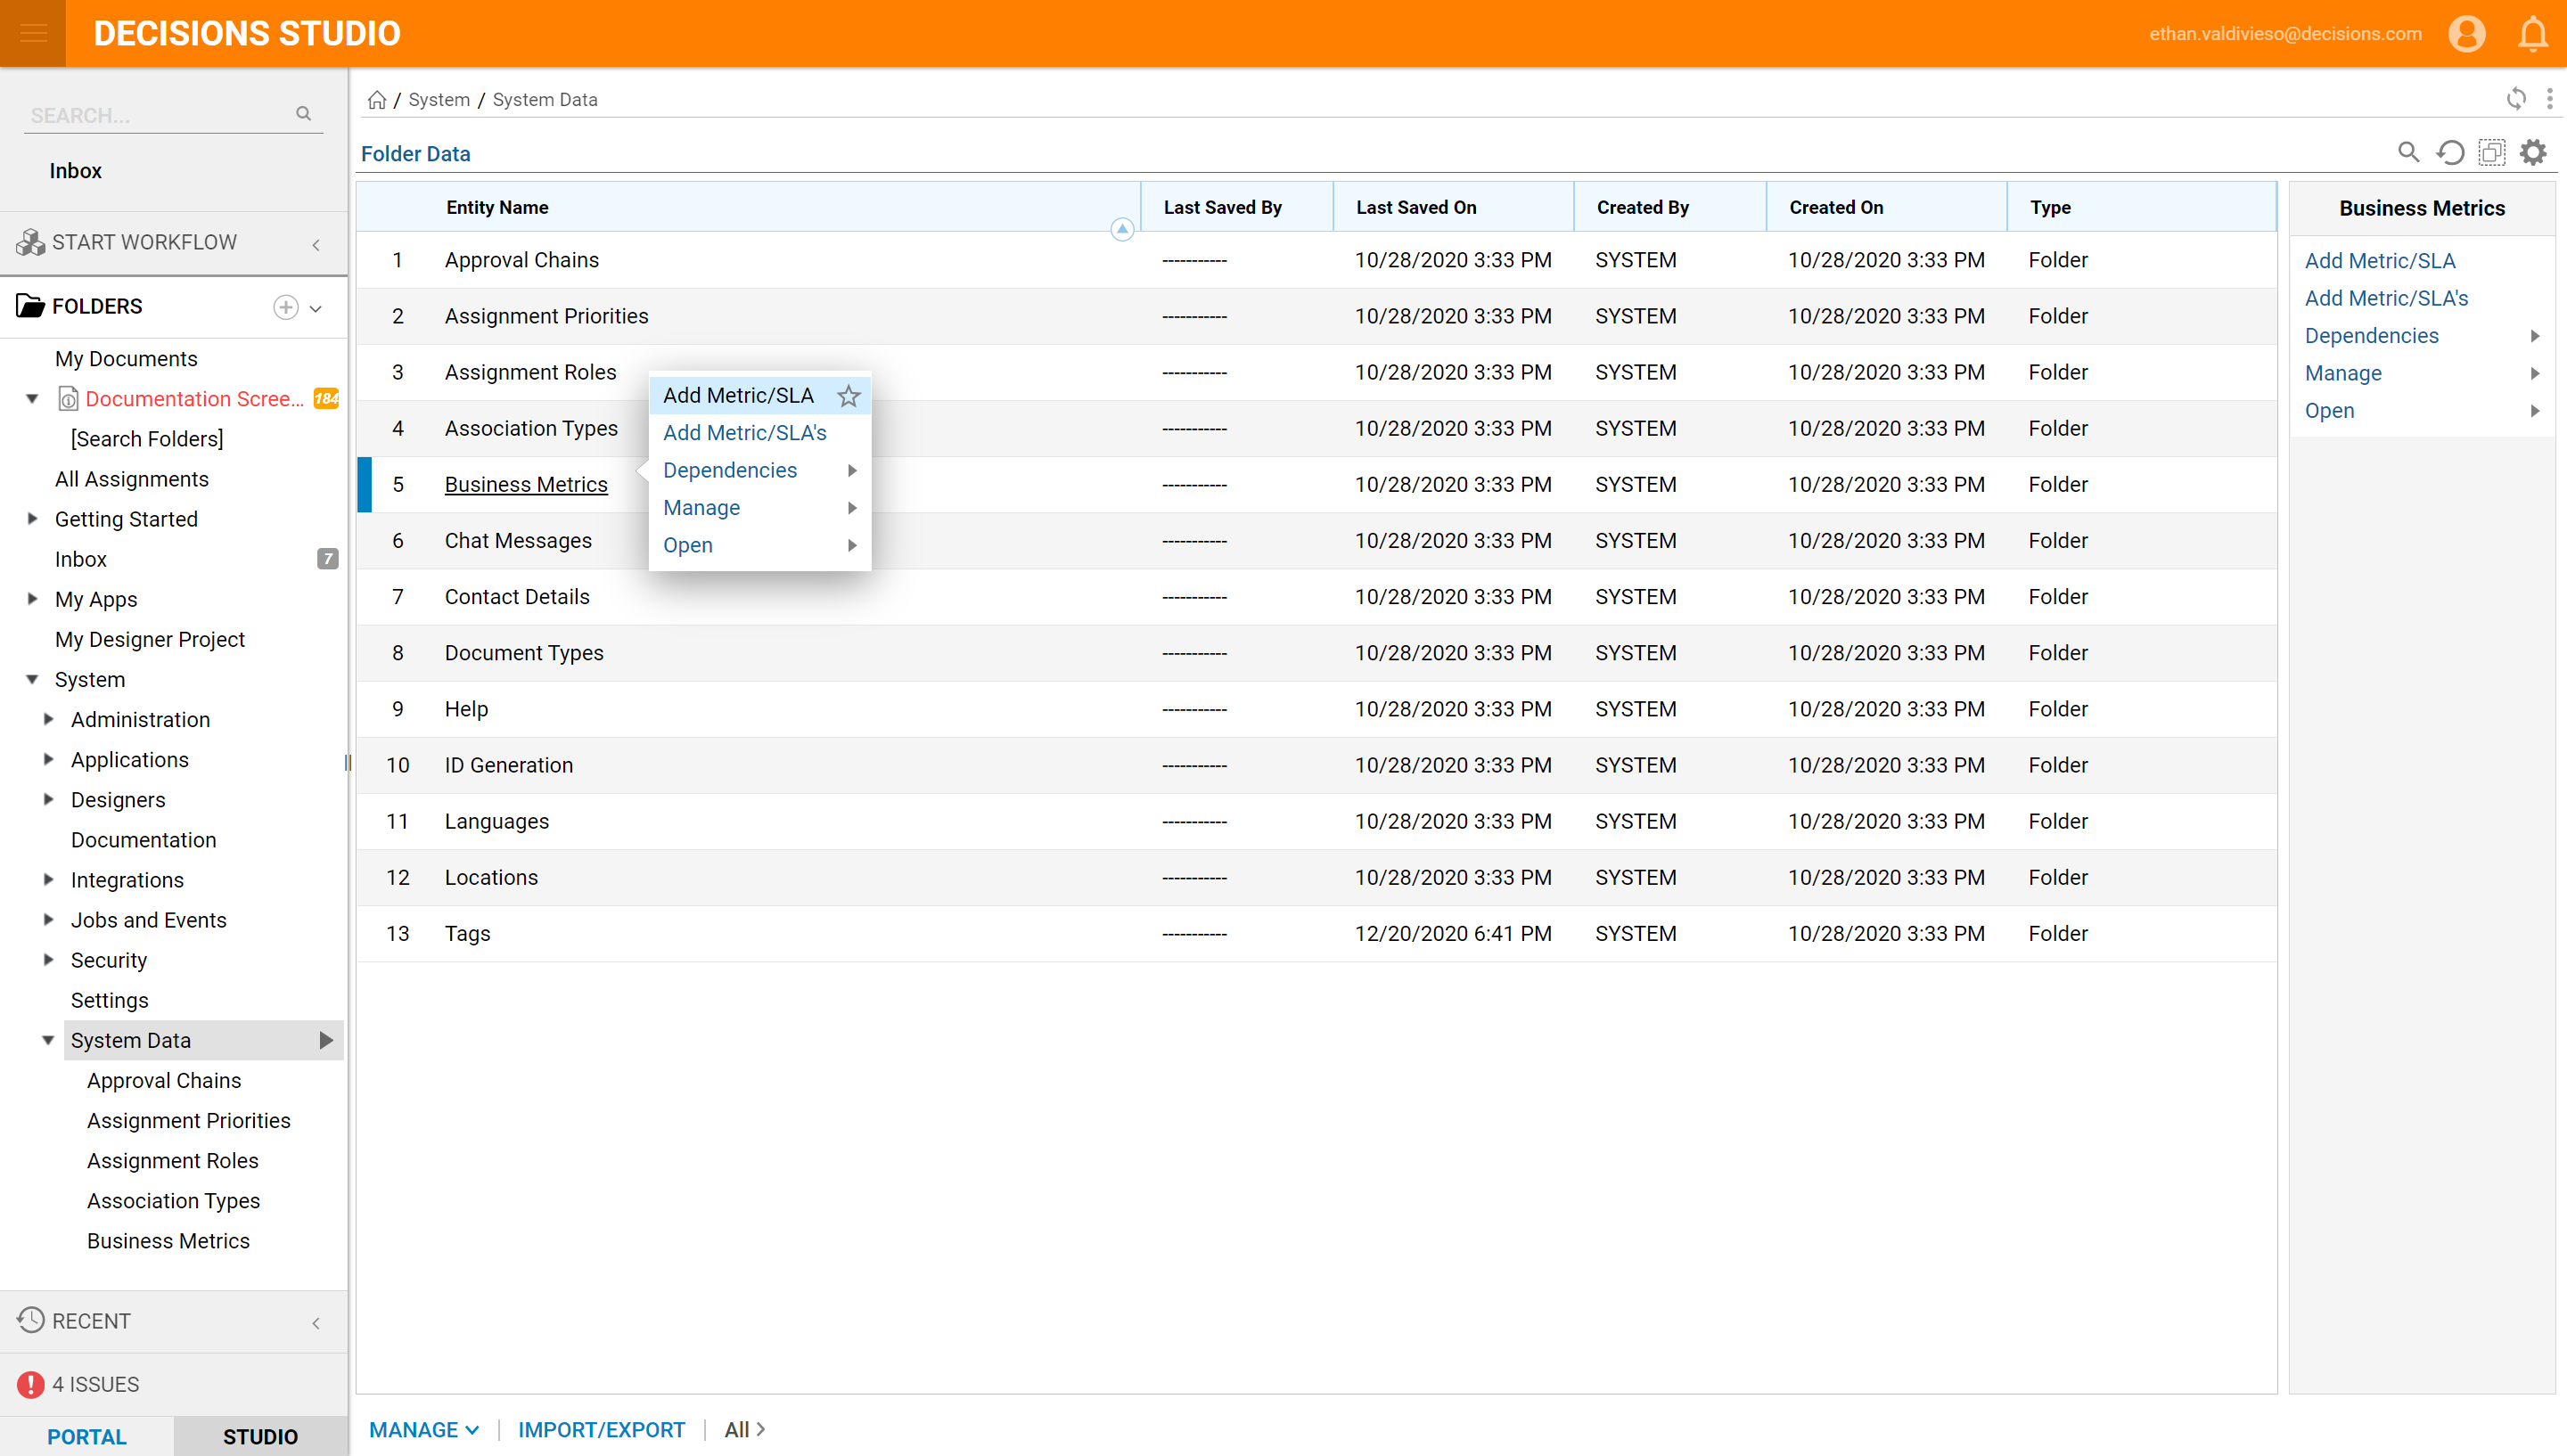
The idea is to create Categories and Sub Categories as well as sometimes referred to as Metric Names.
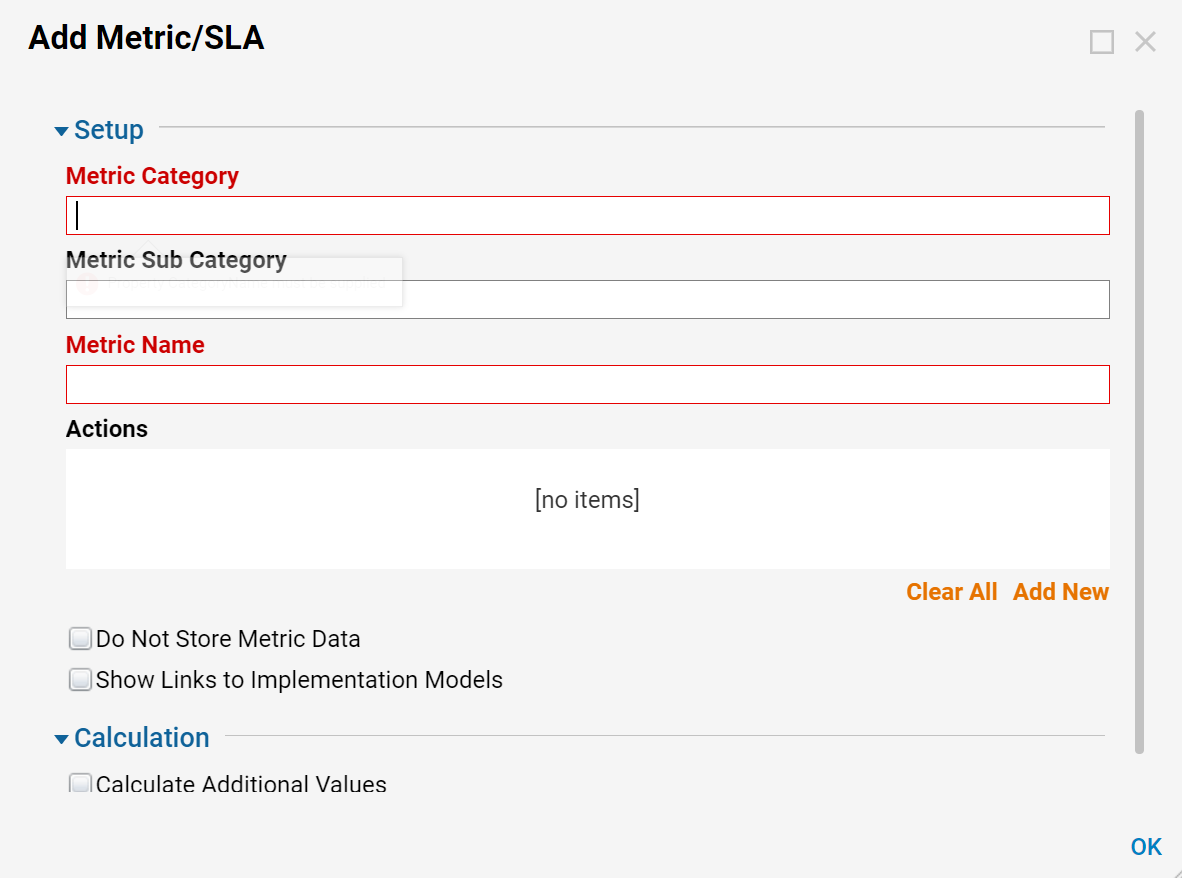
Input a Metric Category and Metric Name. Do this for both categories Approval and Rejection.
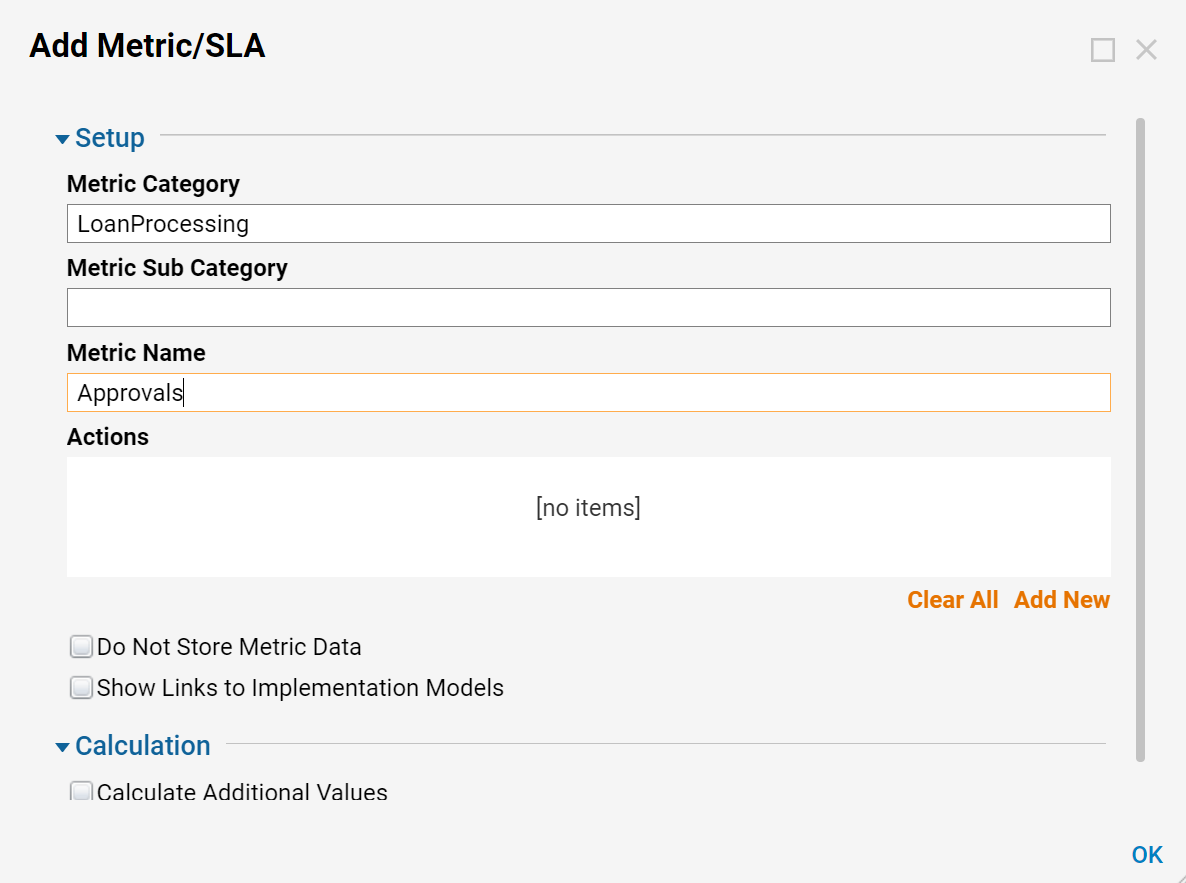
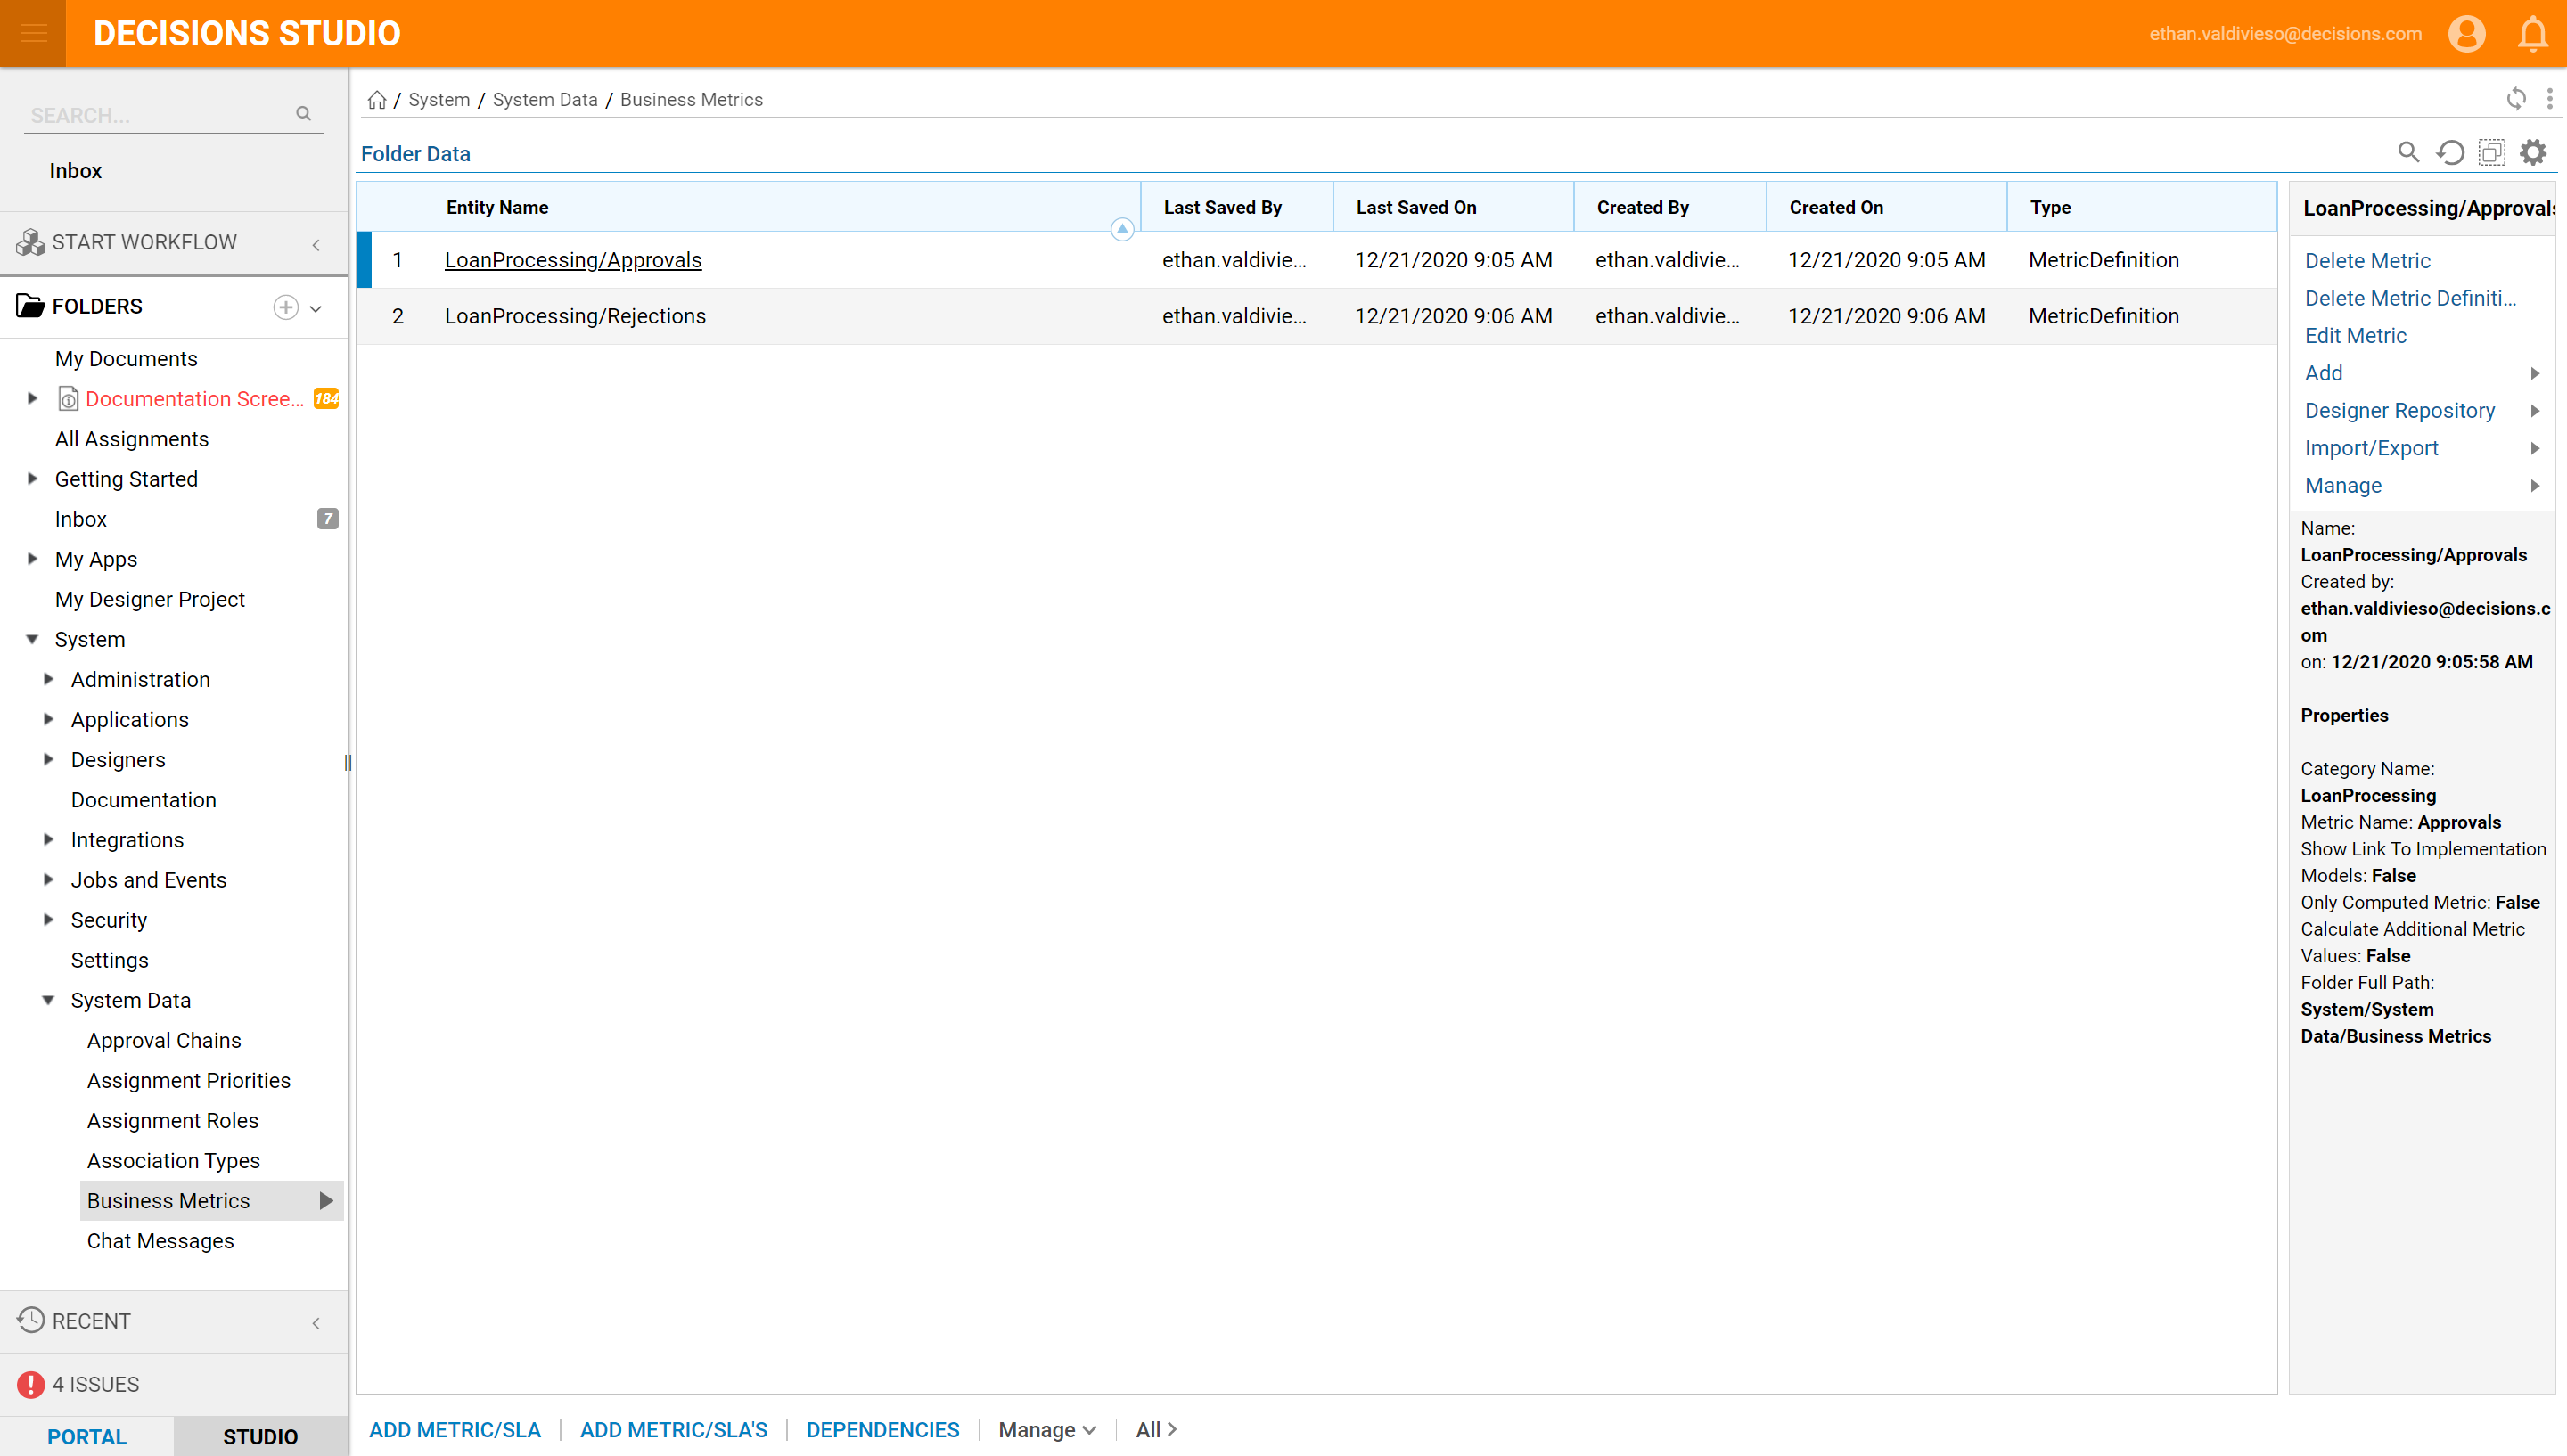
There are now two metrics and one category.
You can attach a metric to any number of steps across any number of flows and projects. That is what makes metrics special.
The approval or rejection is the metric, whether or not the percentage relates to the category.
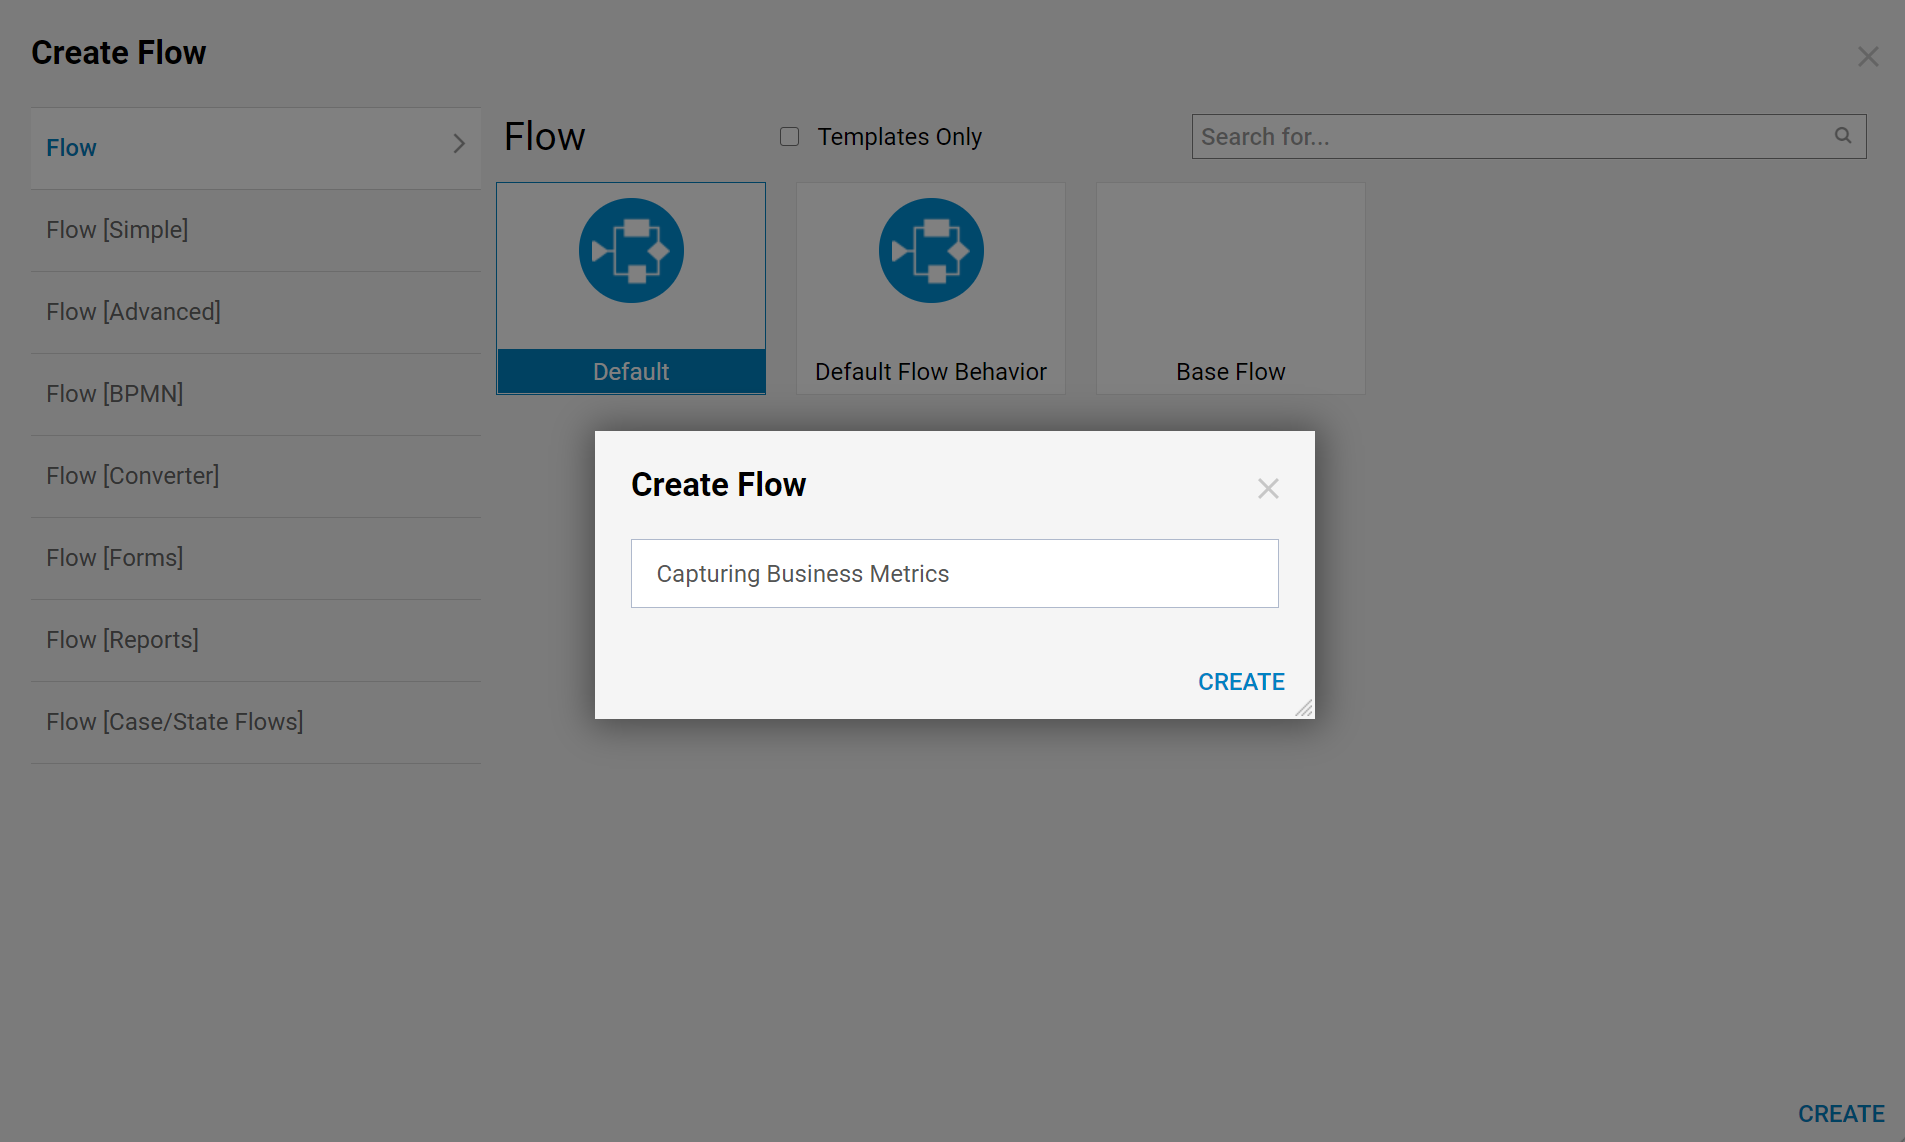
To apply the current metrics, a flow must be created. In a Designer Folder select Create Flow.
Name the flow and select Create.
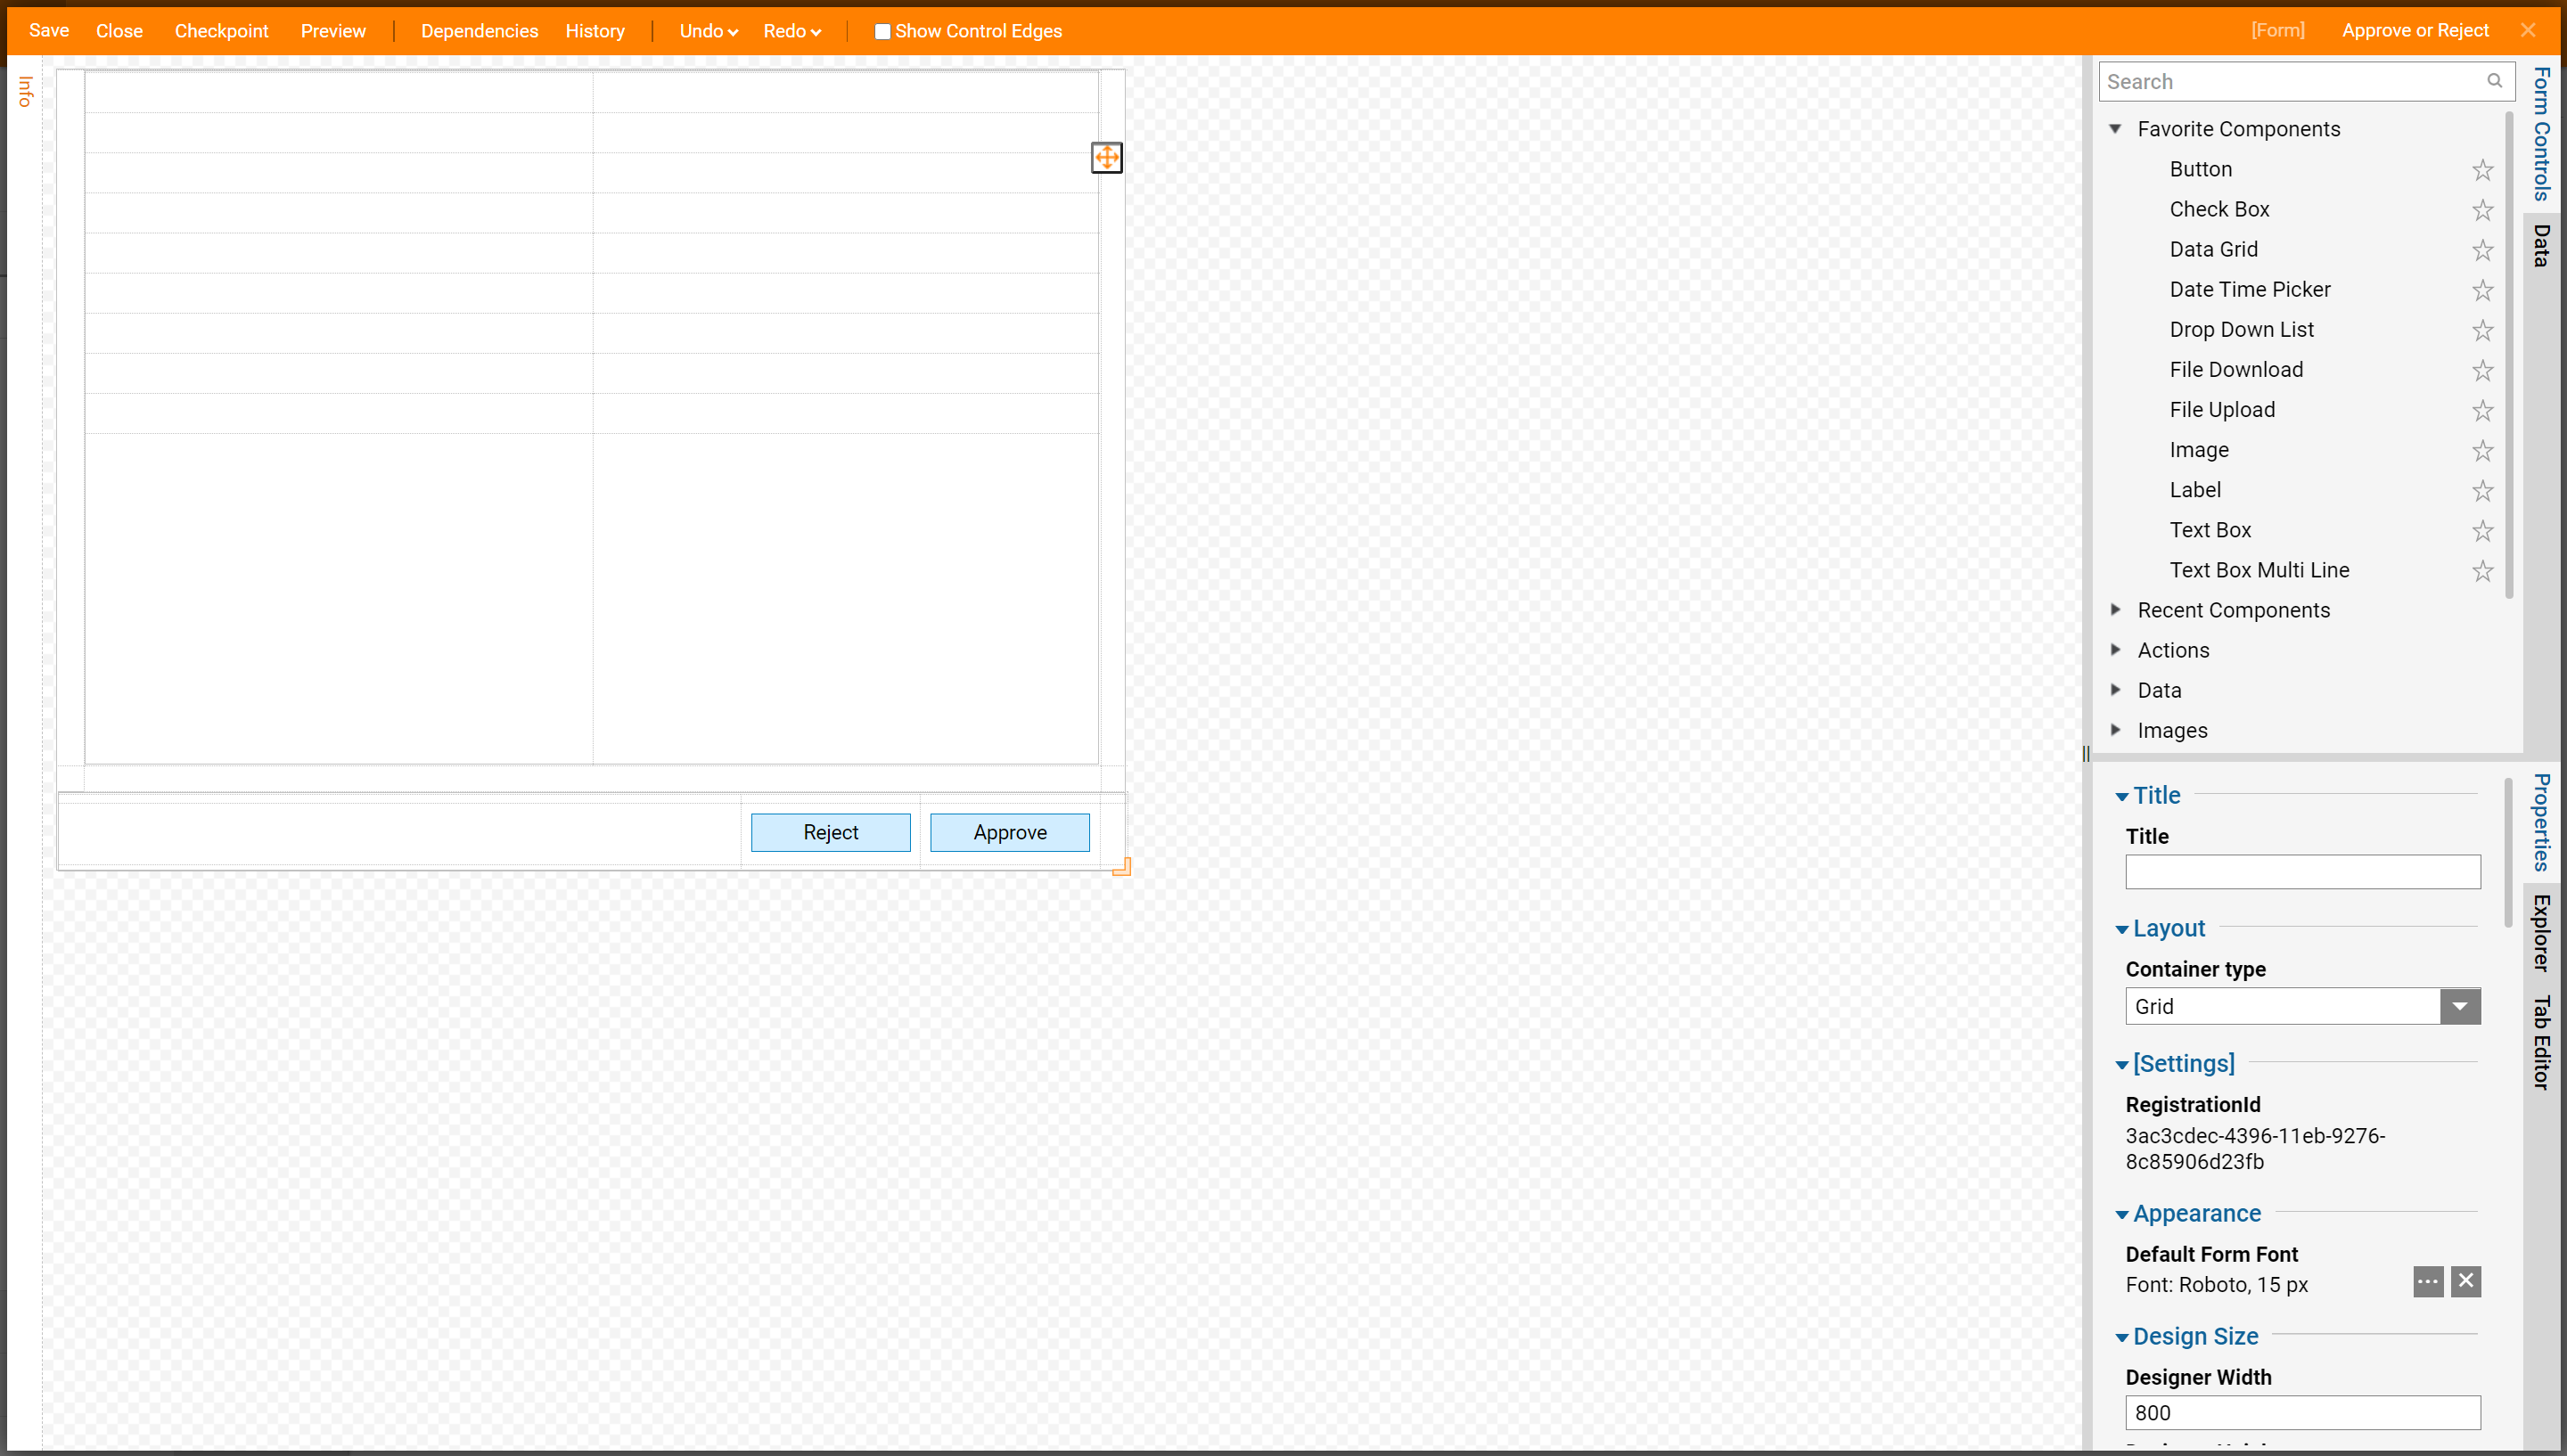
In the flow, select Show Form from the Steps toolbox. Create a form with two buttons, select Save and Close. This simple form will be used.
Select a form and in the Properties toolbox under Business Metrics > Metric Data. Select the "..." icon.
.png)
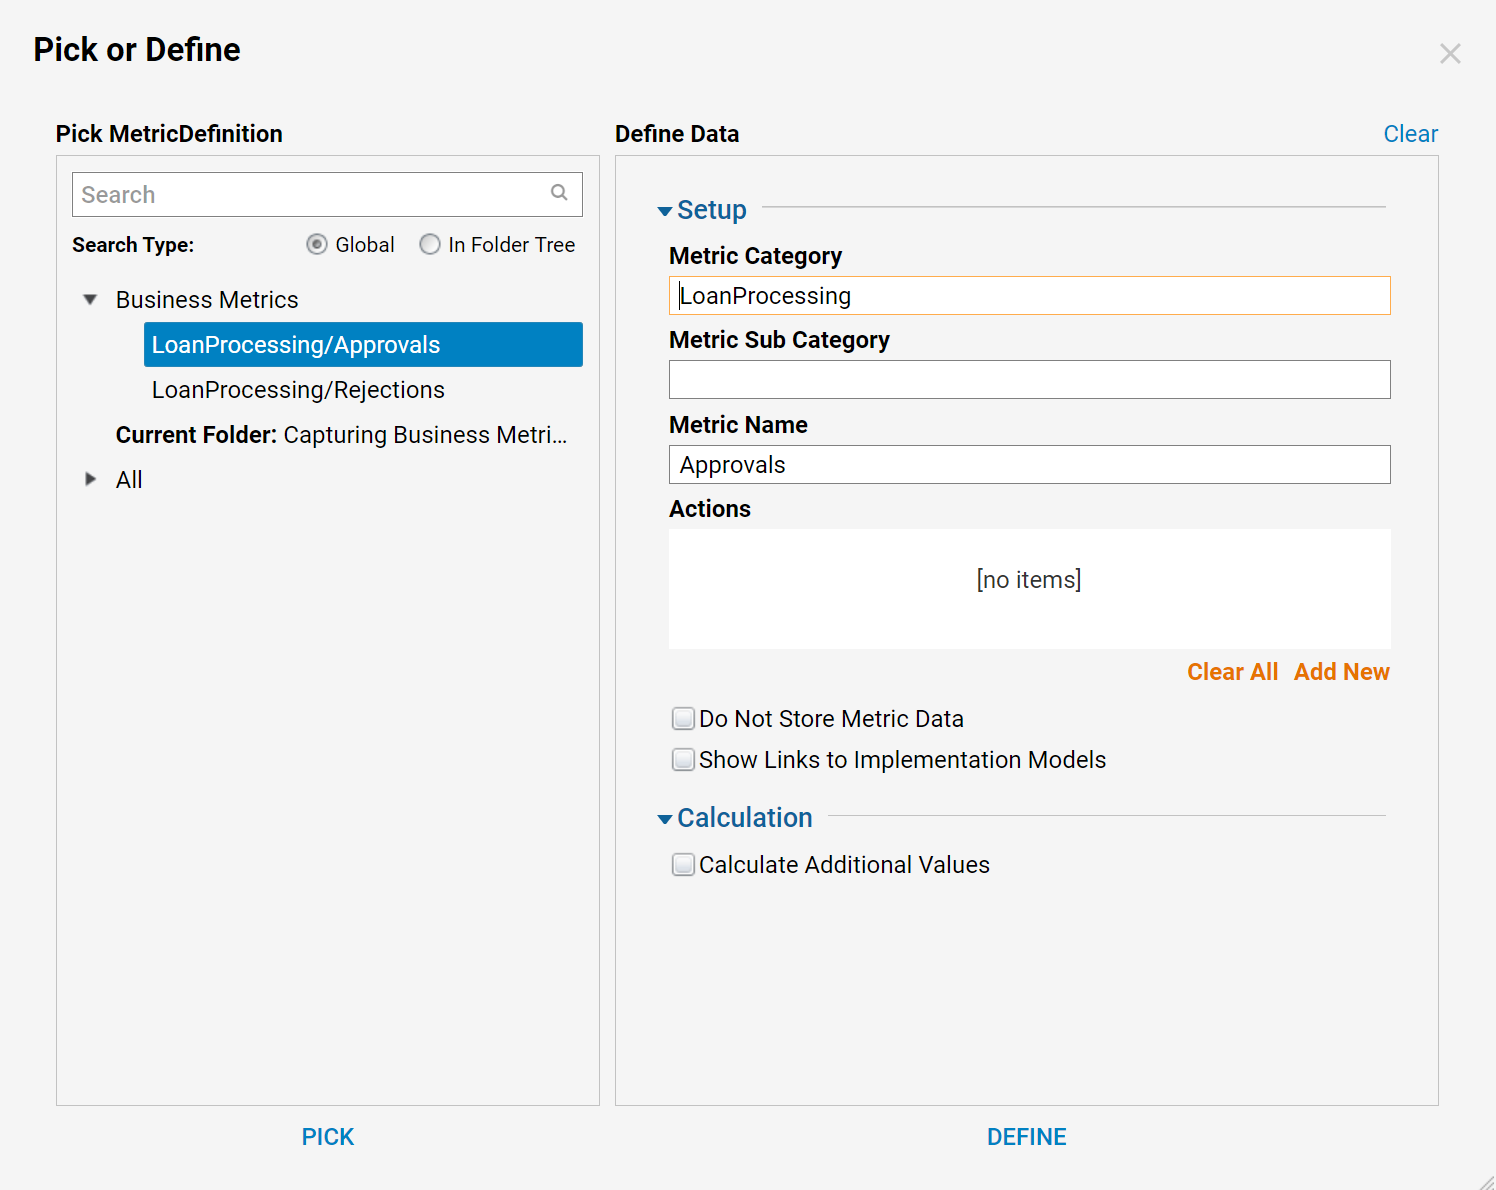
Select the metric of choice then select Pick when finished. Do this for both Metrics/SLAs created previously.
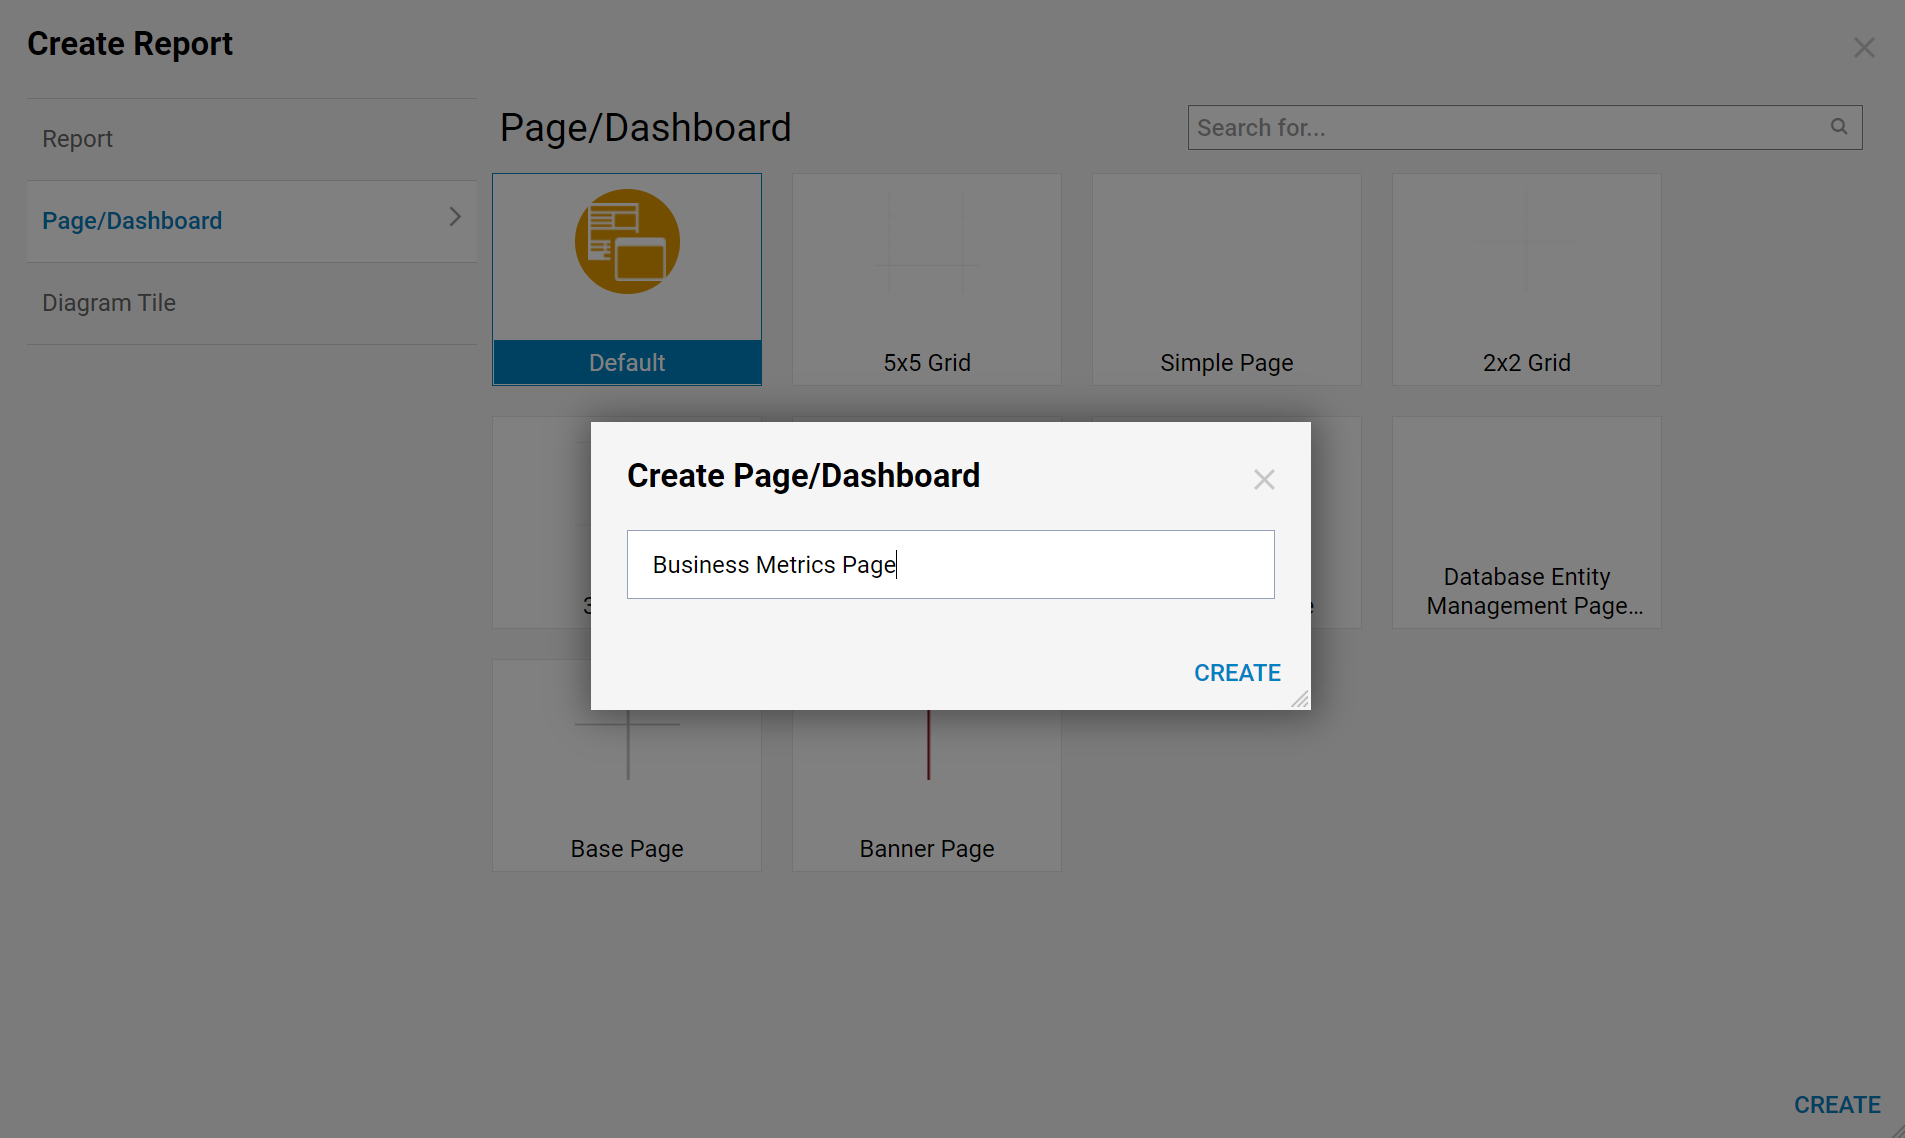
Next, select Create Report. Expand Page and choose Default, select Create. Then name the page and select Create
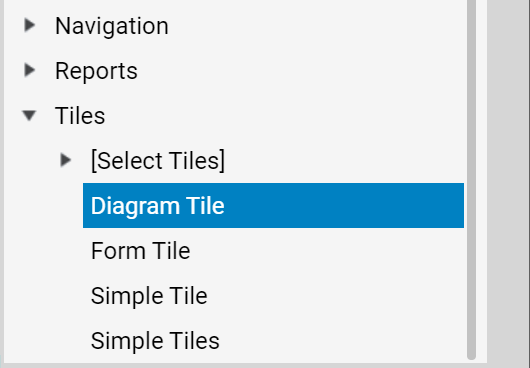
In the Page Elements panel select Tiles > Diagram Tiles
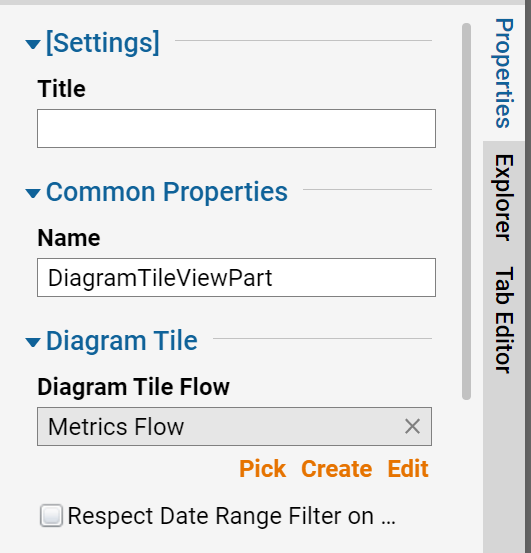
With the Diagram Tile selected in the Properties tab select Create under Diagram Tile Flow.
Name the flow and select Create.
In the Steps toolbox add a Start and End Step from the Steps category. Next, add two Page - Form from the Shapes category.
With a Page - Form selected open the Properties panel. Under Configuration Details name the step. Create an Outcome Path by typing Done in the Outcome Paths text box. There is also the option to change the Background Color. Apply this to both Page - Forms, one for approved the other for rejected.
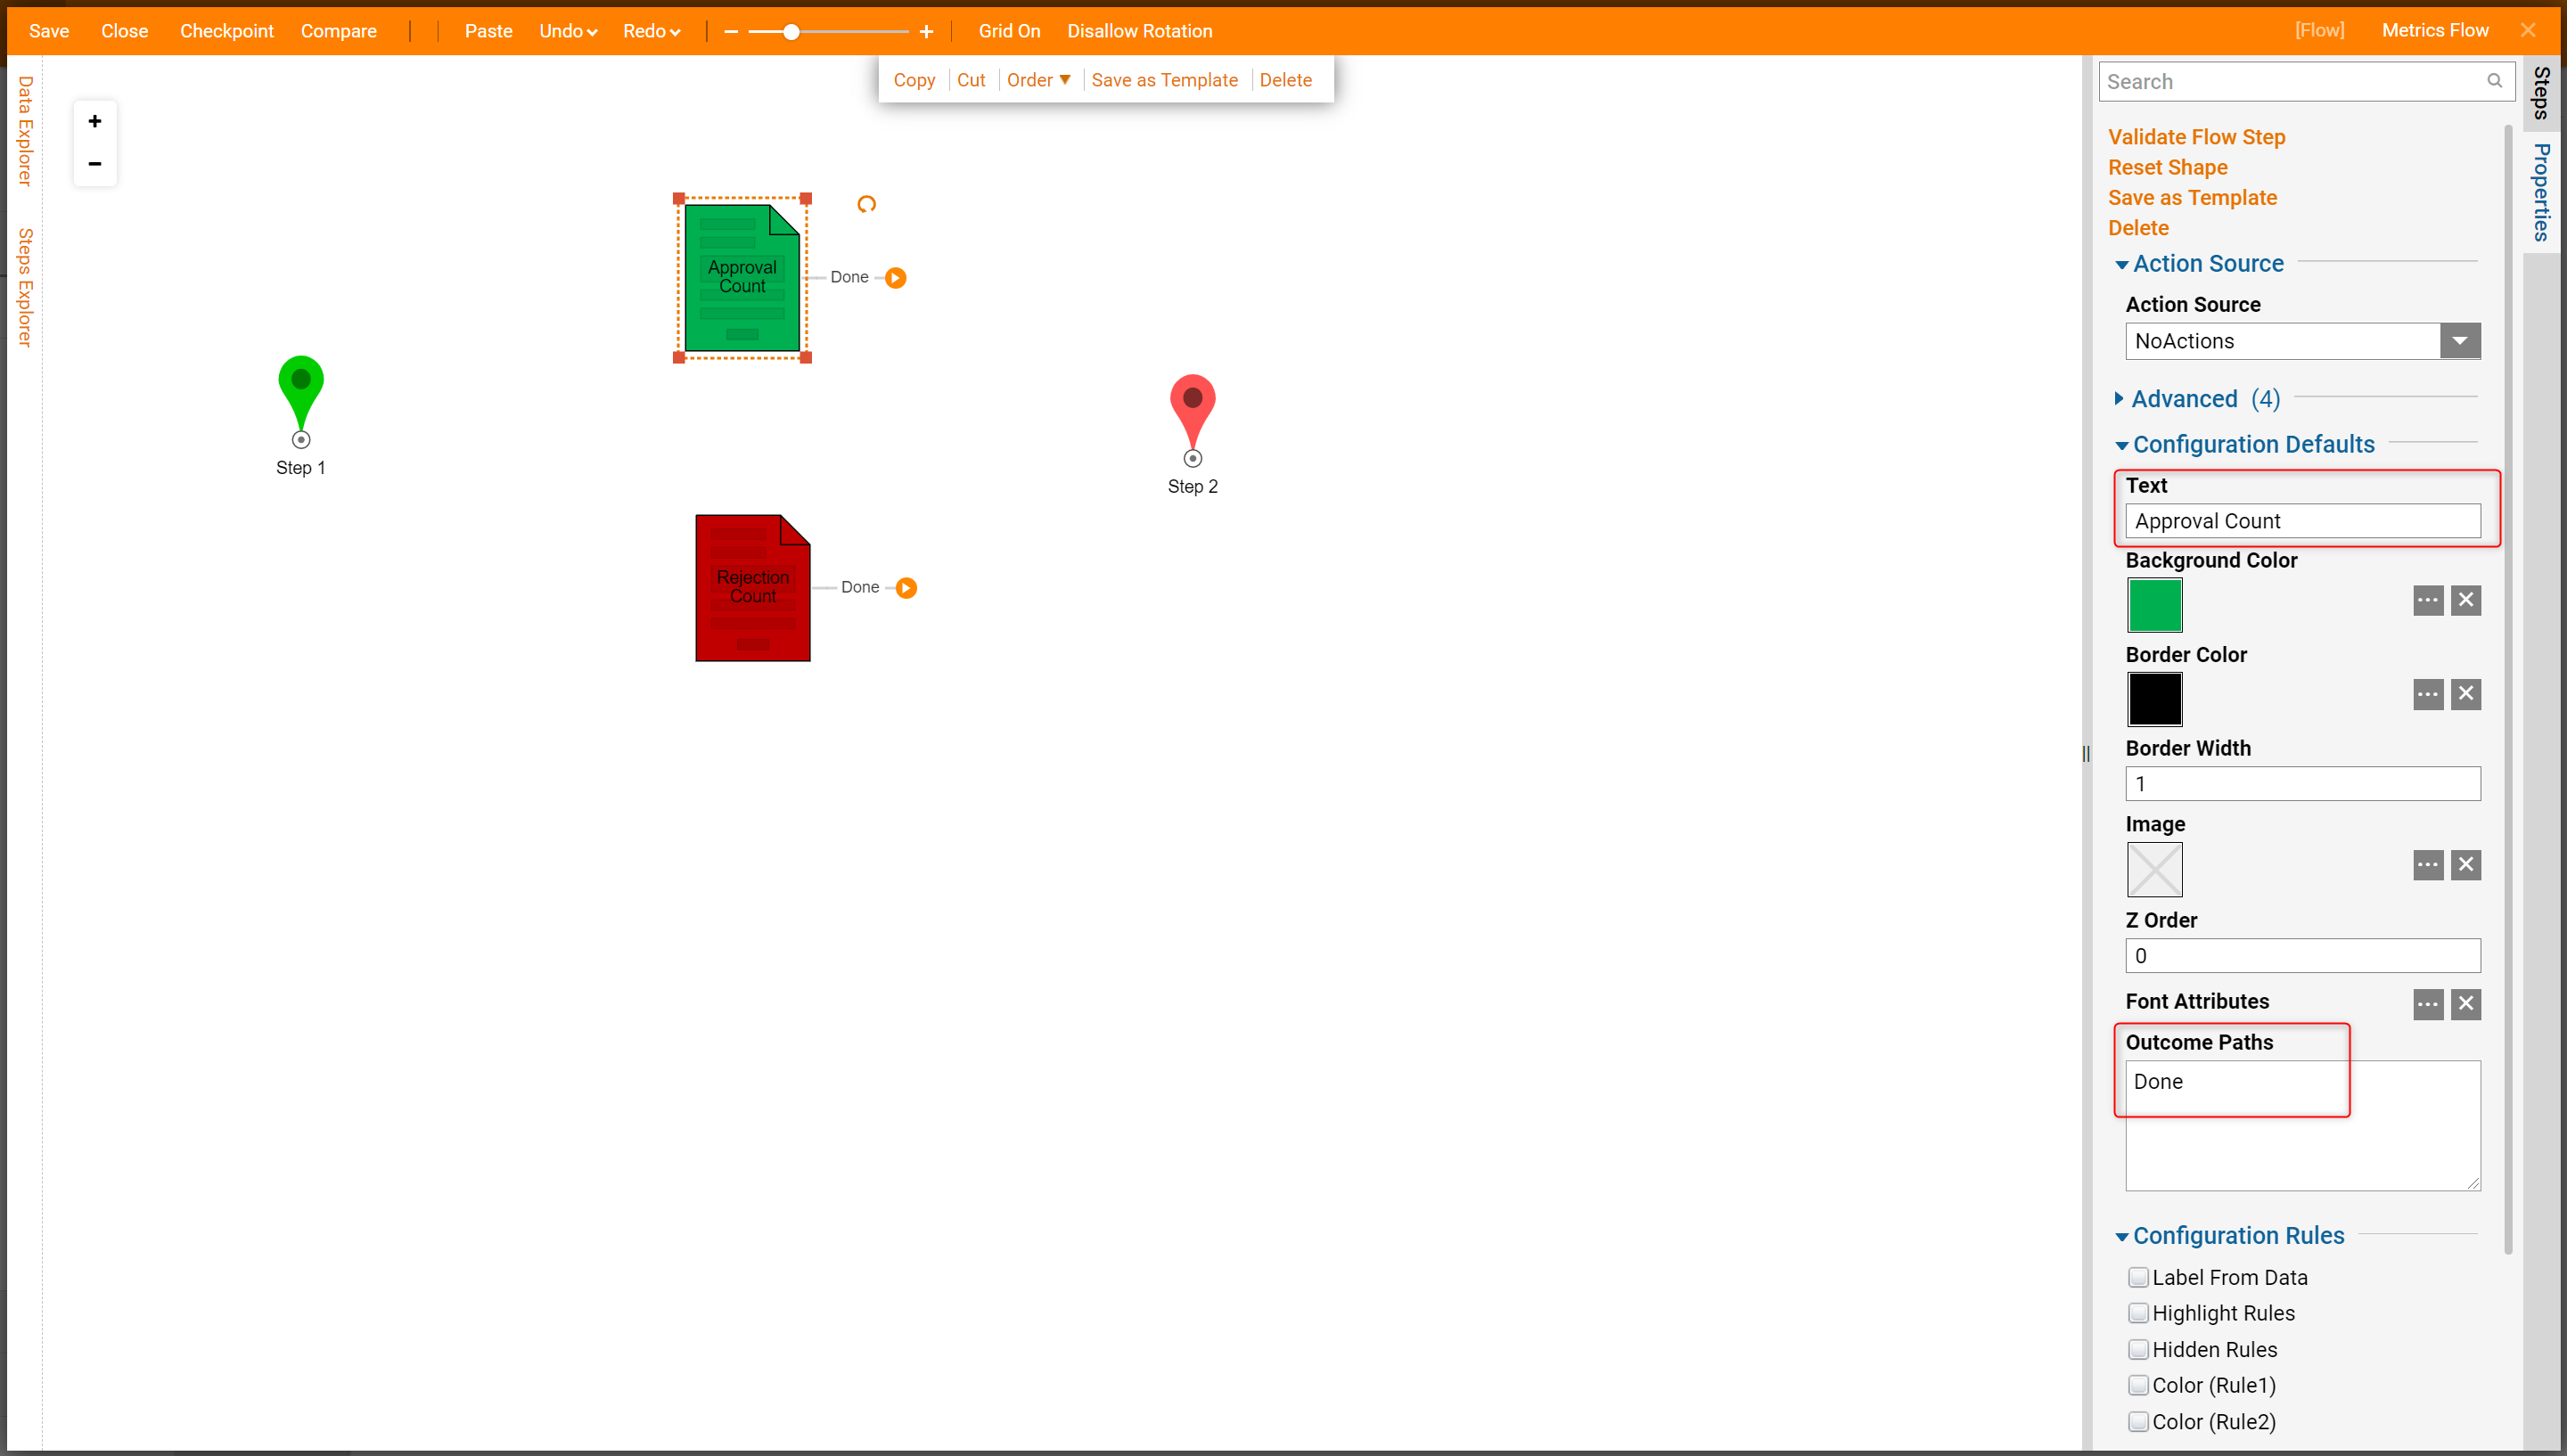
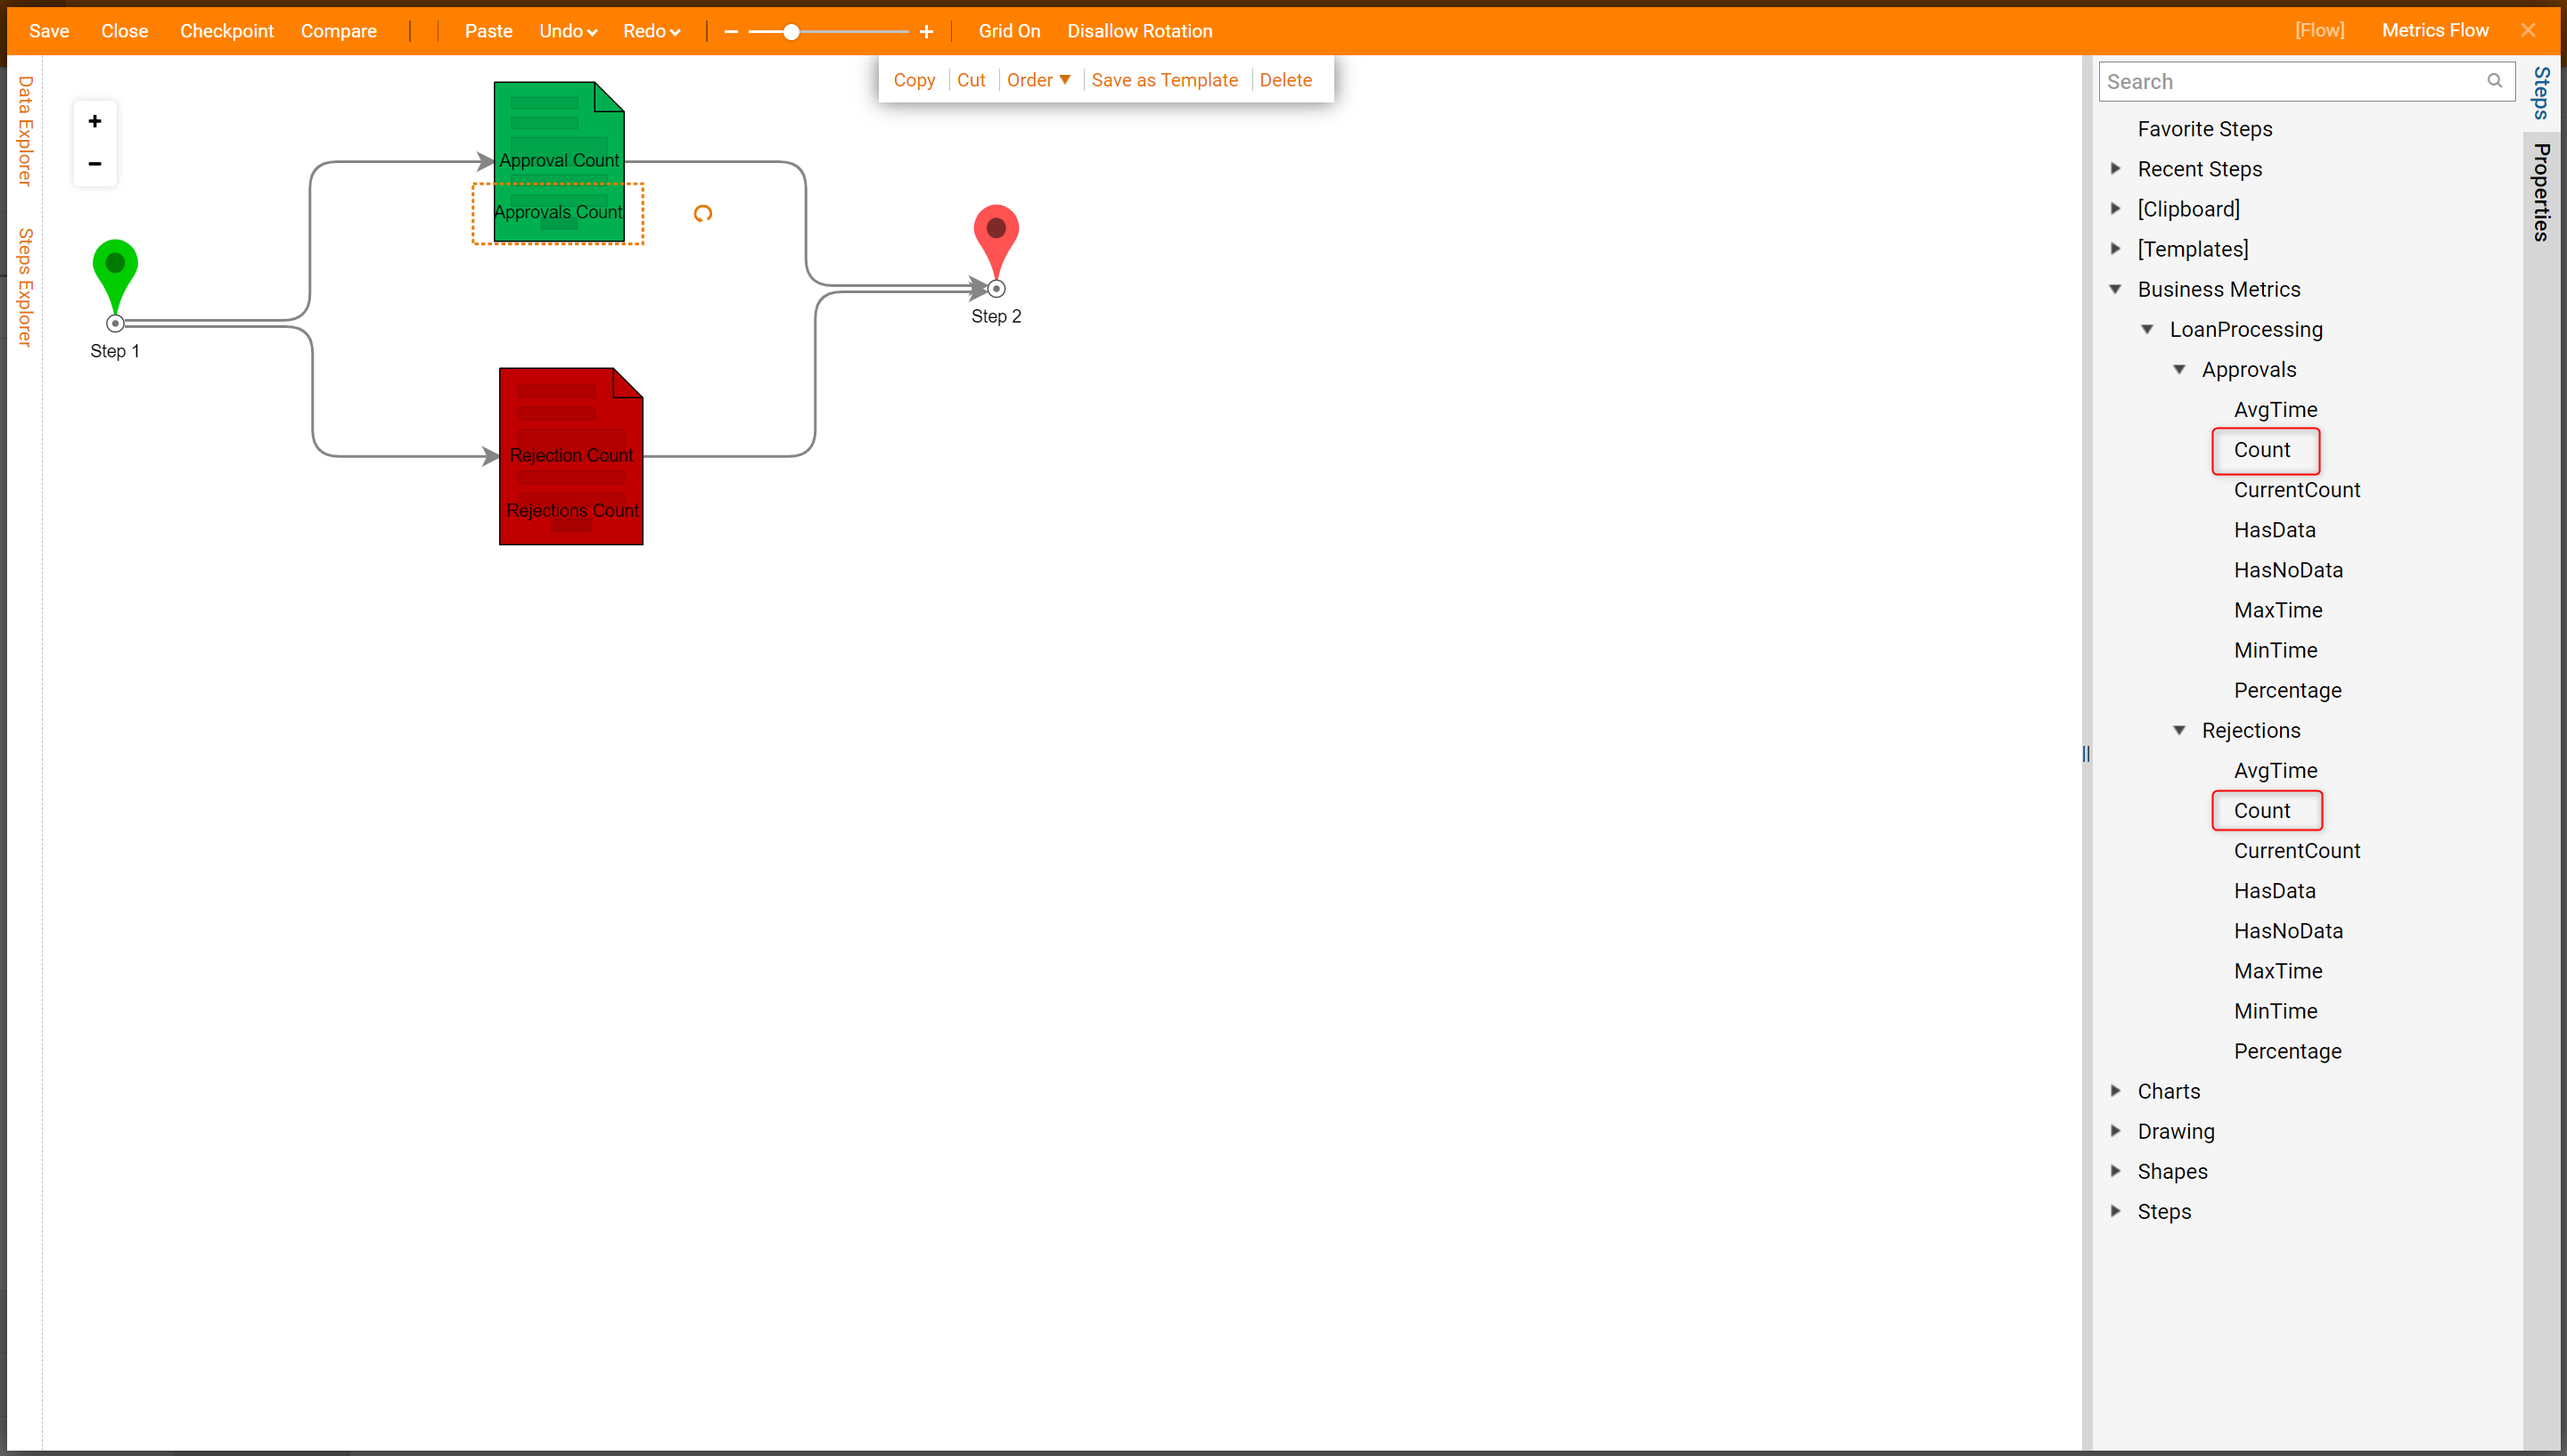
Back in the Steps panel, expand Business Metrics > Loan Processing. Then expand both Approvals and Rejections. Each of these categories has steps that will display the related data. Click and drag Count to the corresponding Page - Form.
The actual count will display back in the tile part on the page. Connect both outcome paths to the endpoint.
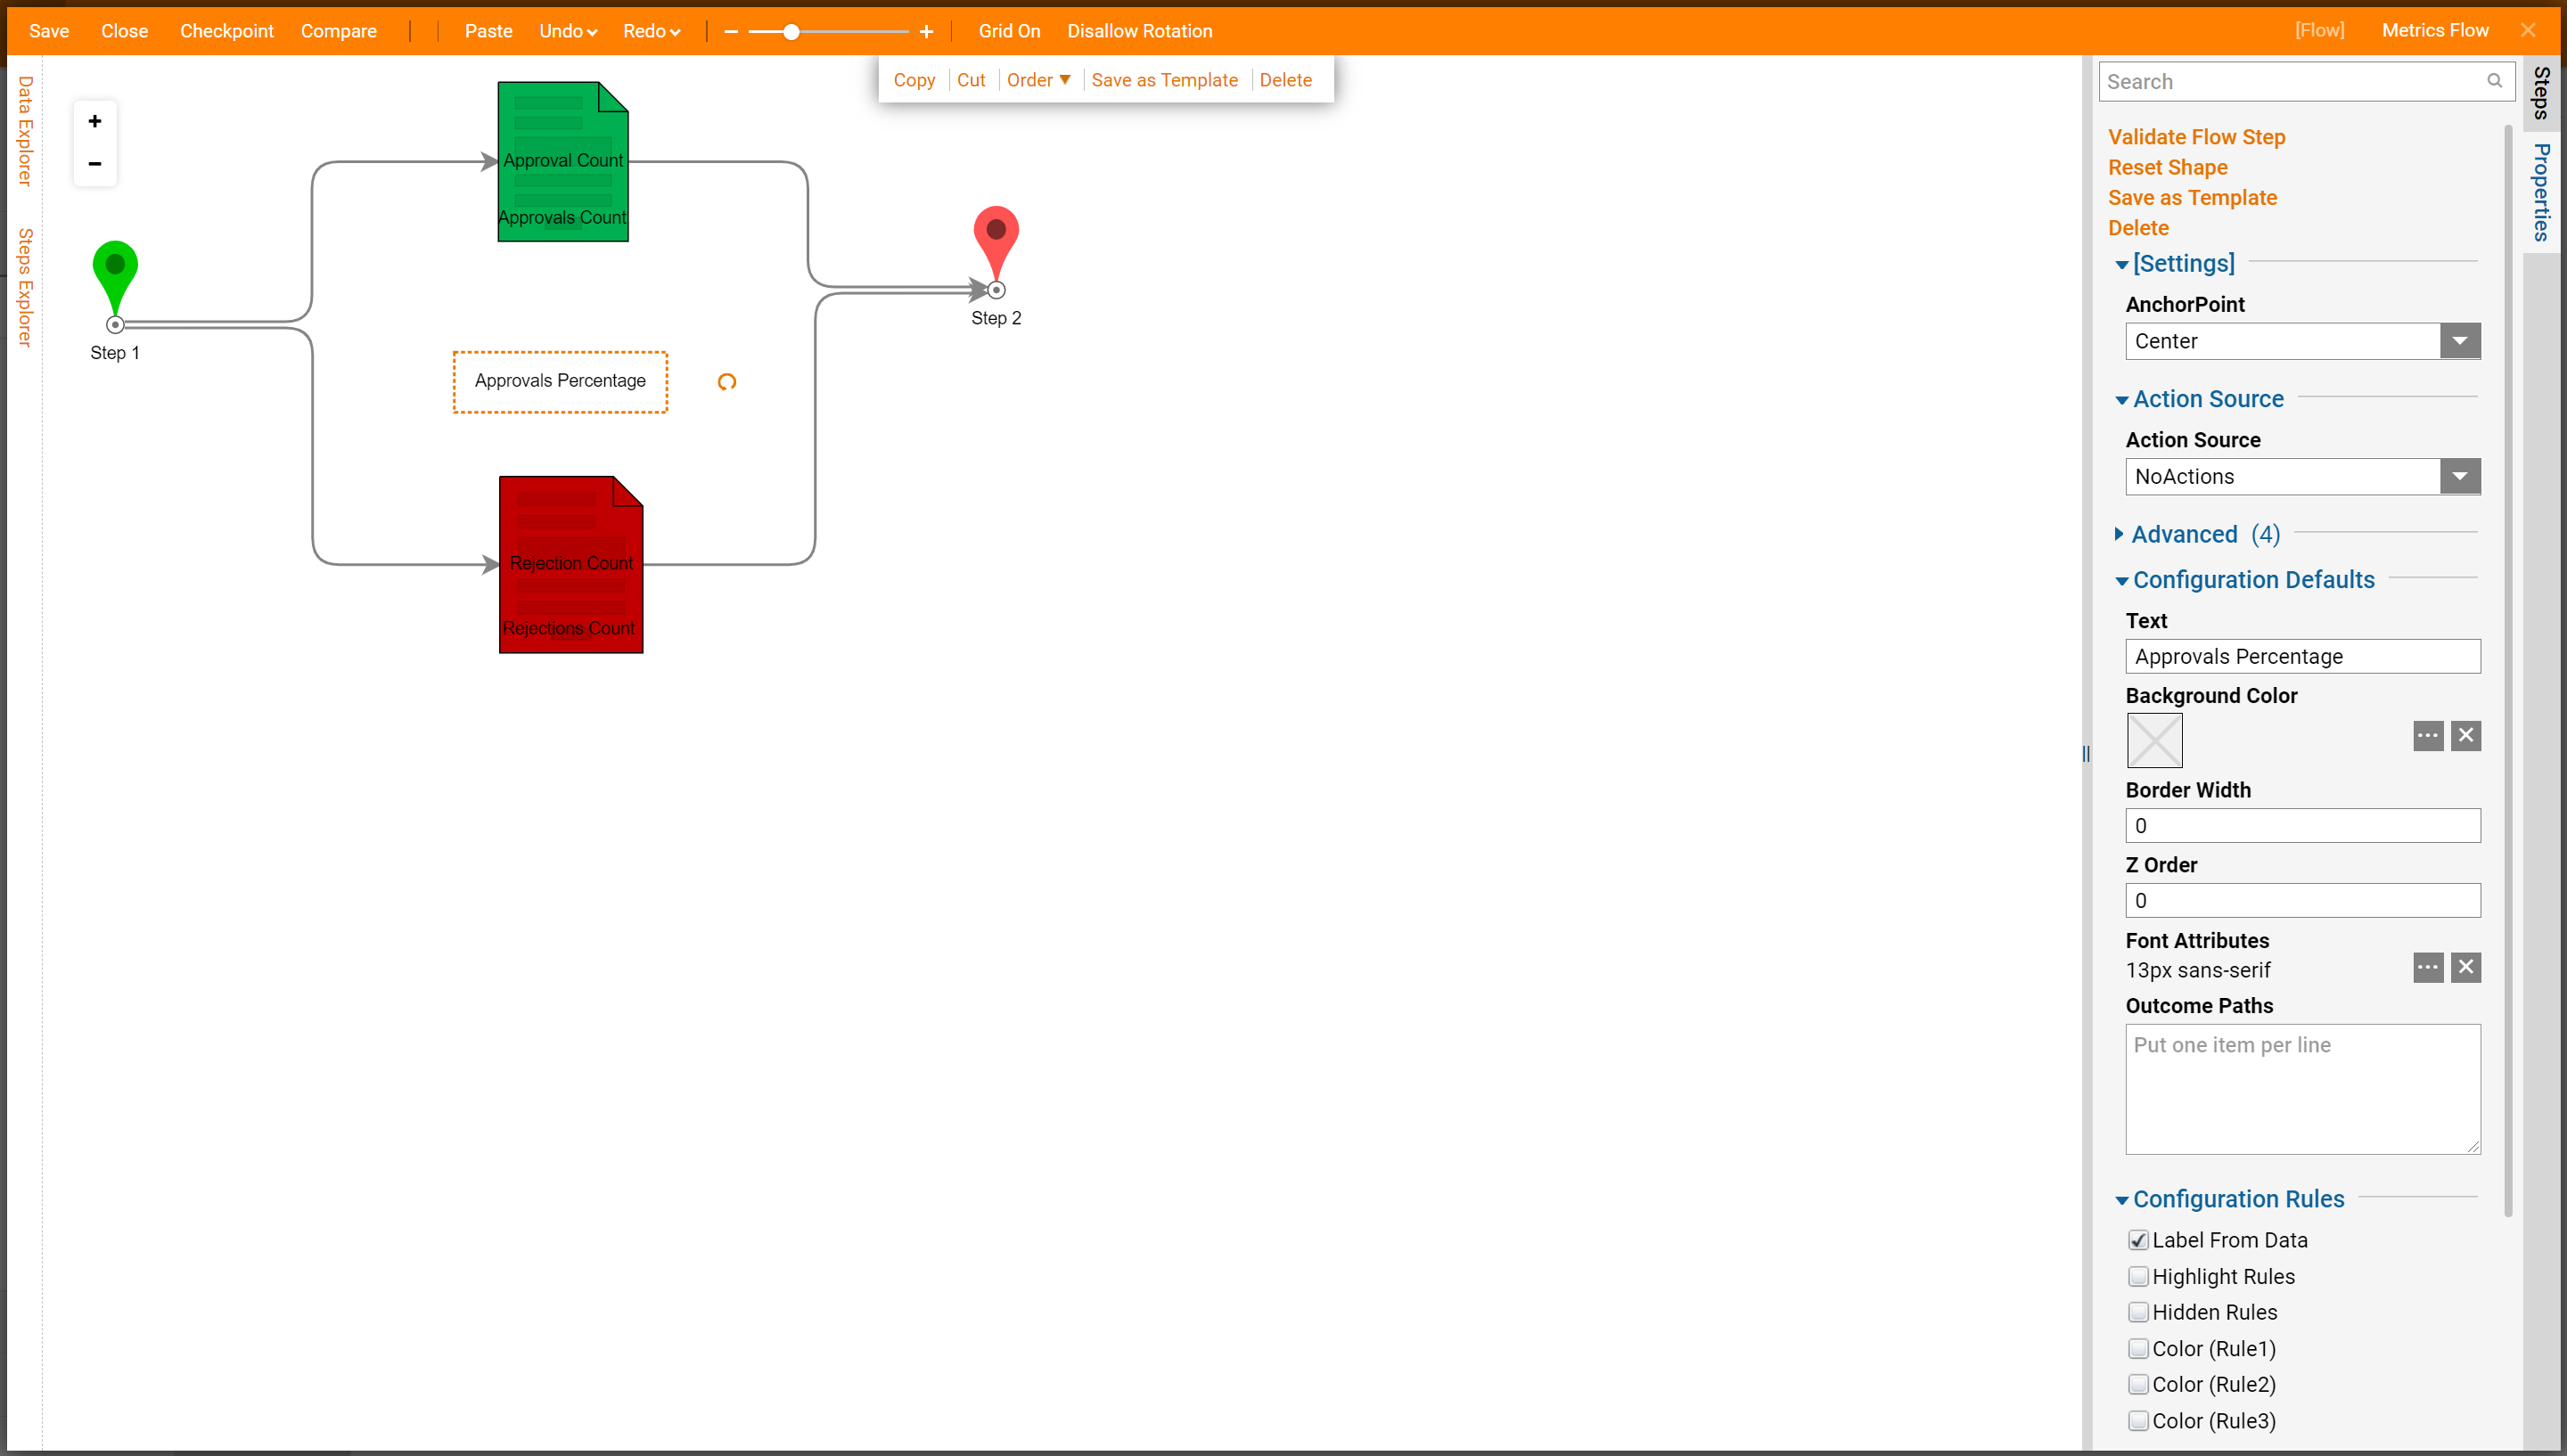
Add Approvals > Percentage to count the Approvals versus Rejections.
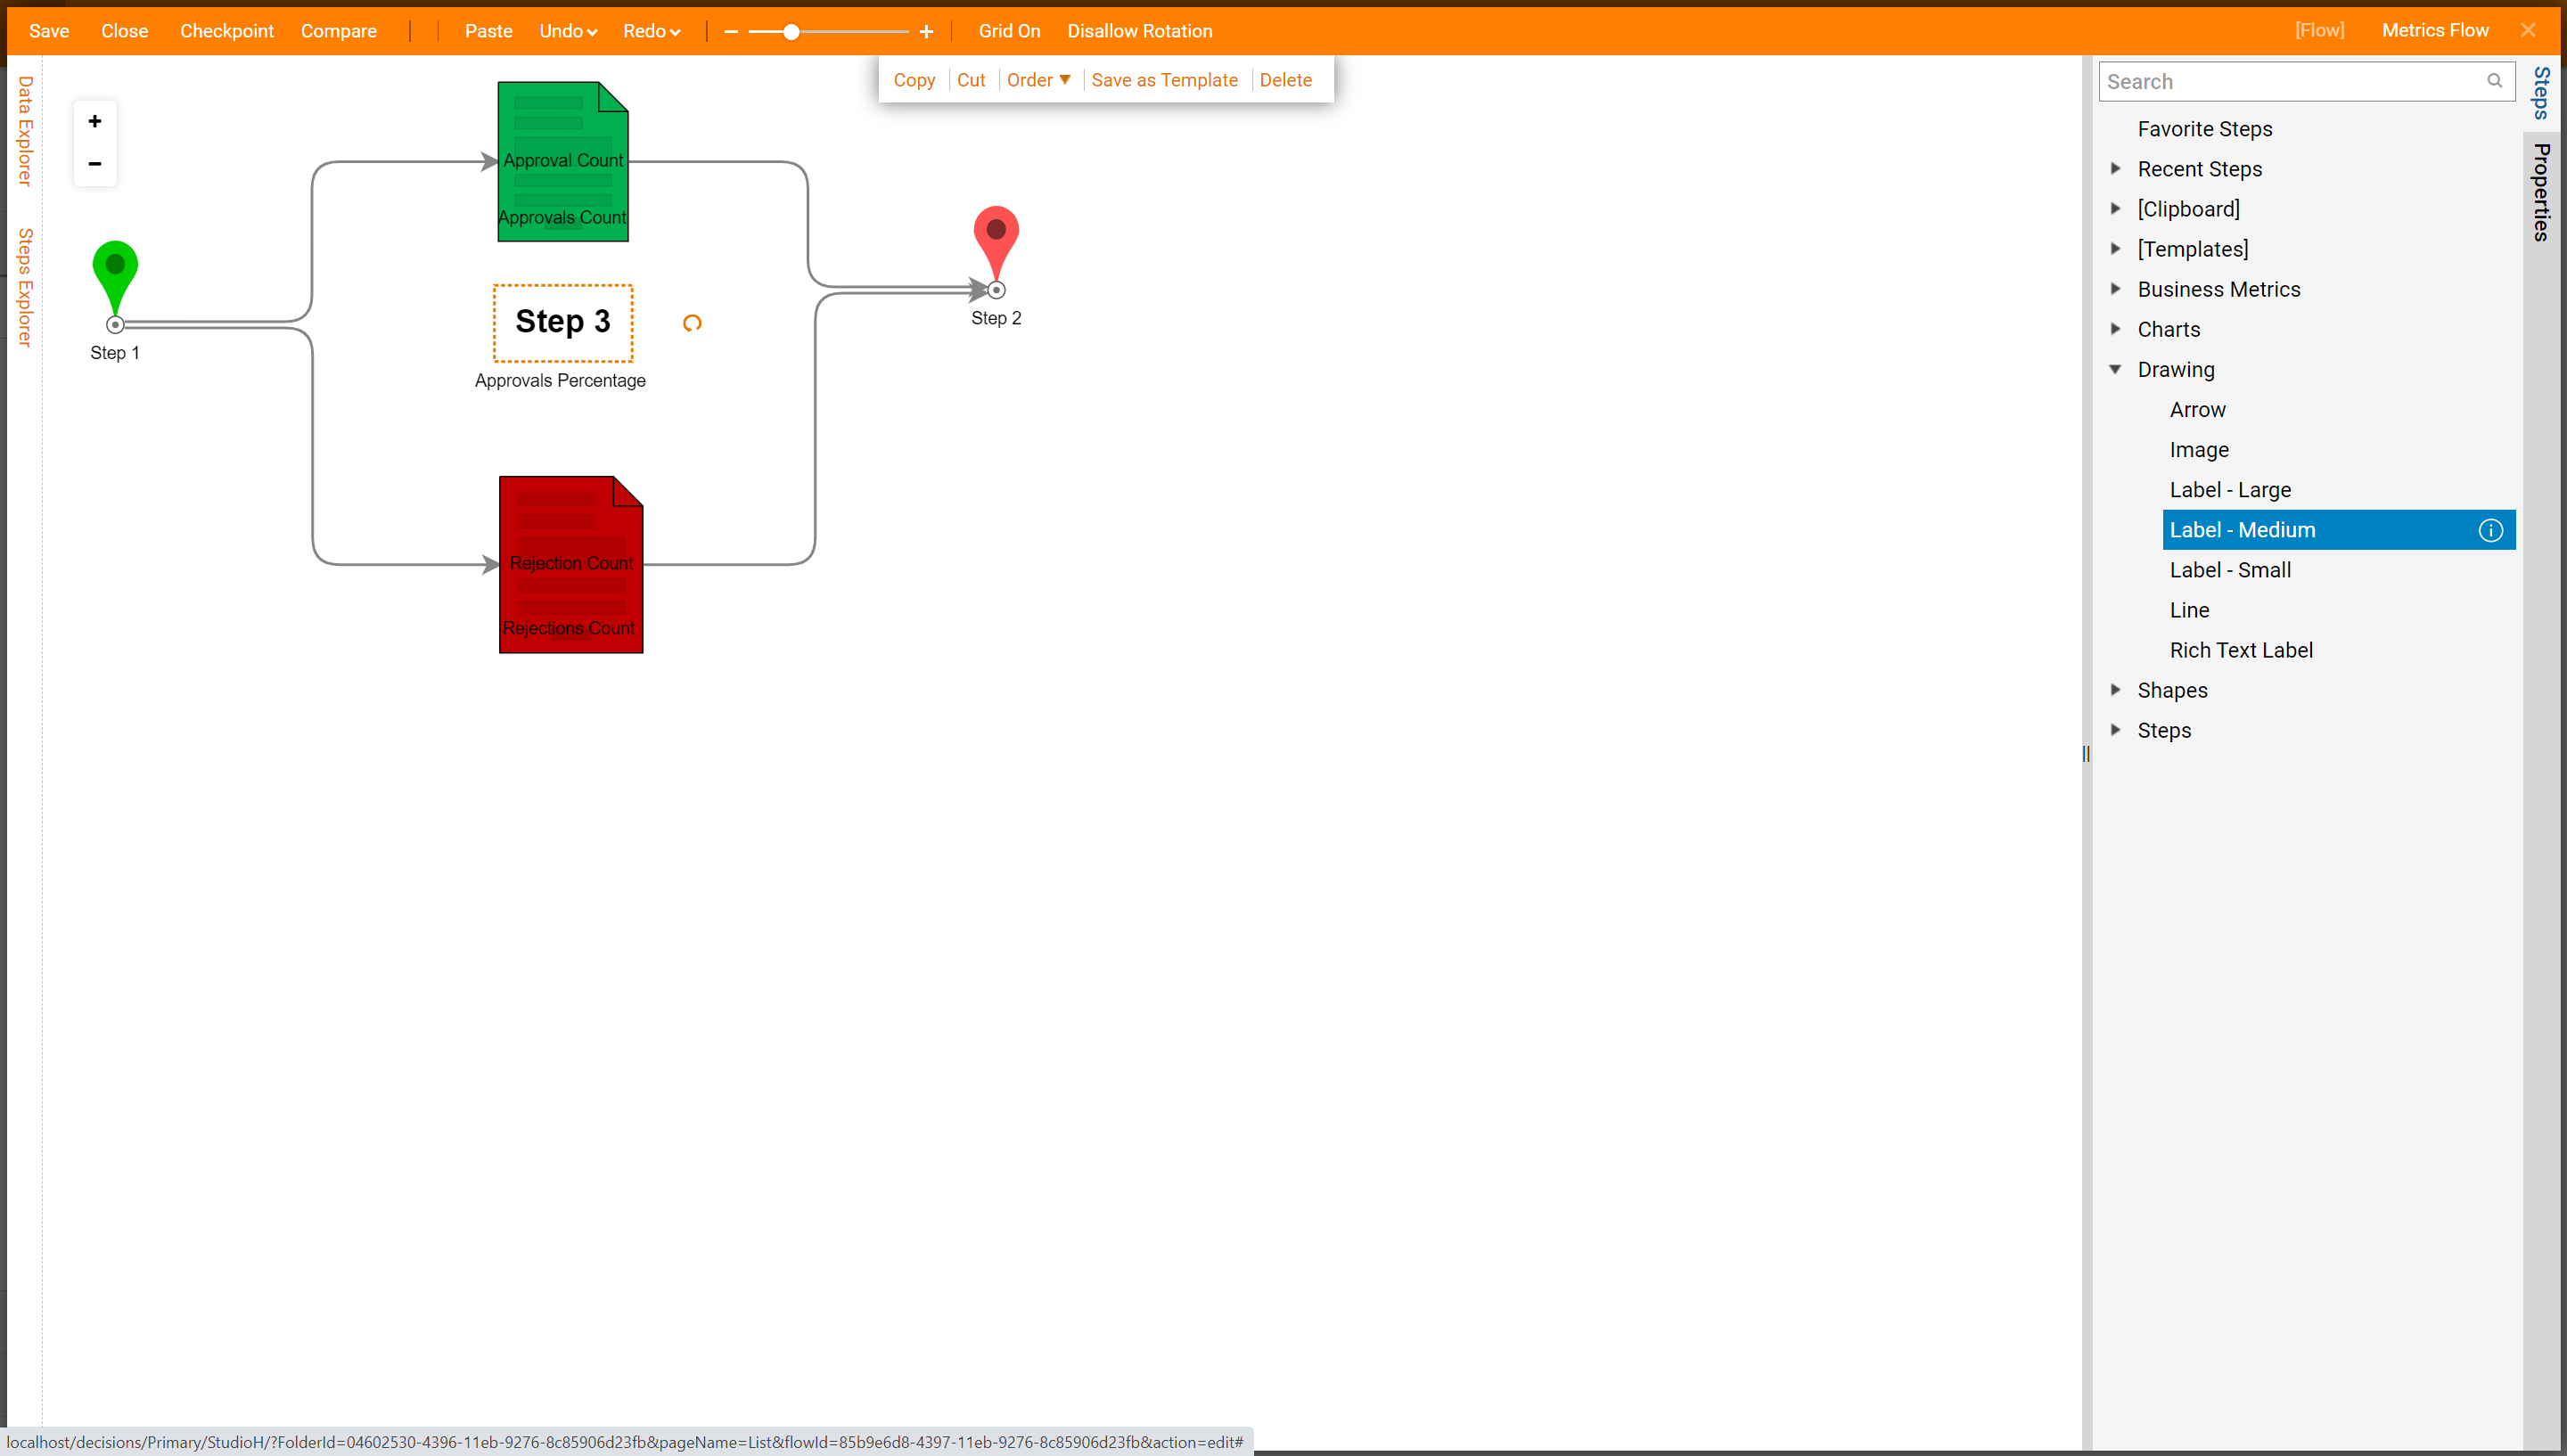
To apply labeling, under Steps navigate to Drawing > Label - Medium.
Save and close the Diagram Tile.
Back in the Designer Folder. Navigate to Manage > Page > Add Page Report.
To pick the entity select Pick and in the resulting window choose the proper choice and select Pick.
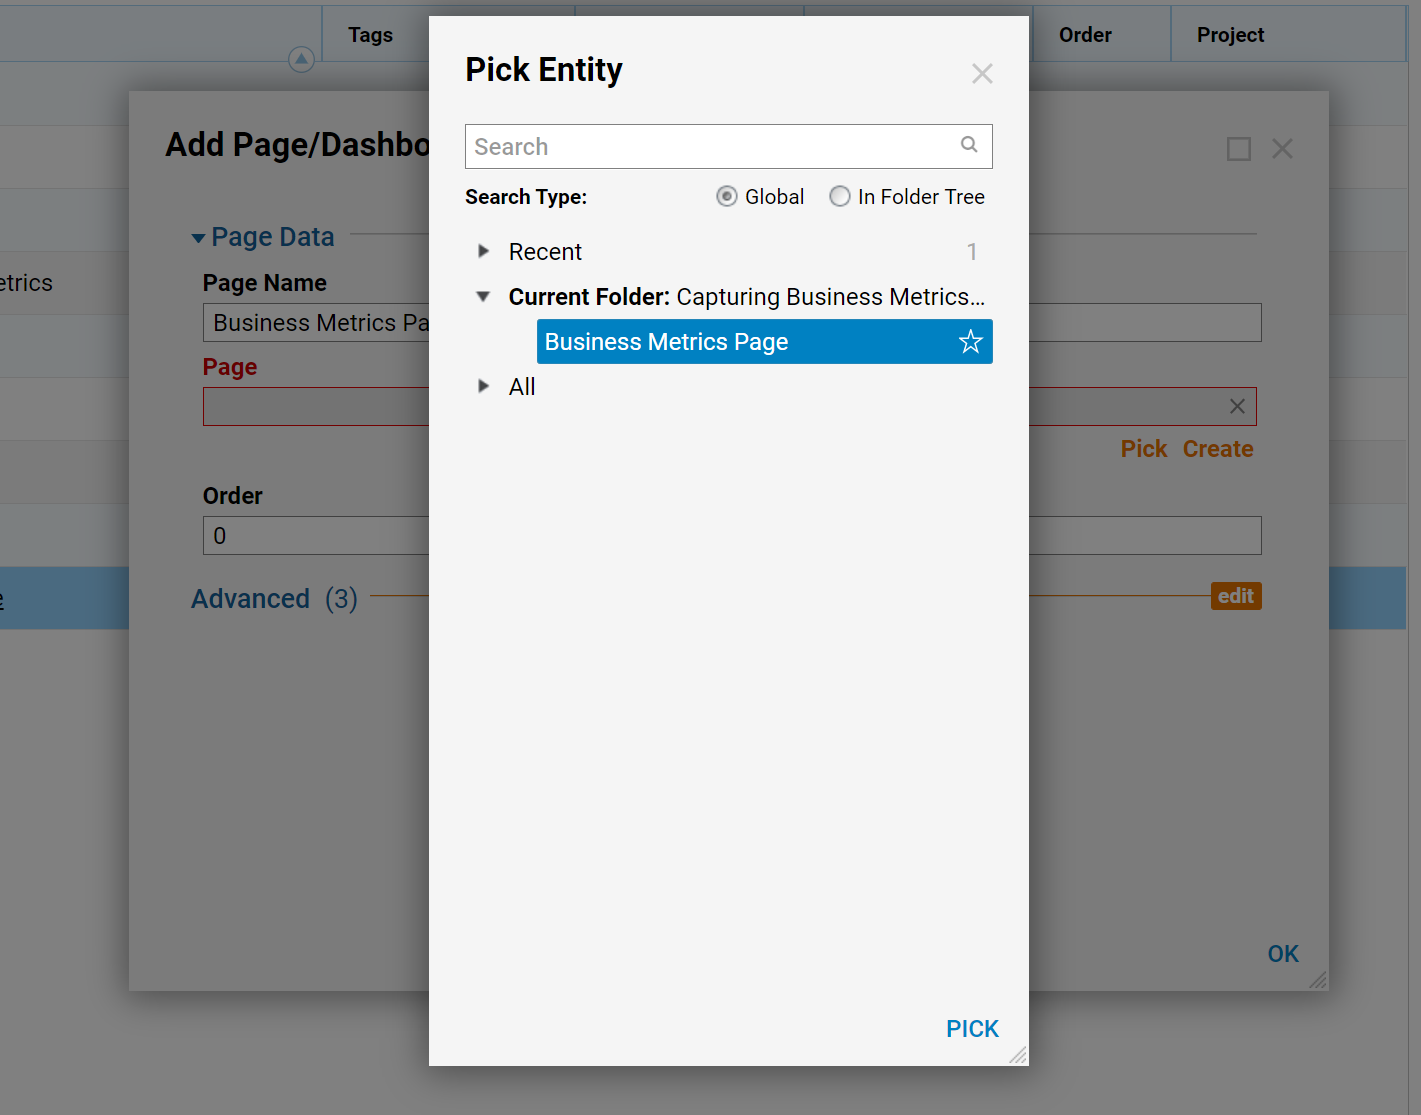
Select OK once done.
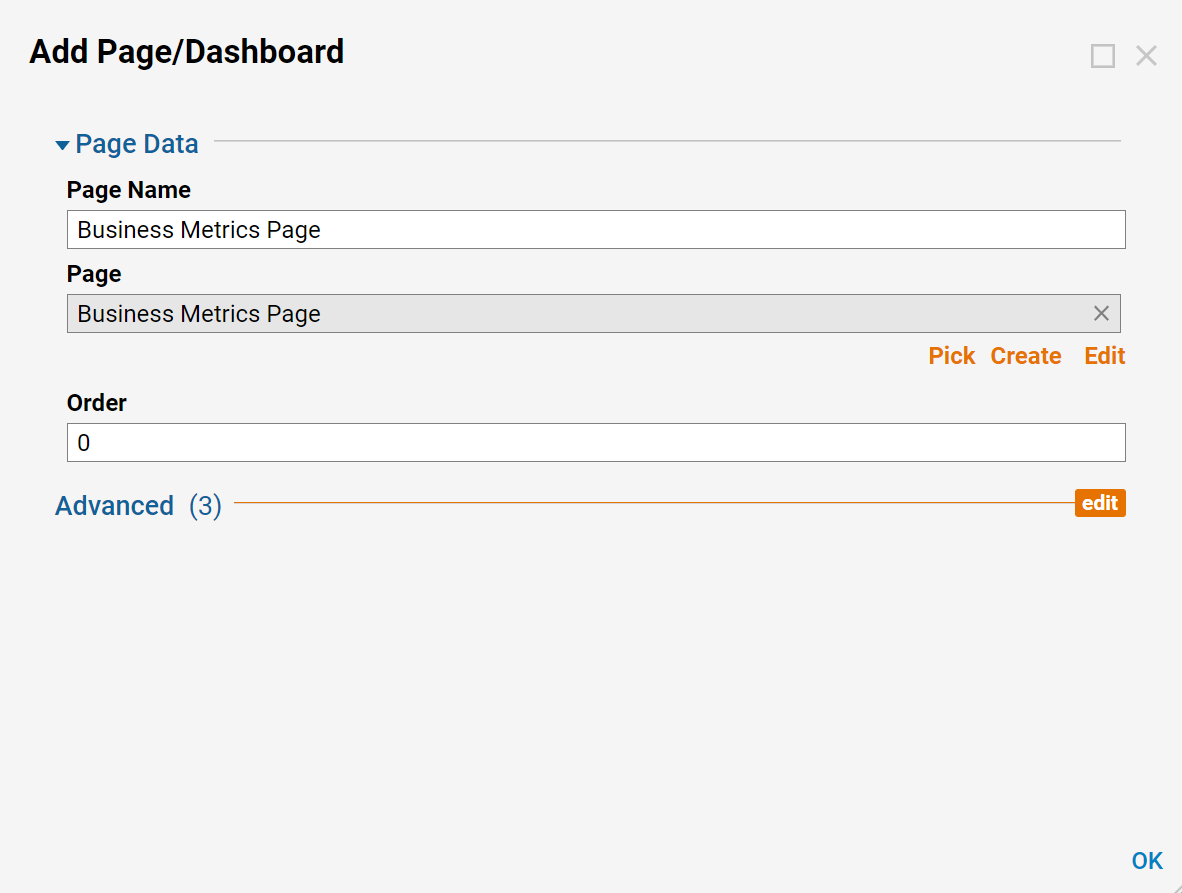
Select the Business Metrics Page in the View panel, the page with the tile part will display and the number will update every time the flow runs.
