Overview
Charts represent the report results in a graphical form. To enhance charts visually they can be configured in many ways; by changing the colors represented in the chart, adding titles and legends, and more.
Example
In this example, create a page and add a Chart to it, add a title and custom colors to the chart. Then add a Legend to the page.
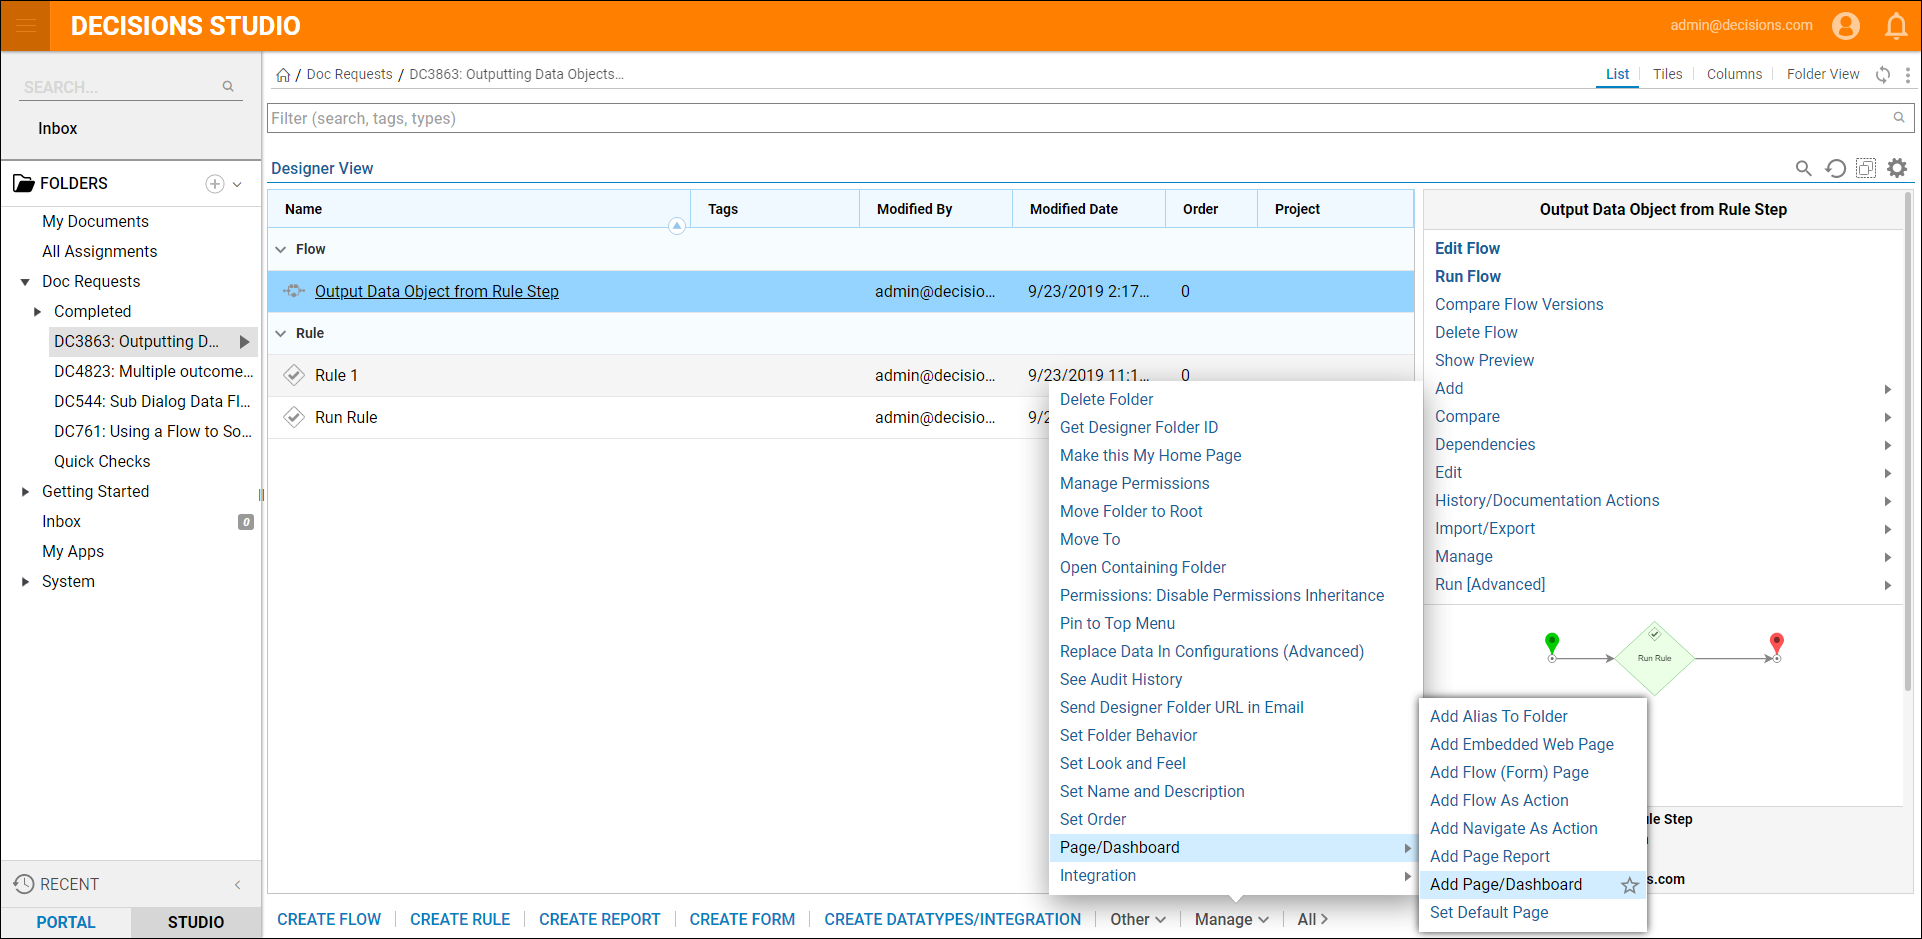
Begin by navigating to a Designer Folder and selecting Manage > Page/Dashboard > Add Page/Dashboard.
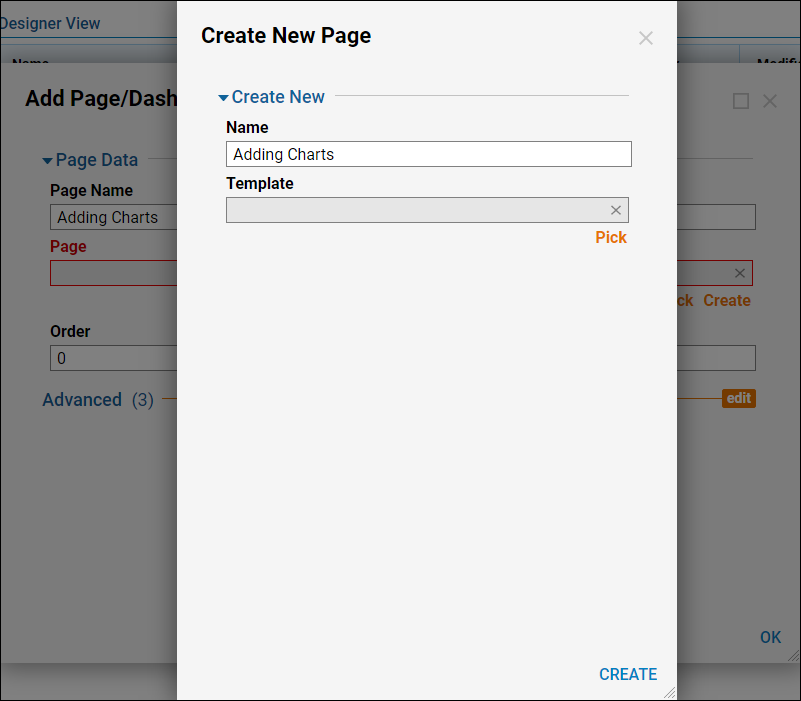
In the Add Page dialog, give the new page a name and select Create.
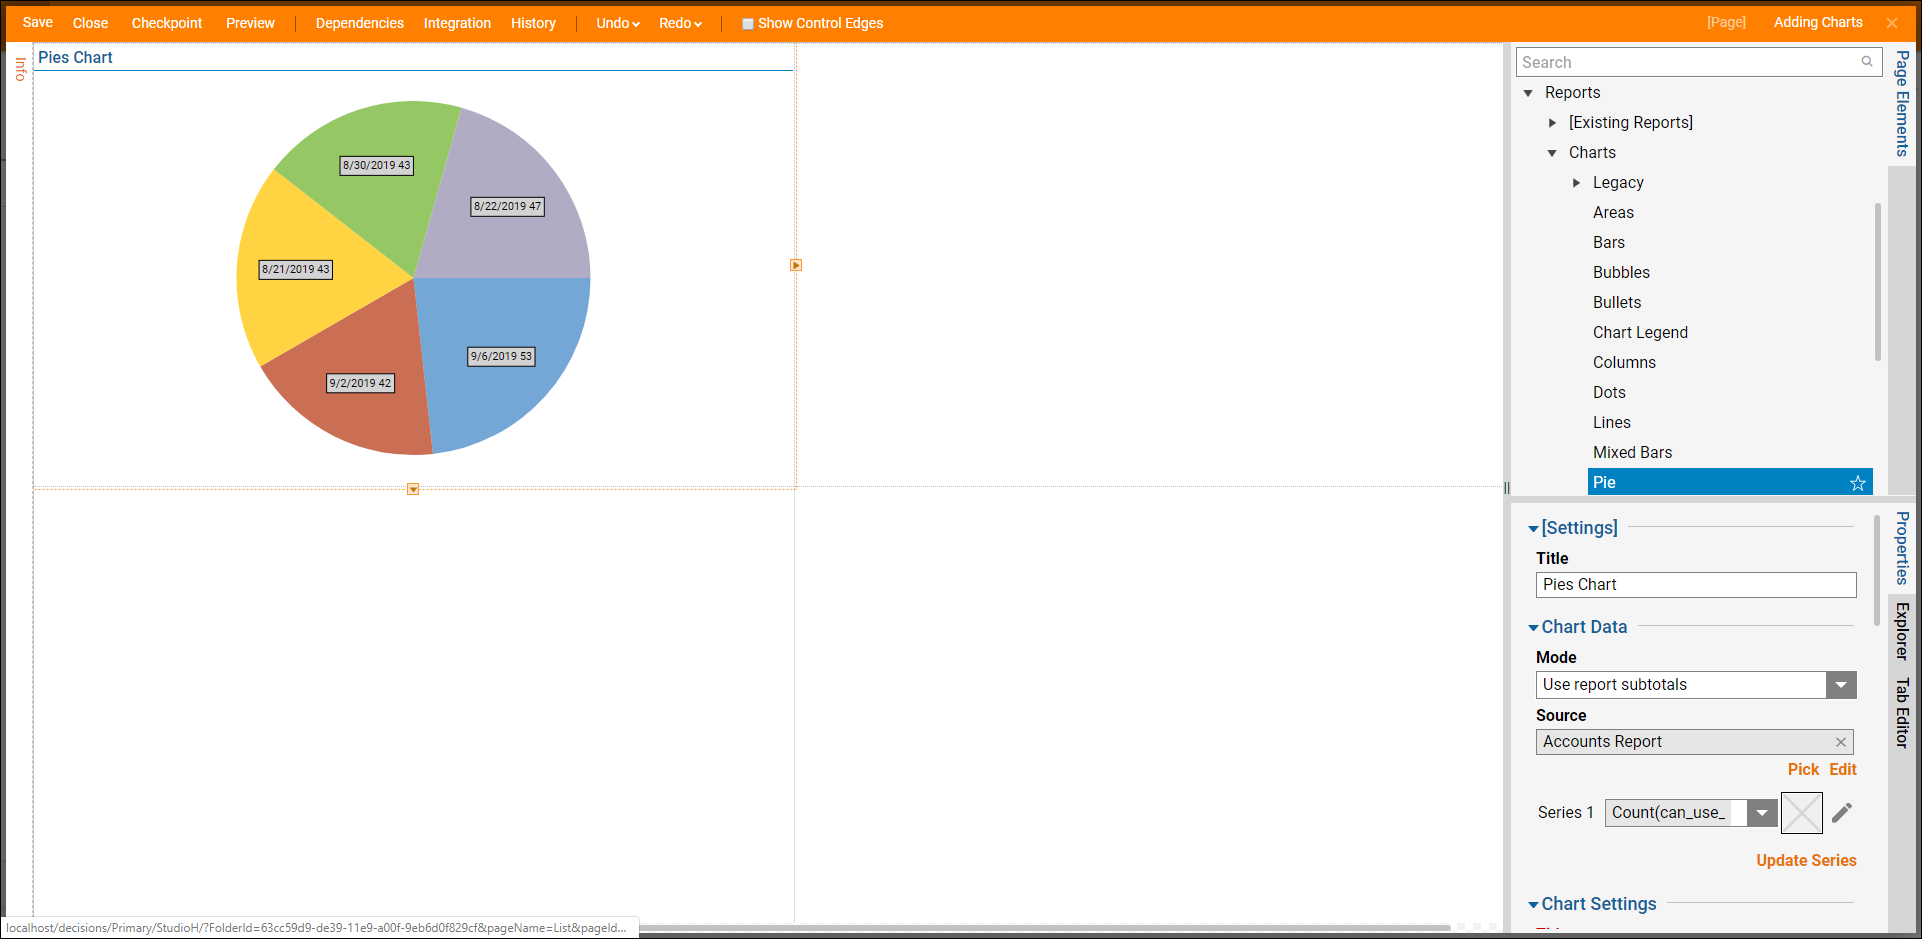
Add the first chart to the page by dragging the Pie chart element into the workspace. Find the Pie chart element by navigating to it via the Reports > Charts category of the Page Elements panel.
To set the data source for the Pie chart, select the element. Then, in the Properties panel under Chart Data > Source, select Pick.
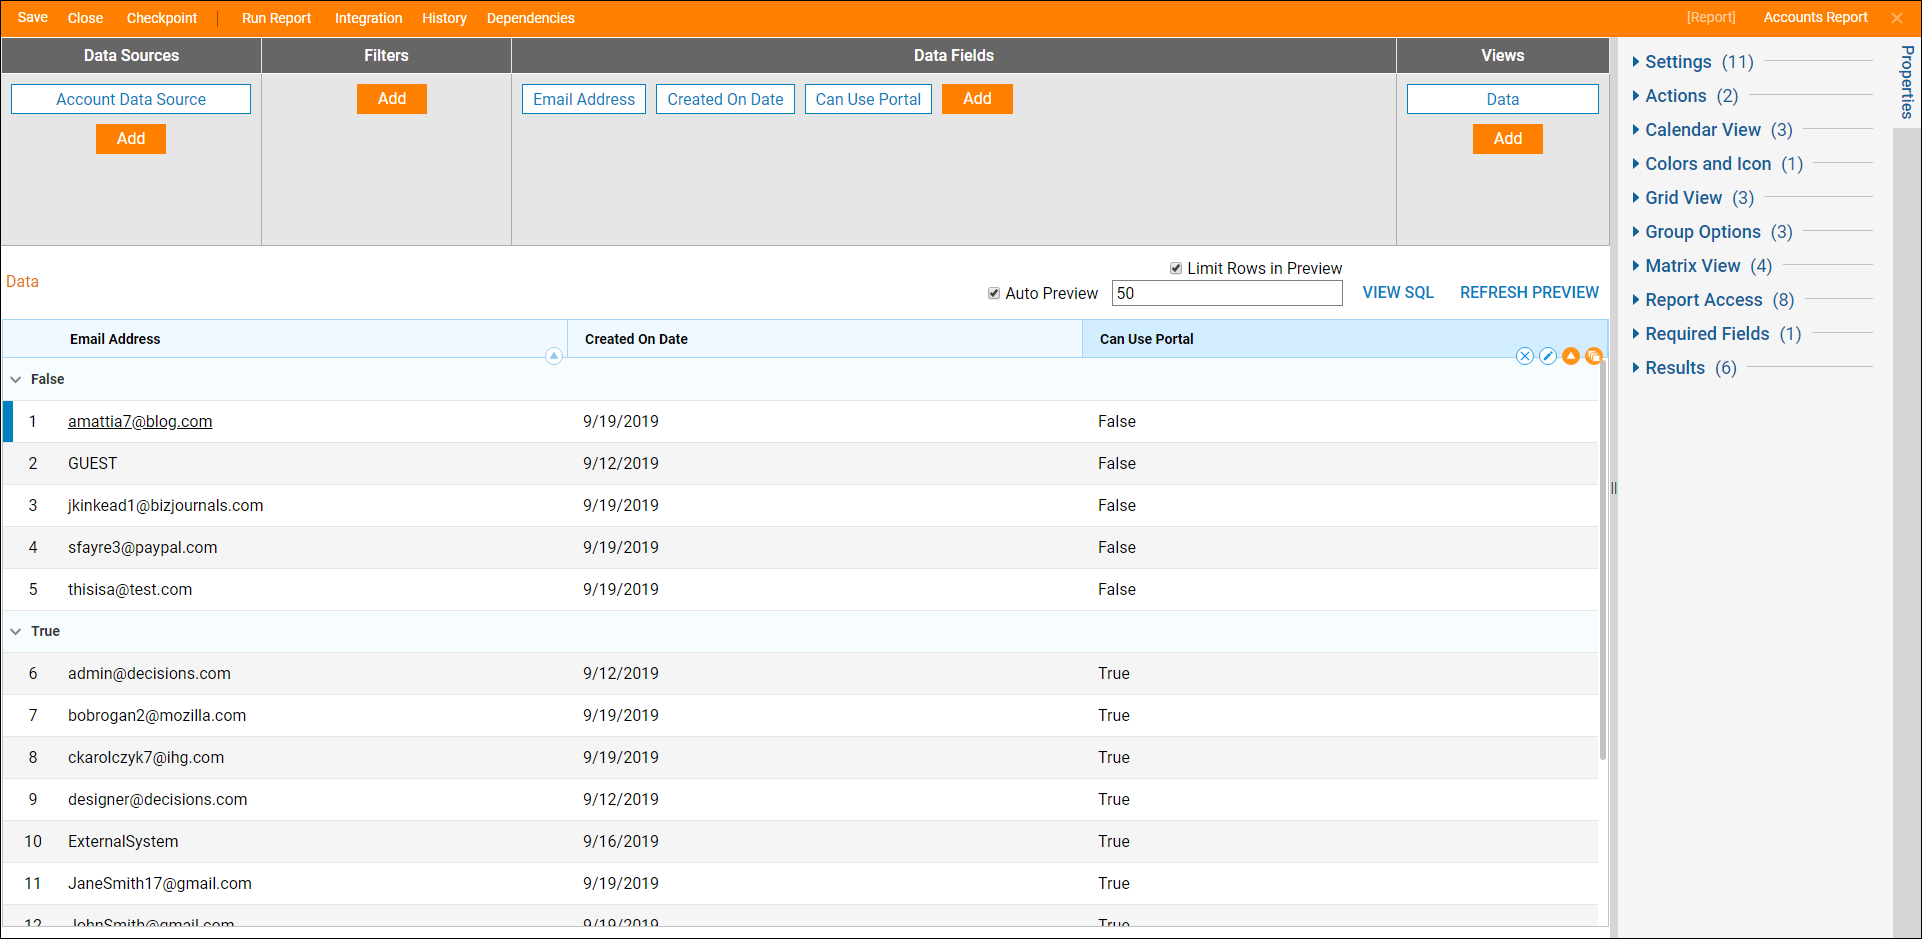
In the Pick Chart Source dialog, select the report to be used as the chart’s data source. Select Count (can_use_portal).
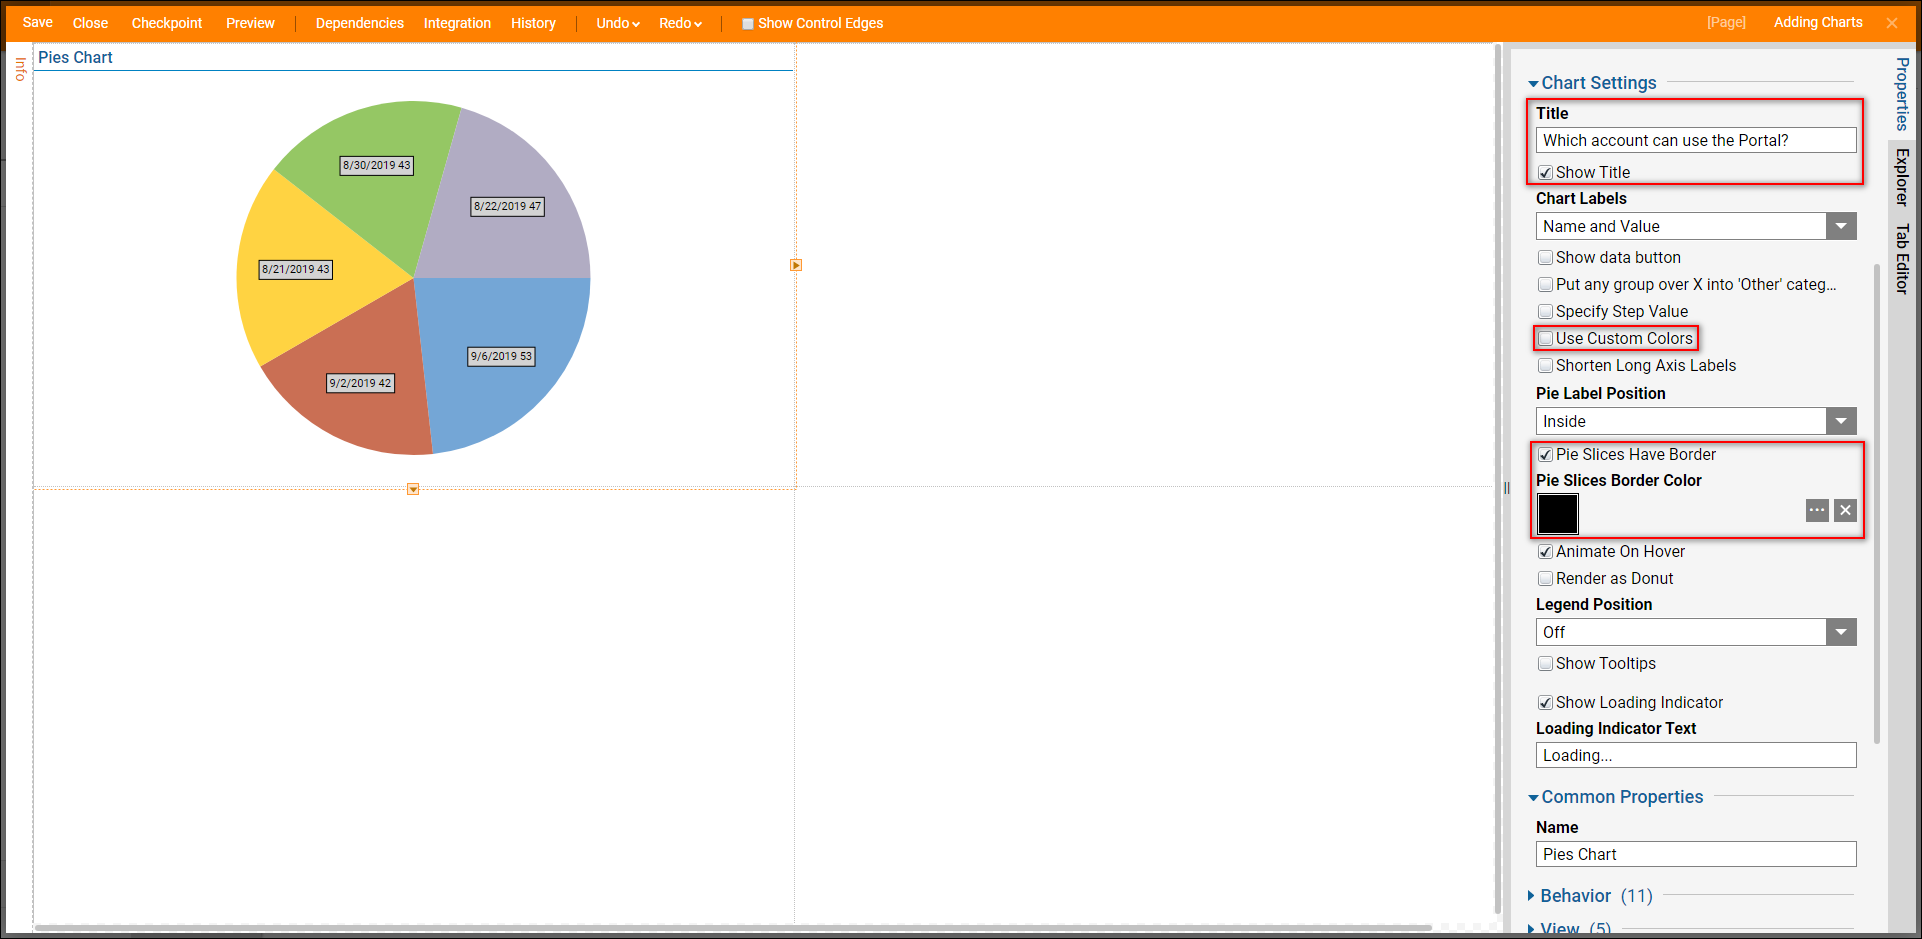
With the Pie chart selected in the Properties panel, under Chart Settings add a Title to the chart by setting the Show Title checkbox to true. Type "Which account can use the Portal?".
Next, there are many settings that can be configured, in this example select Pie Slices Have Border. Then to add custom color to the chart select Use Custom Color.
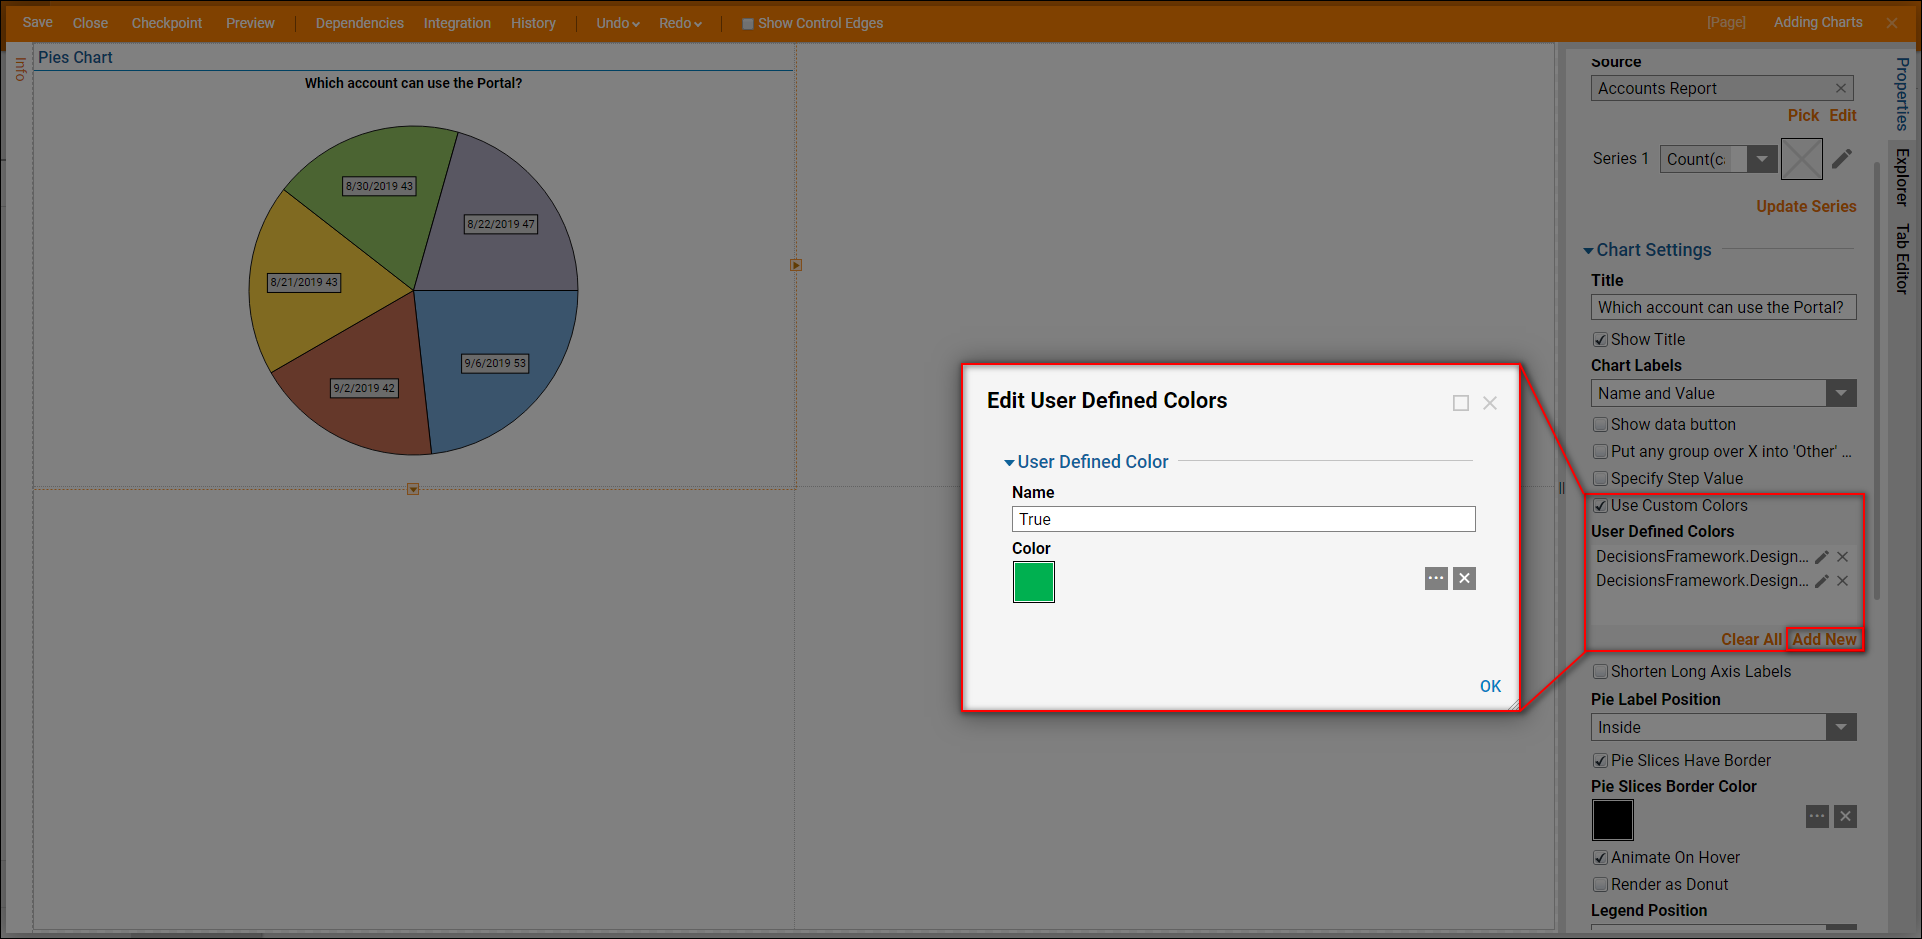
With the Use Custom Color checkbox set to true the User Defined Colors box will show. Under this box, select Add New.
In the Edit User Defined Color dialog, name the color after the piece of data the color will represent. In this example the Pie chart is grouped by a Boolean type, so two separate colors need defining: True (green) and False (red).
Select Ok to save the color definition.
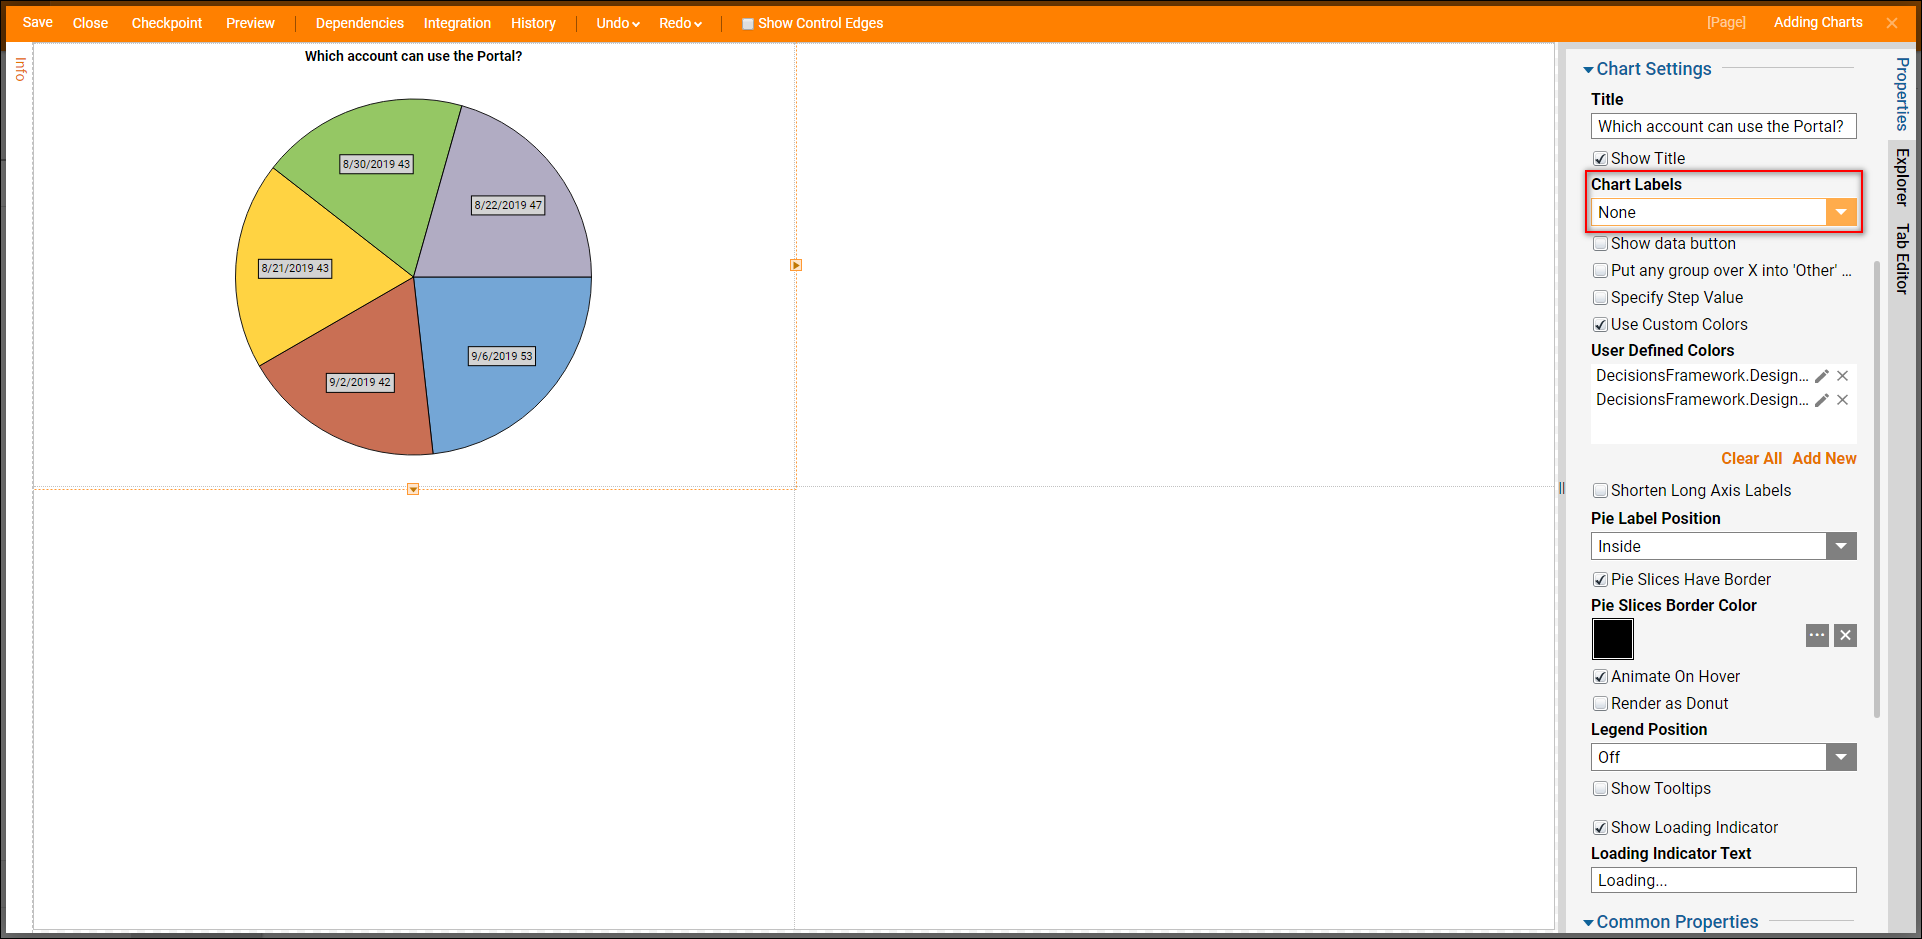
After the colors are defined, remove the chart labels by changing the Chart Label drop-down box to None. A legend will be added to the page to show what colors represent True or False.
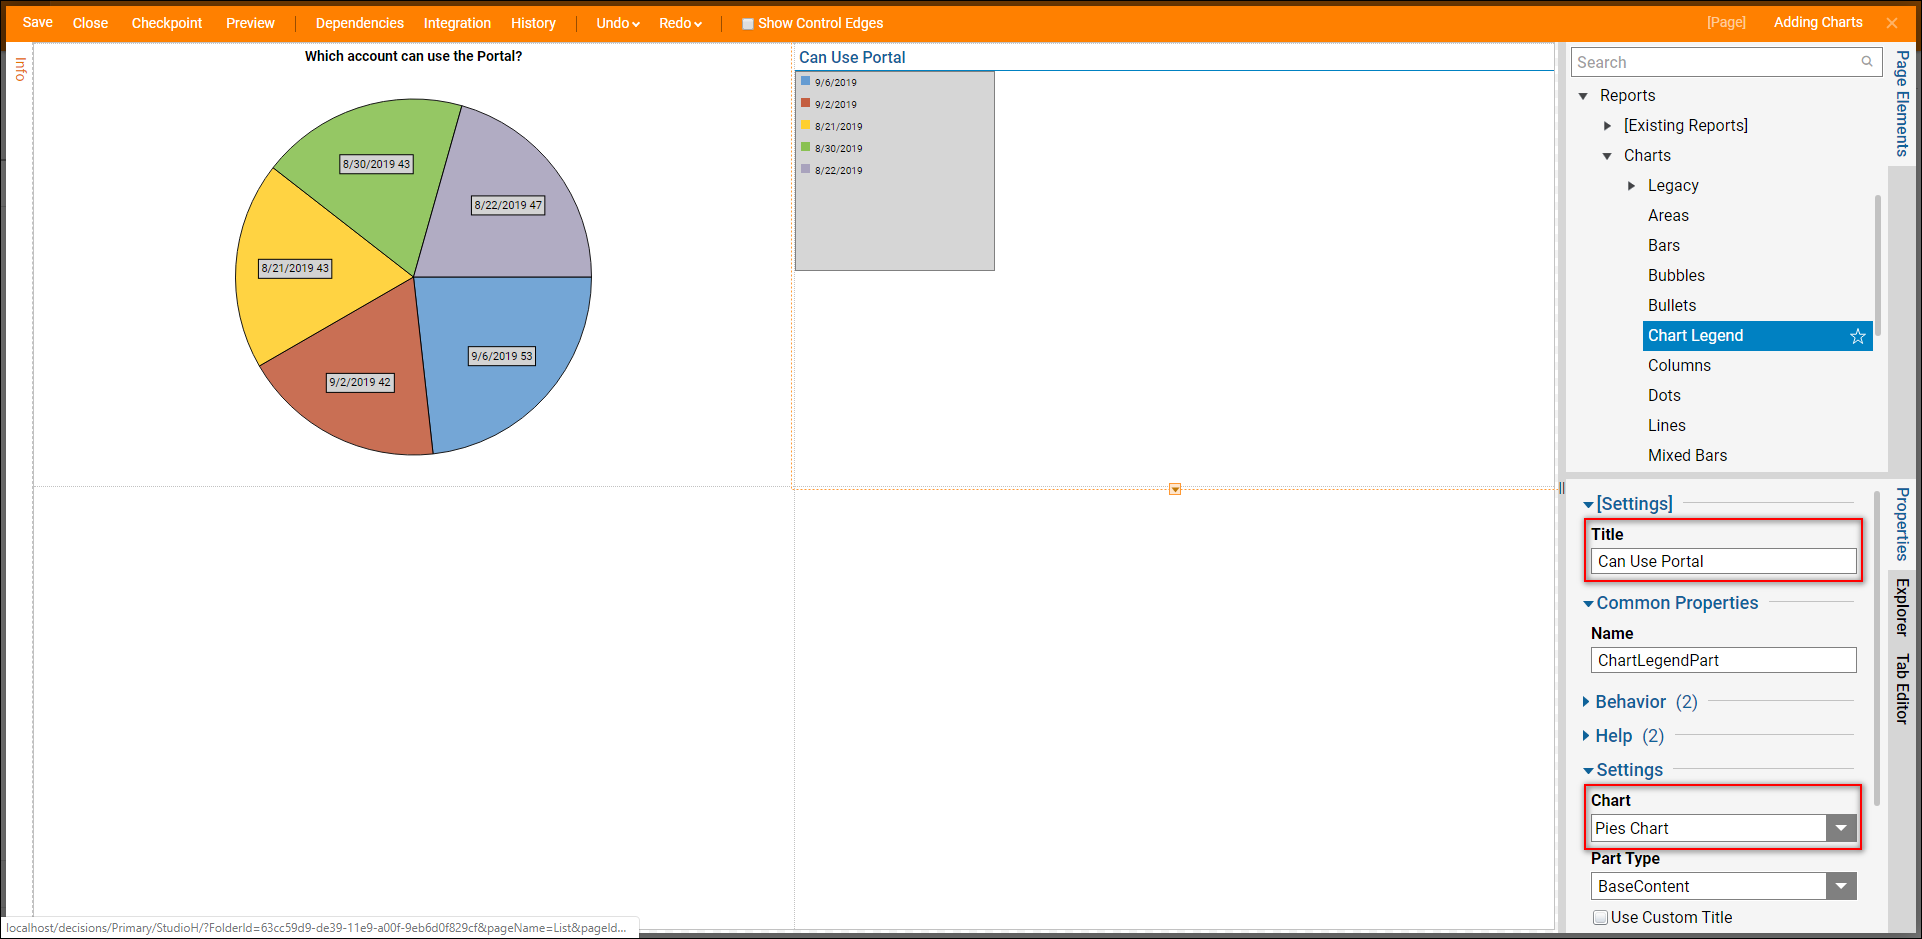
To add a Legend to the page, in the Page Elements panel under Reports > Charts drag and drop Legend to the Page. Give the Legend a Title, then under Settings > Chart choose the chart that the Legend will be referencing.
This completes the page, save it and close the Page Designer.
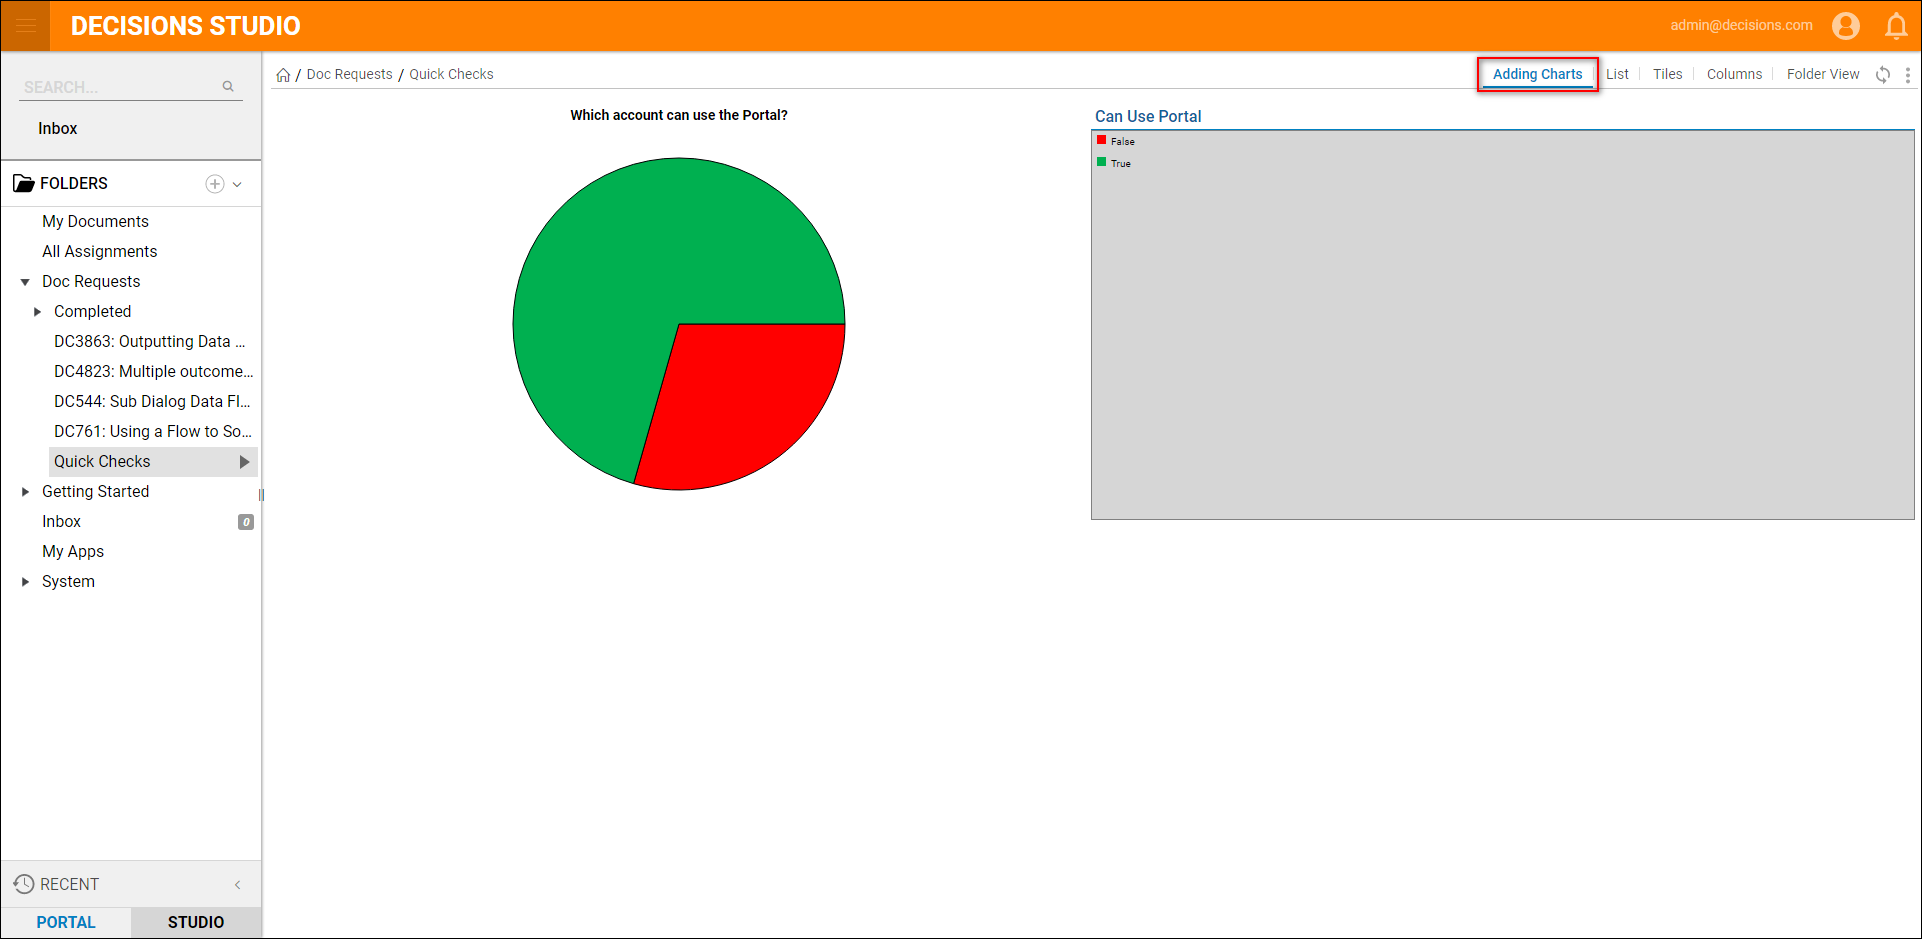
Back in the Designer Folder, to preview the page, select the page view that was created when the page was created.
The Pie chart and Legend show the data that was grouped in the report, the custom colors and the titles that were configured.