Project Download
Overview
In some instances, data must be added to a Flow before it can accurately populate a Chart when added to a Report. Chart Page controls have a Chart Data Mode property that enables Charts to display data on a Page. The Use Flow option allows Users to fetch and filter data that will be displayed as a chart using a Flow. The Flow behavior cannot be changed if it was created from the Page Designer's Properties panel. This type of Flow Behavior will output a list of ChartRenderData.
ChartRenderData consists of a single series of data for the chart. This allows Users to customize different series differently. Each series contains different pieces of the chart; for example, the slices on a Pie Chart are individually structured as the ChartDatum type. A series of ChartRenderData contains a list of ChartDatum.
The ChartDatum type comprises several fields: Title, Label, and Display Label. These fields can all be mapped in and treated as the same value. The boolean value, Navigable, determines whether or not something can be drilled into when selected. The decimal value is the actual amount allotted to that piece of the chart.
Users can populate a chart component on a Page using a Flow by selecting the Use Flow option under the Mode setting under Chart Data. The Use Flow option allows Users to fetch and filter data that will be shown on a chart.
Explanation
The Fetch Entities steps fetch Accounts by User Types of Person and Machine. The Subflow creates the series for the chart using ChartRenderData.
Each individual ChartRenderData makes up one series of data for the Chart; this allows the user to customize different series differently. Each series contains different pieces of the Chart; for instance, the slices on a Pie Chart are individually structured as the ChartDatum type. A series of ChartRenderData contains a list of ChartDatum. In this ChartDatum type, there are several fields: Title, Label, and Display Label that can all be mapped in and treated as the same value. The boolean Navigable determines whether or not something can be drilled into when selected. The Value decimal is the actual amount allotted to that piece of the chart.
Steps
Setting up the Page
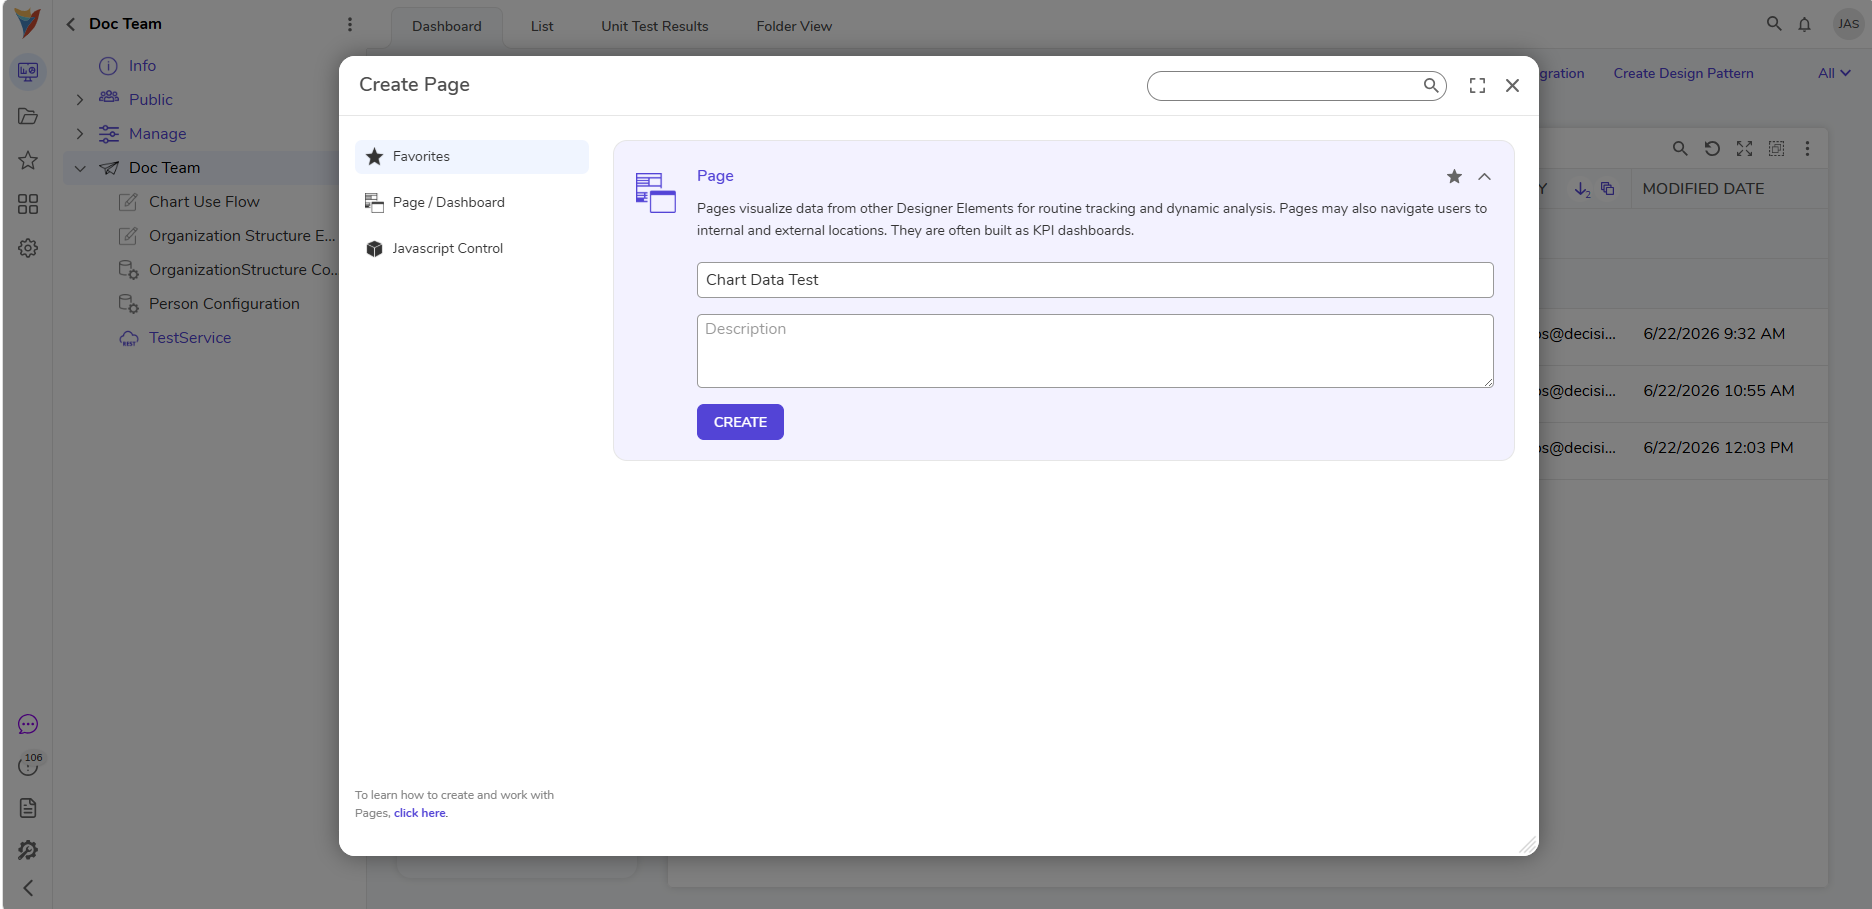
- In a Project, select CREATE PAGE. Choose a name for the Page and proceed to the Page Designer.
- From the Page Designer, navigate to the Toolbox > Favorites section and drag a Pie Chart control to the workspace.
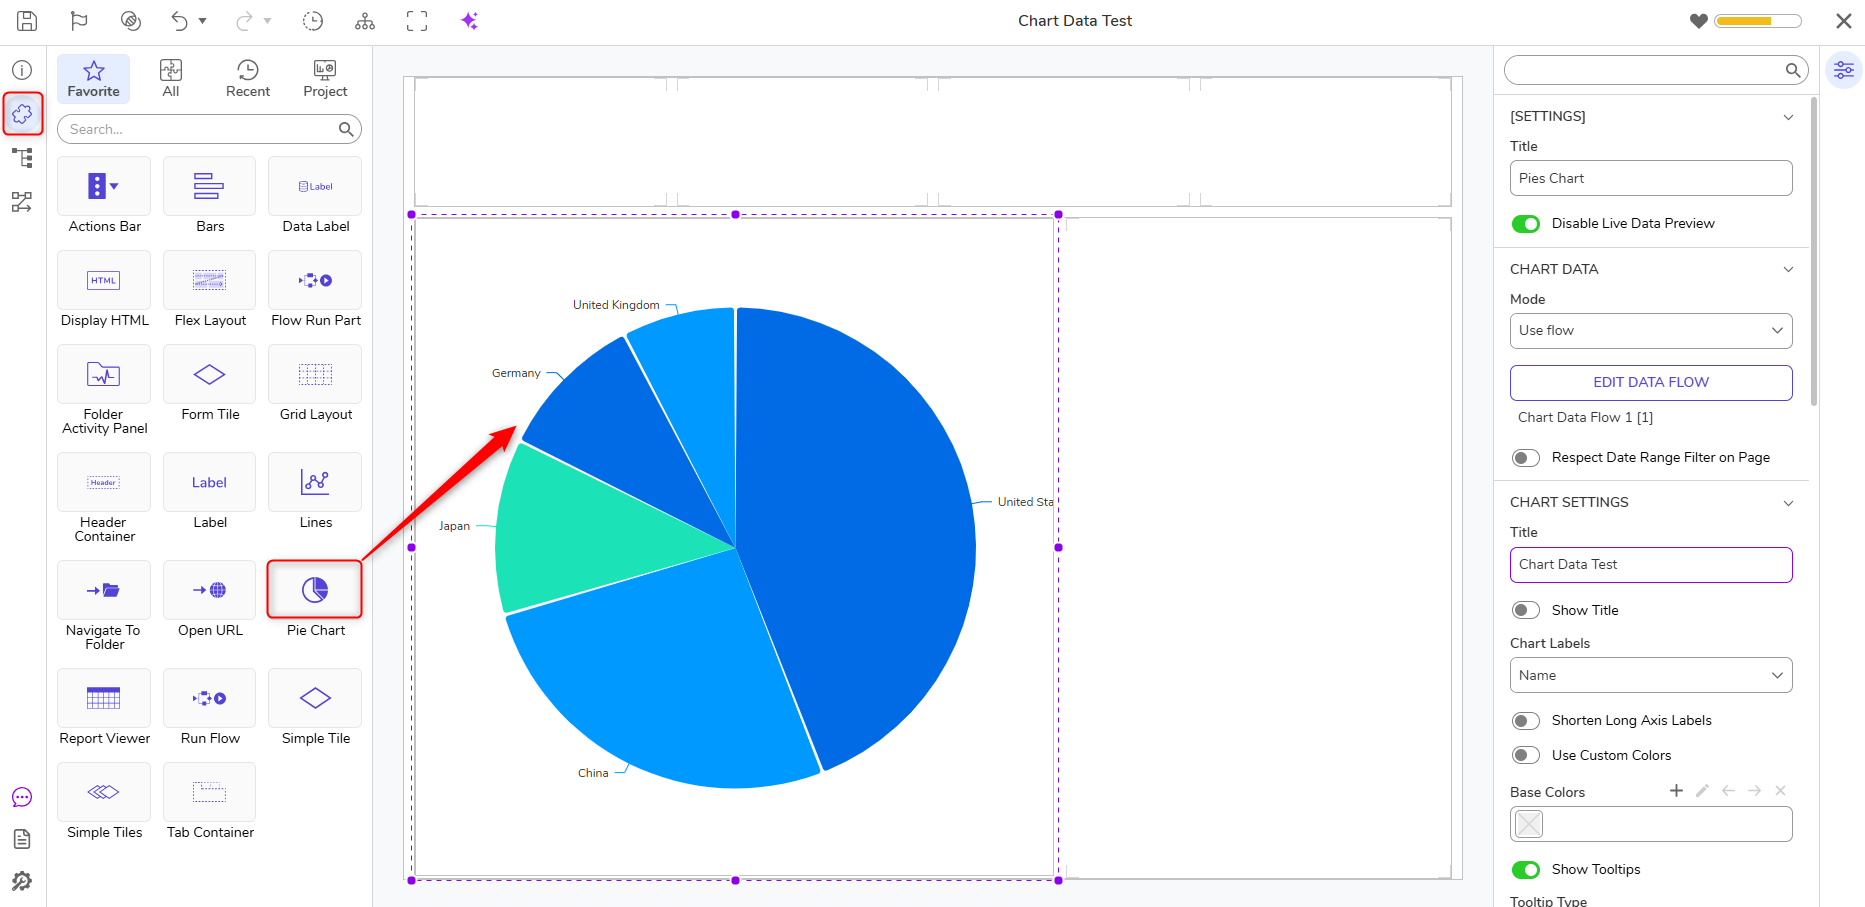
- On the Properties panel, navigate to CHART DATA > MODE and use the dropdown to select USE FLOW.
.png)
- Name the Chart Data Flow and select CREATE again to create a new Flow.
Creating the ChartDatum Main Flow
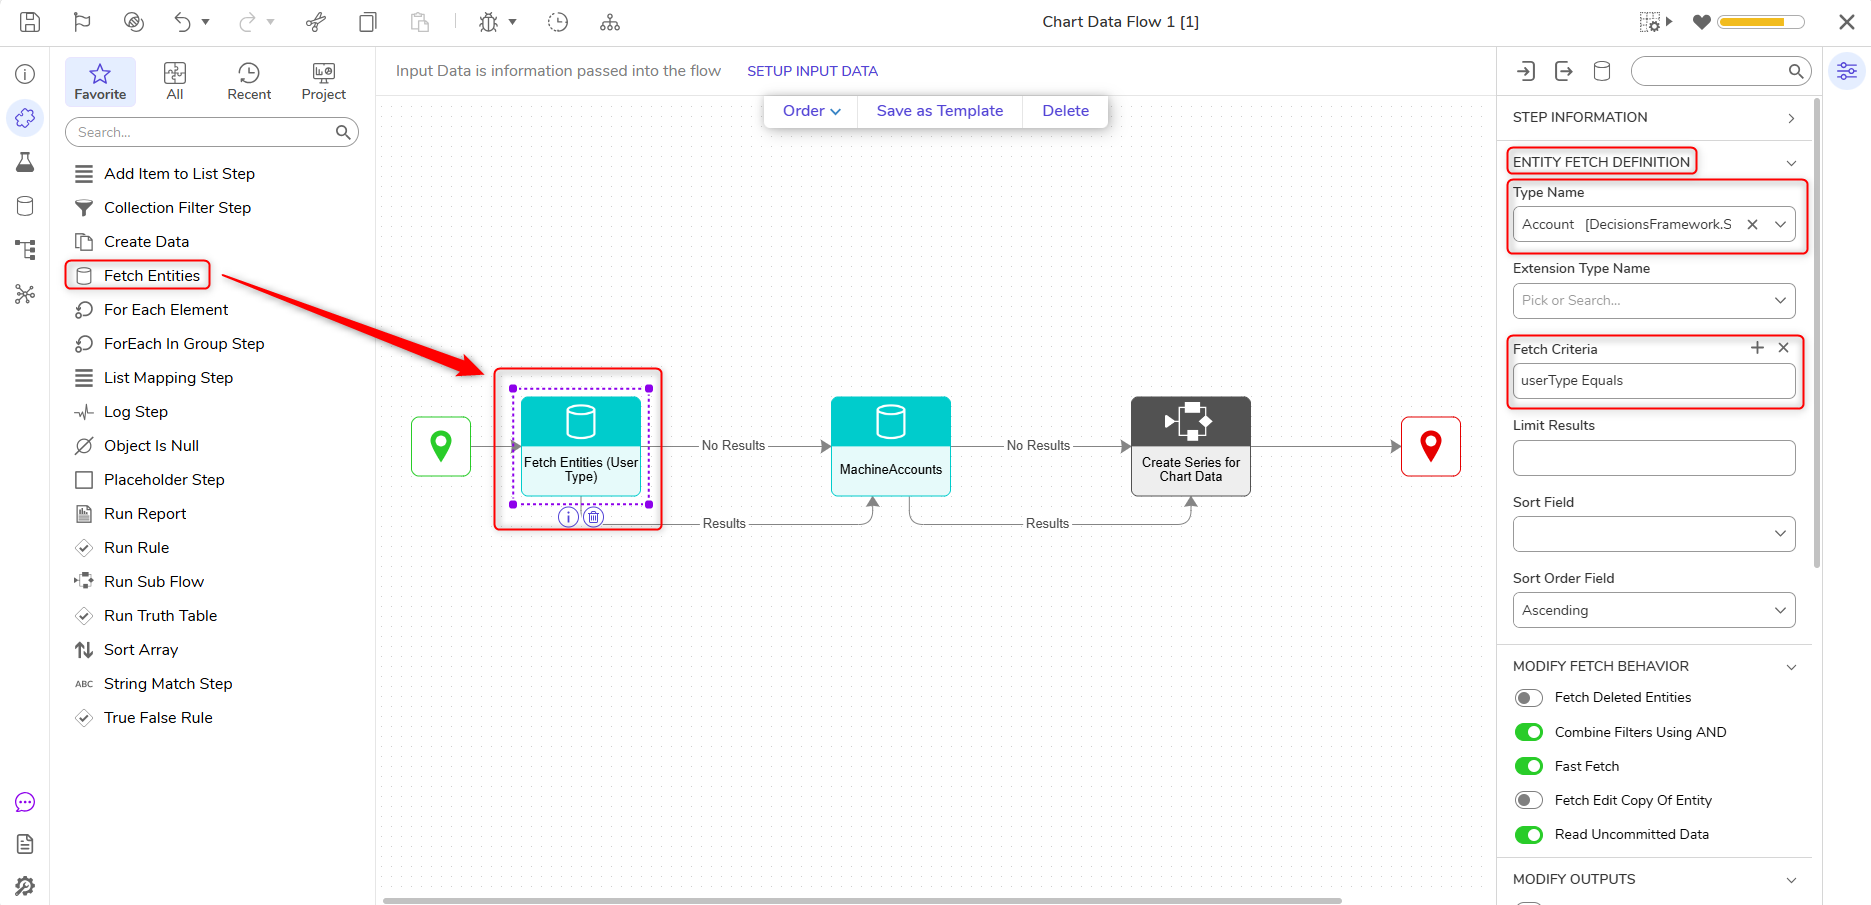
- From the Flow Designer, navigate to the Toolbox > Database section and drag and drop the Fetch Entities step on the workspace.
- In the Properties panel > Entity Fetch Definition > Type Name drop-down menu, search for Account using All/Search.
- Scroll to Entity Fetch Definition > Fetch Criteria and click ADD.
- In the next window, use the drop-down to locate usertype in the Field Name drop-down menu. Click OK.
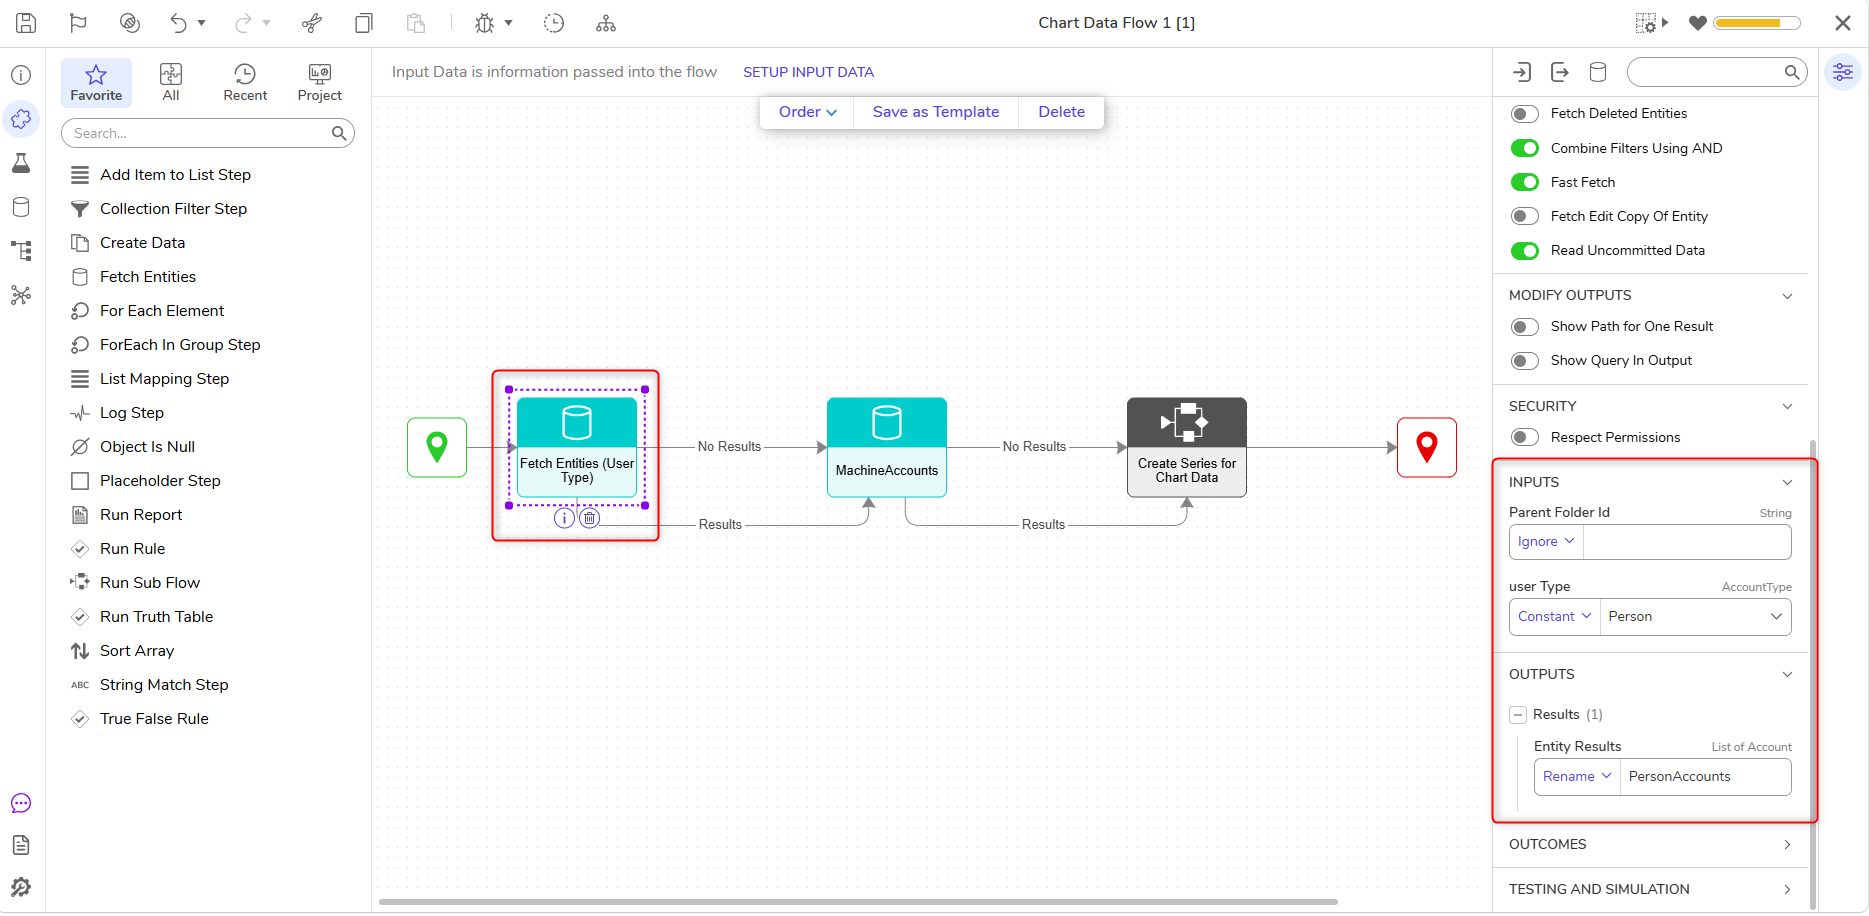
- Under INPUTS > usertype, change the input mapping to constant select Person.
- Rename the Output to PersonAccounts.
- Add another Fetch Entities Step and connect it to the Results path of the First step.
- In the Properties panel > Entity Fetch Definition > Type Name drop-down menu, search for Account using All/Search.
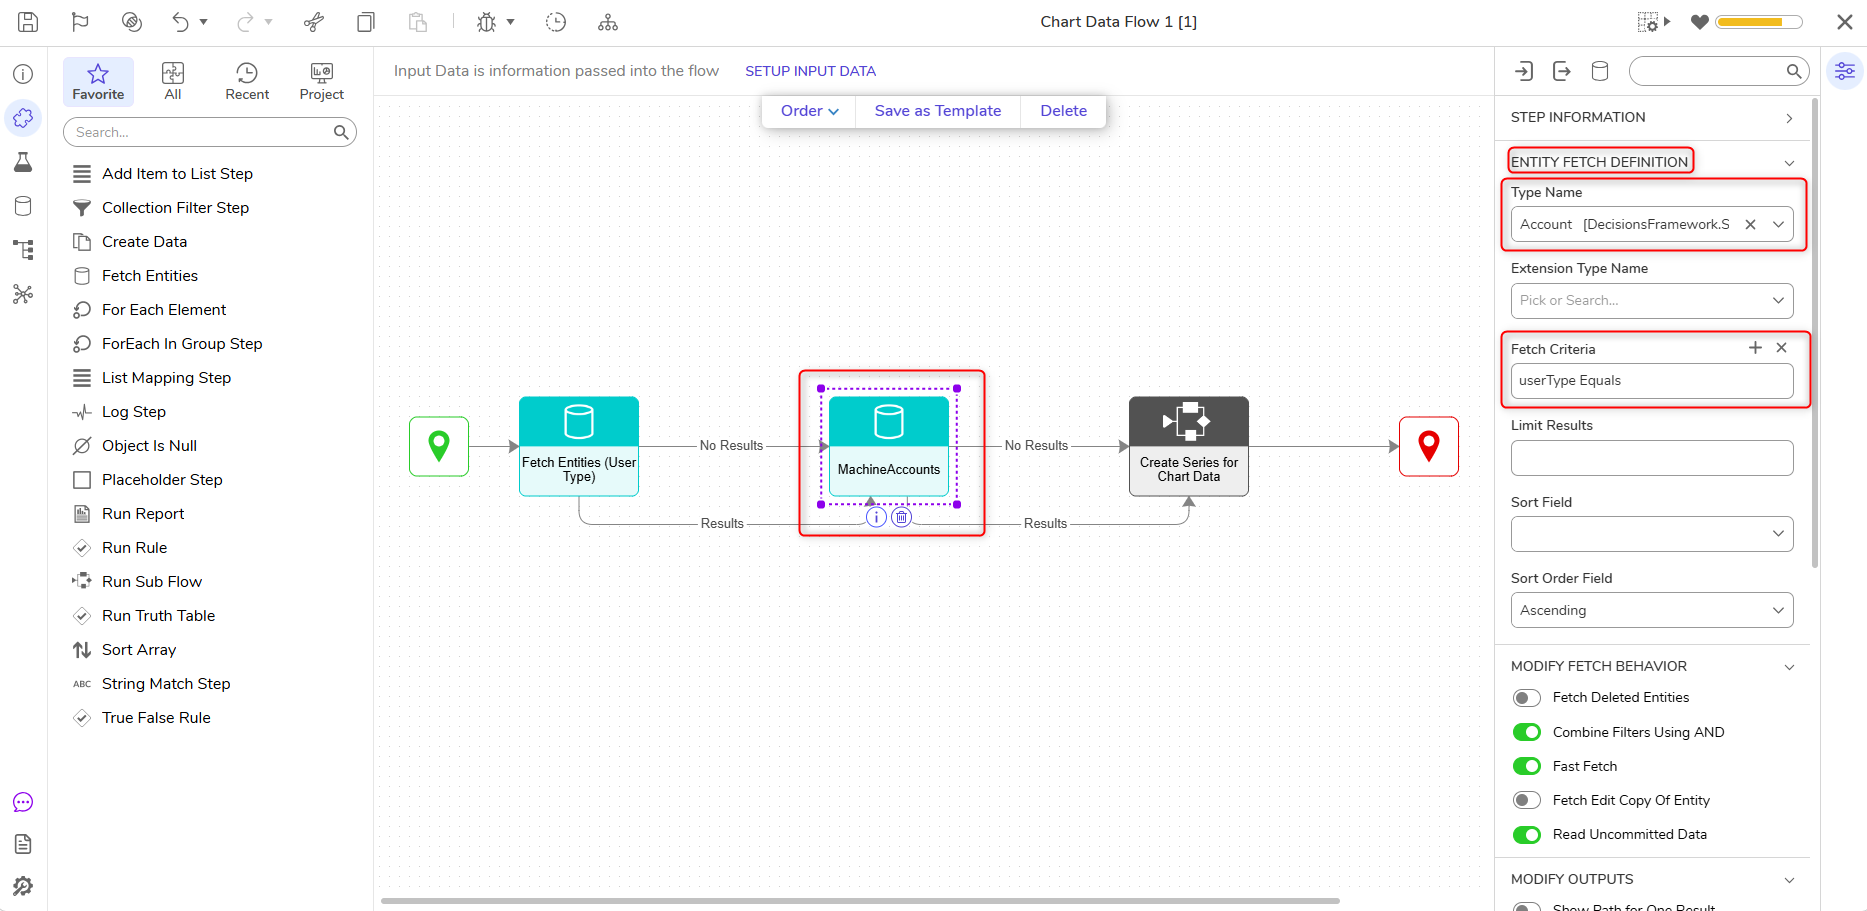
- Under INPUTS > usertype, change the input mapping to Constant. Select Machine.
- Rename the Output to MachineAccounts.
.png)
Creating the ChartDatum Subflow
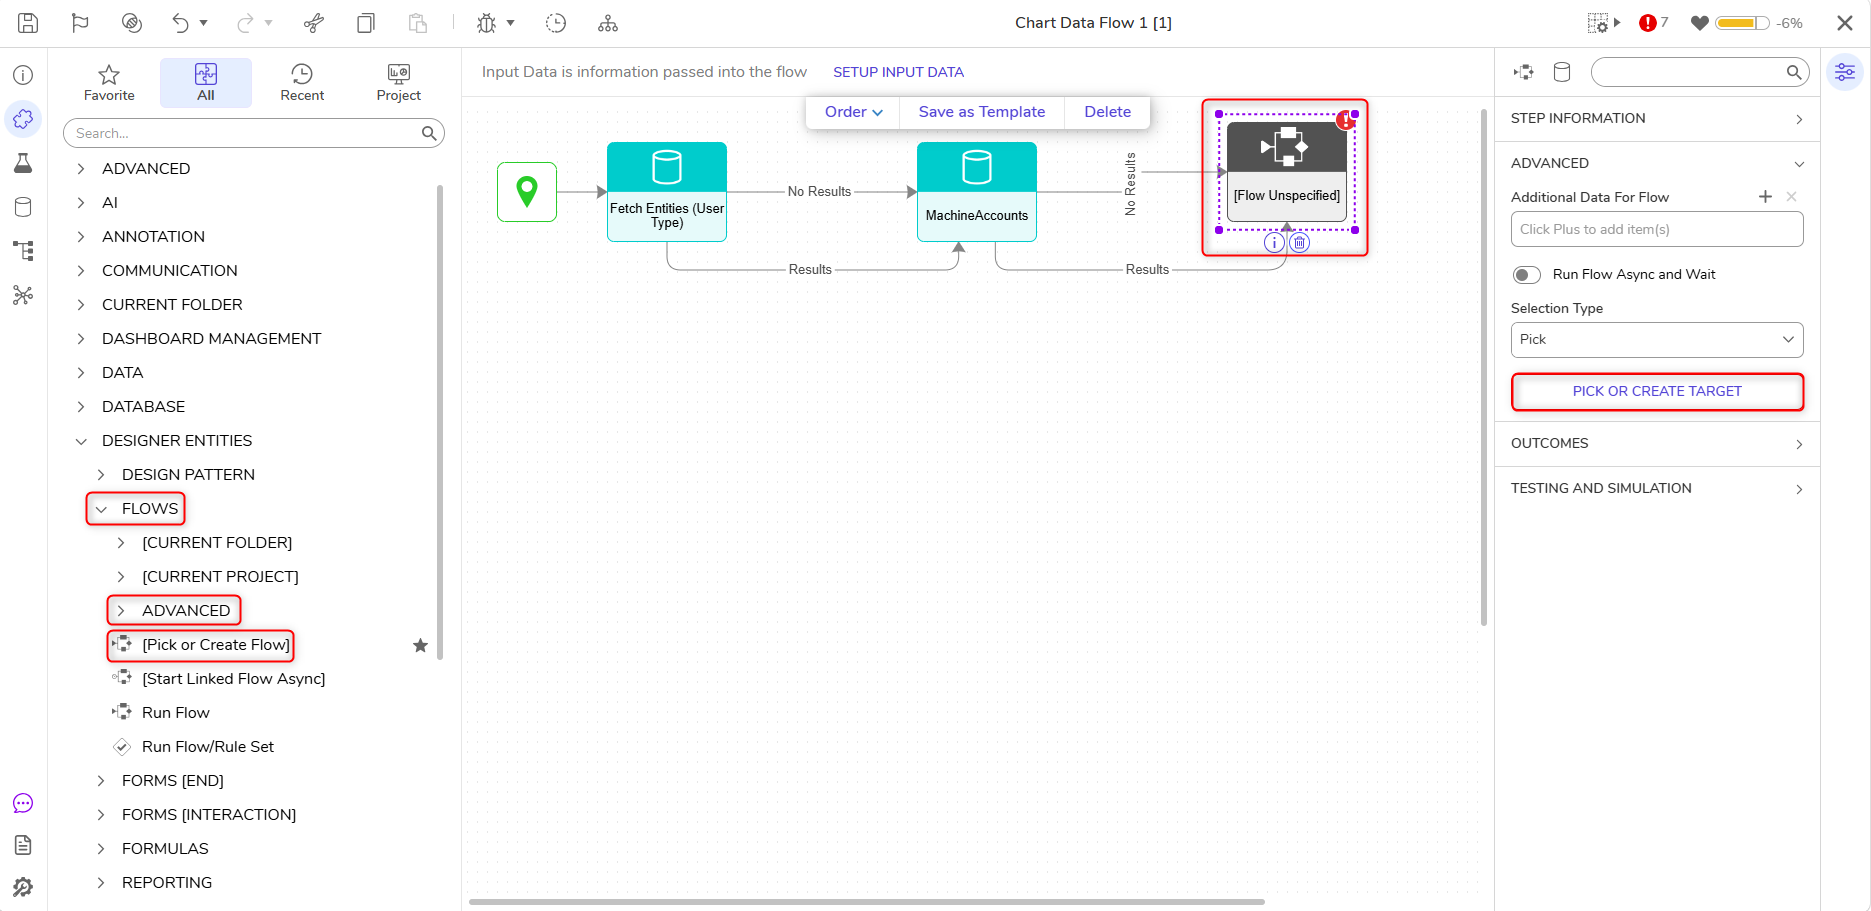
- Navigate to Toolbox > Designer Entities > Flows > Advanced and connect a Pick or Create Flow step to the Results outcome of the second Fetch Entities step.
- Connect the No Results and Results outcomes to the Pick or Create Flow step.
- In the Properties panel of the Pick or Create Flow step, click Pick or Create Target, then Create. Select and name the default Flow.
- In the Flow Designer, click Setup Input Data.
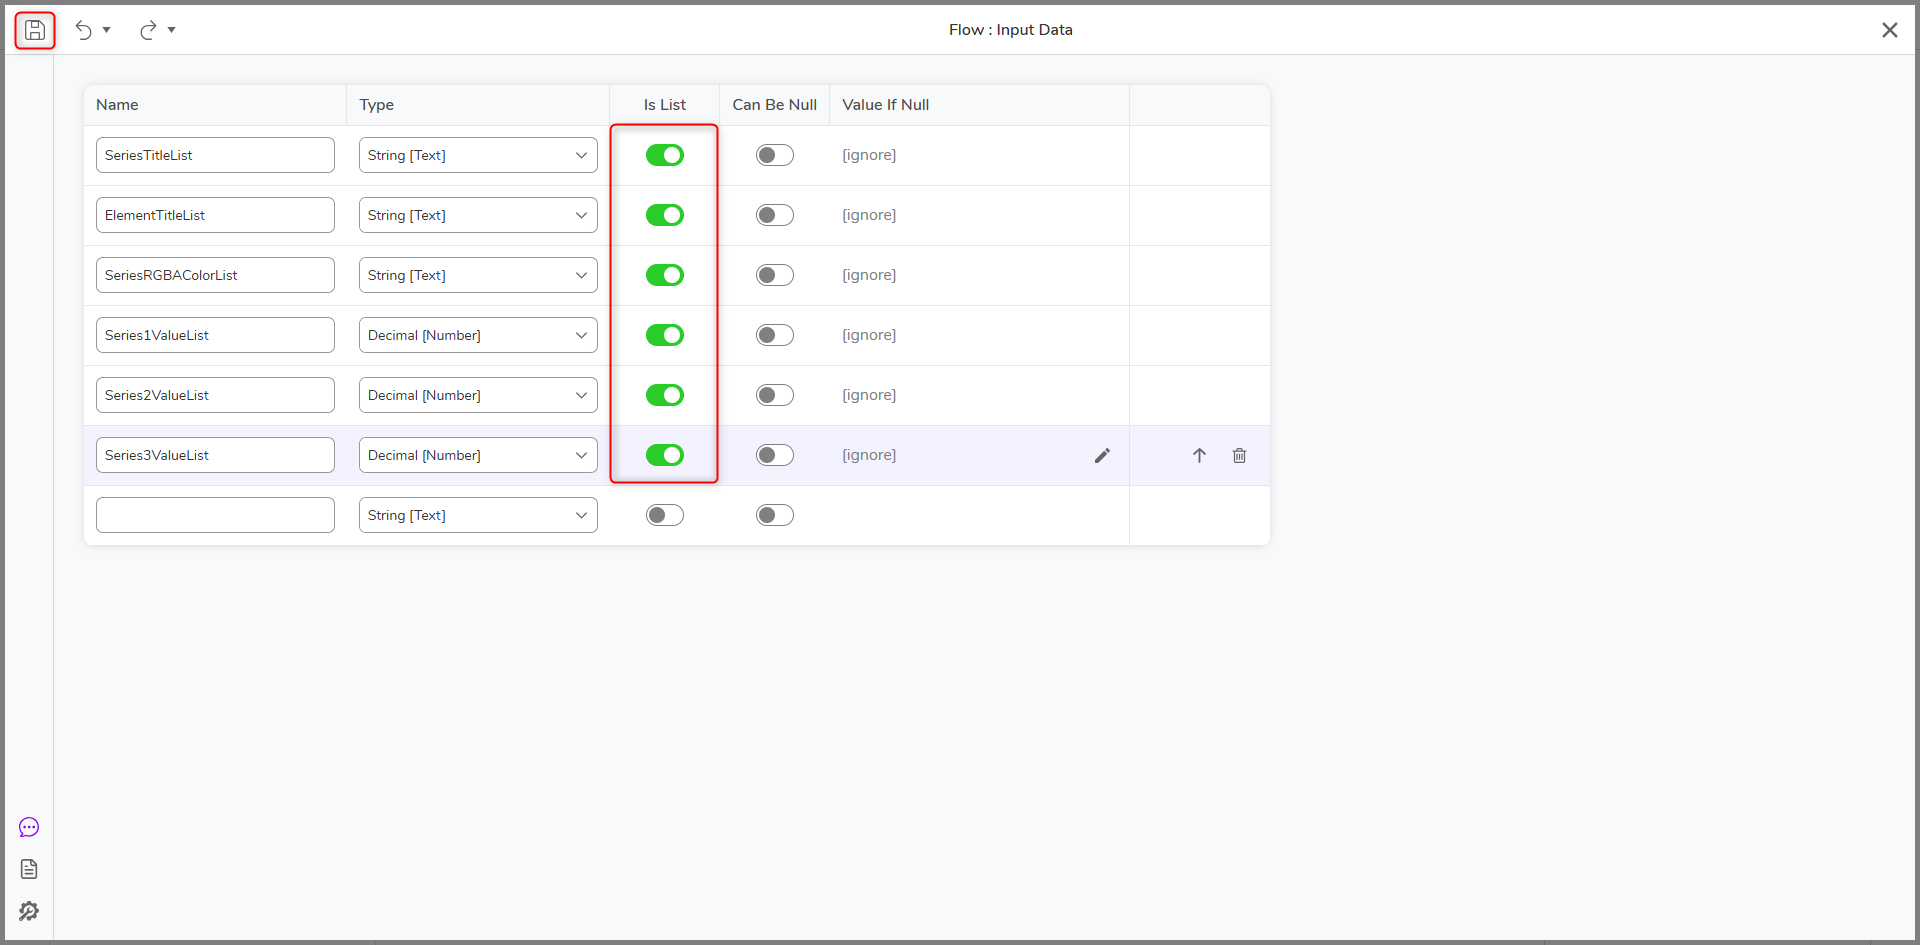
- In the next window, add the following data under Names and Types:
- SeriesTitleList (String)
- ElementTitleList (String)
- SeriesRgbaColorList (String)
- Series1ValueList (Decimal)
- Series2ValueList (Decimal)
- Series3ValueList (Decimal)
- All values will have IS LIST enabled.
- Click Save.
- Add a Create Data Step and a For Each step to the outcome of the Create Data step.
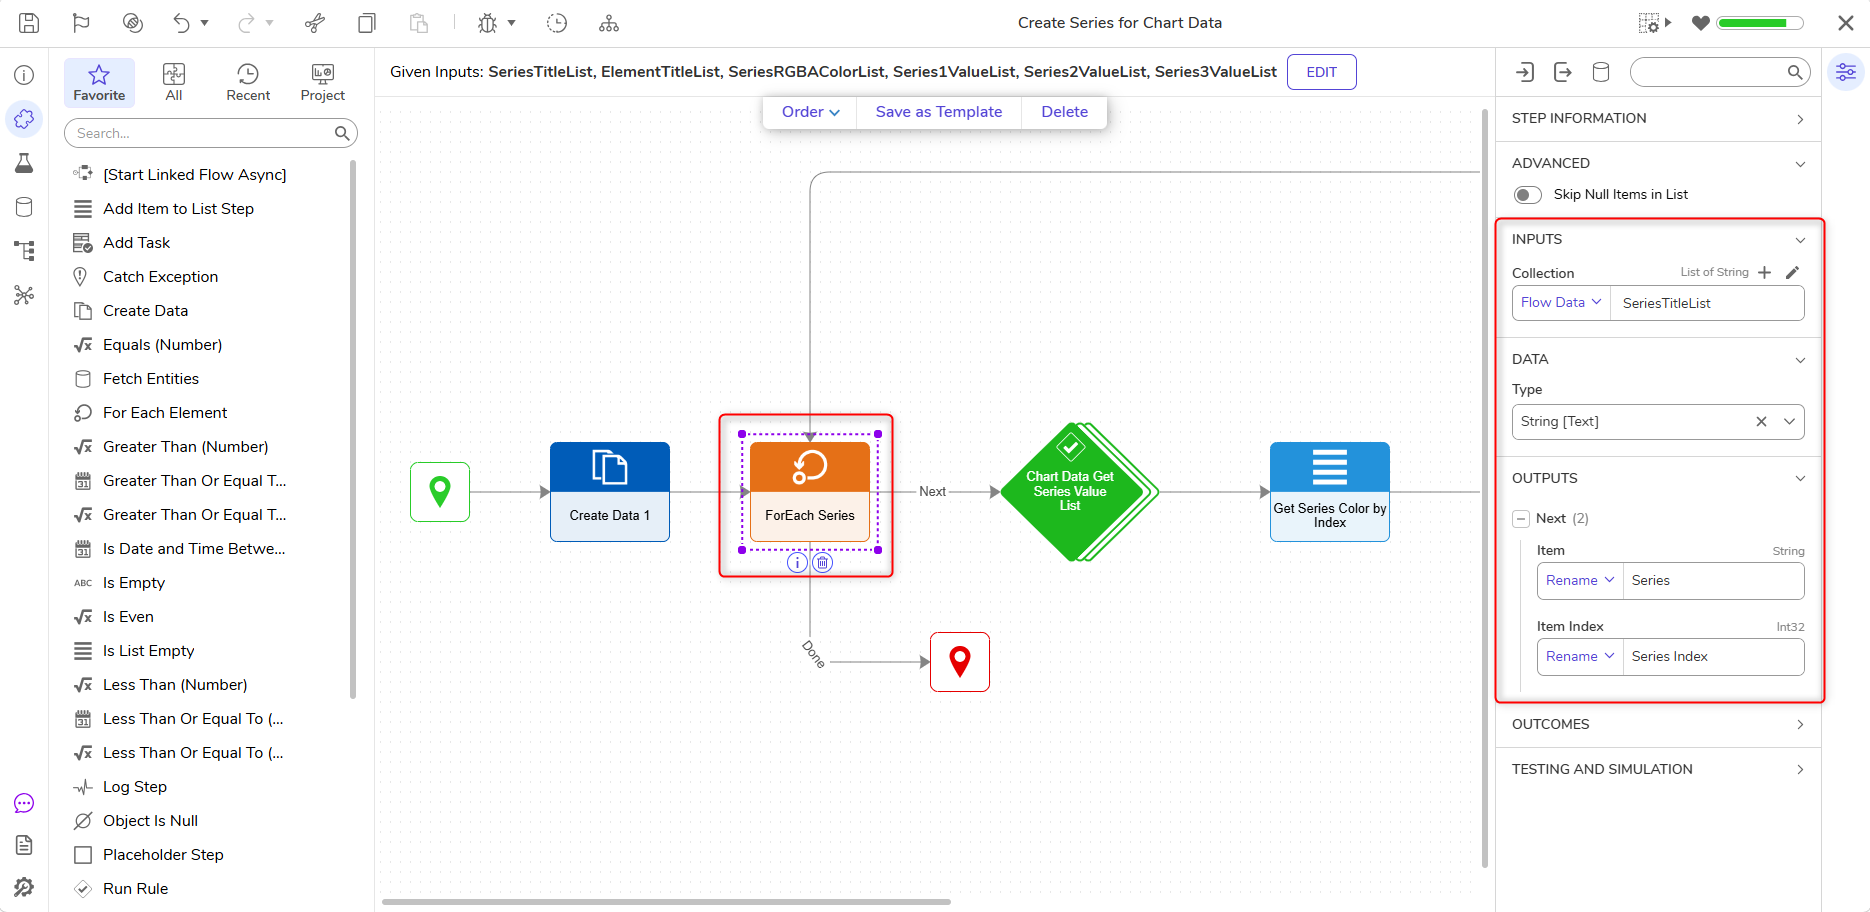
- Select the For Each Series step and navigate to the Properties panel > INPUTS > Collection. Using the Select From Flow input mapping, select the SeriesTitleList input.
- This will set the Data > Type to String. It is recommended to rename the OUTPUTS for clarity.
- Connect the Done outcome to the End Step.
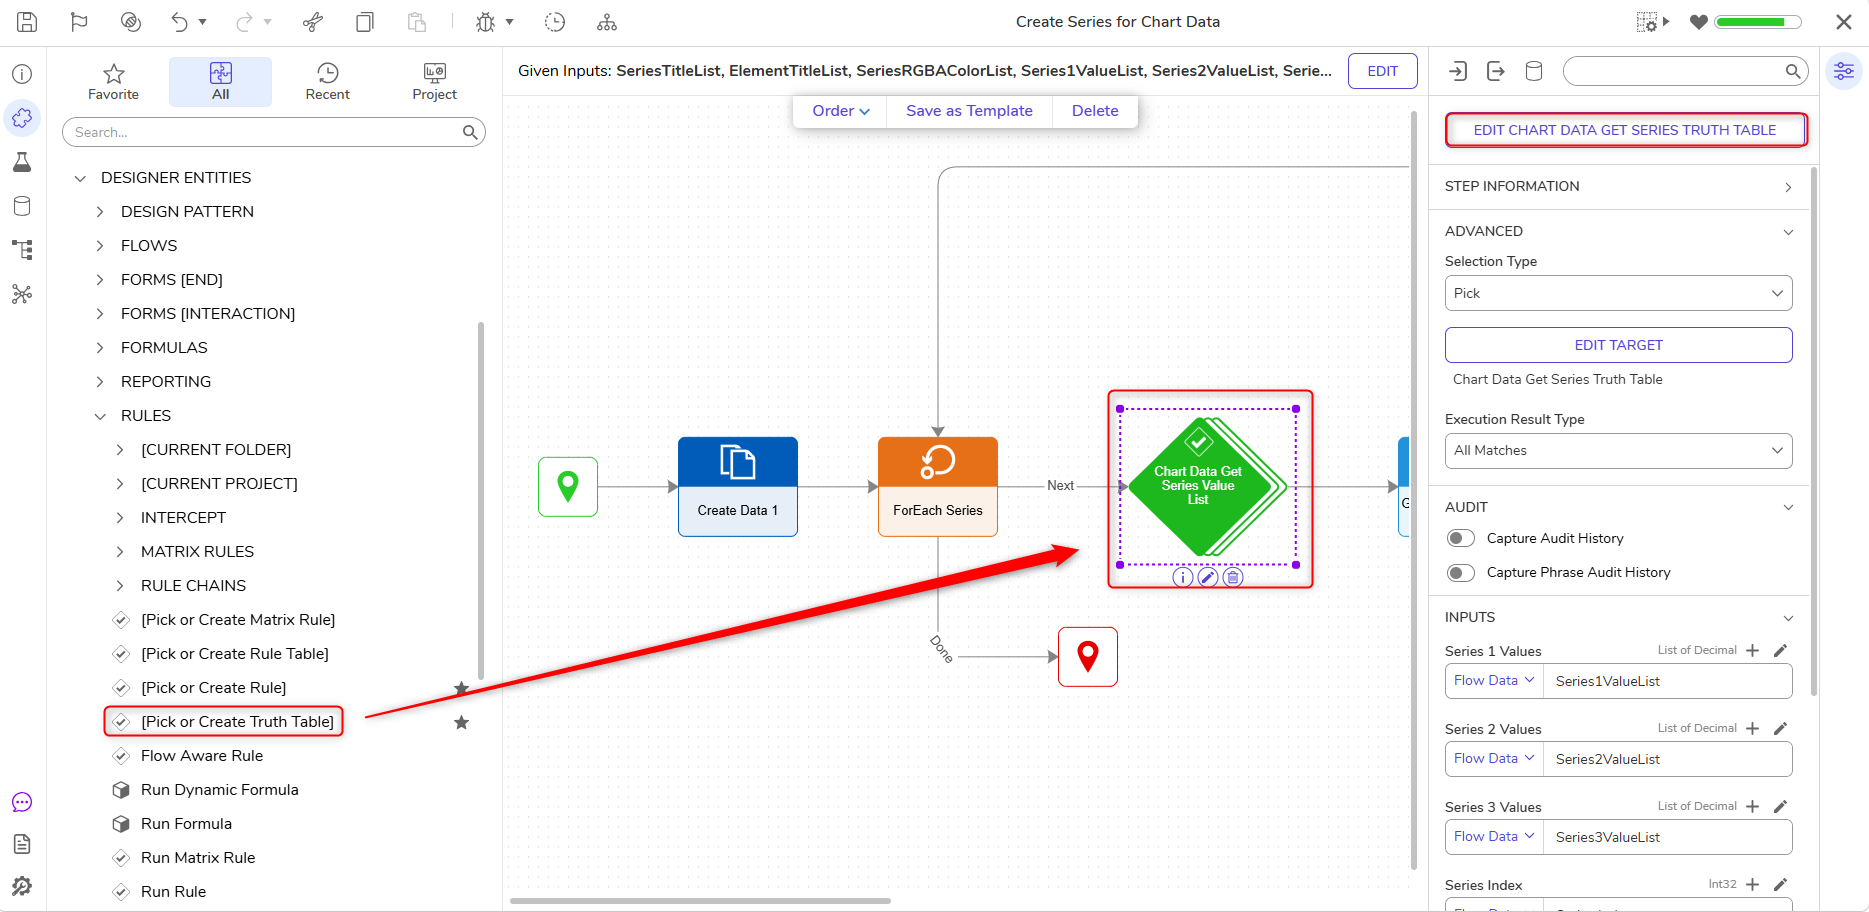
- Next, select a Pick or Create Truth Table step to the Next Outcome of the ForEach step.
- In the Properties panel of the Pick or Create Truth Table step, click Pick or Create Truth Table. Click Create.
- Select and name the Truth Table.
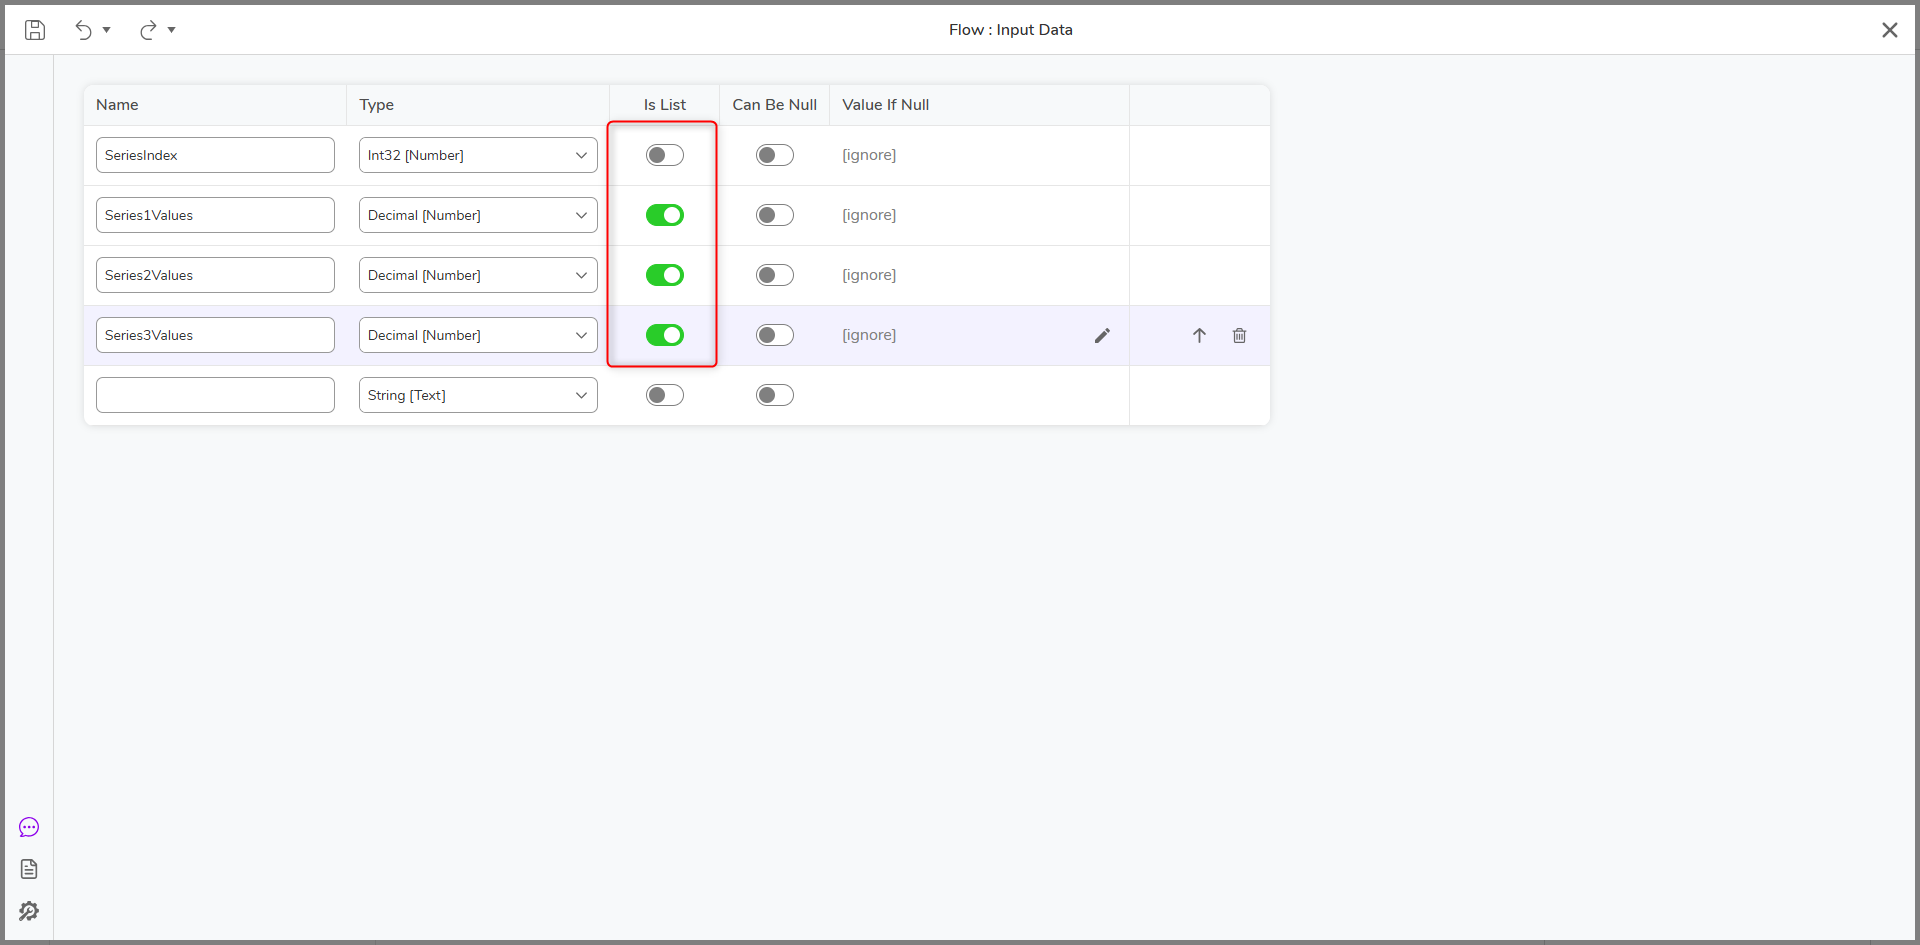
- In the Rule Designer, select Setup Input Data.
- In the next window, add the following data: Names and Types:
- SeriesIndex (Int32)
- Series1Values (Decimal)
- Series2Values (Decimal)
- Series3Values (Decimal)
- Series 1, 2, 3 Values should have IS LIST enabled.
- Click Save and exit.
- Click Select Data Element and choose SeriesIndex or the value from the ForEach step's OUTPUTS > Item Index.
- Then, under Number Rules, select Equals for the Verb.
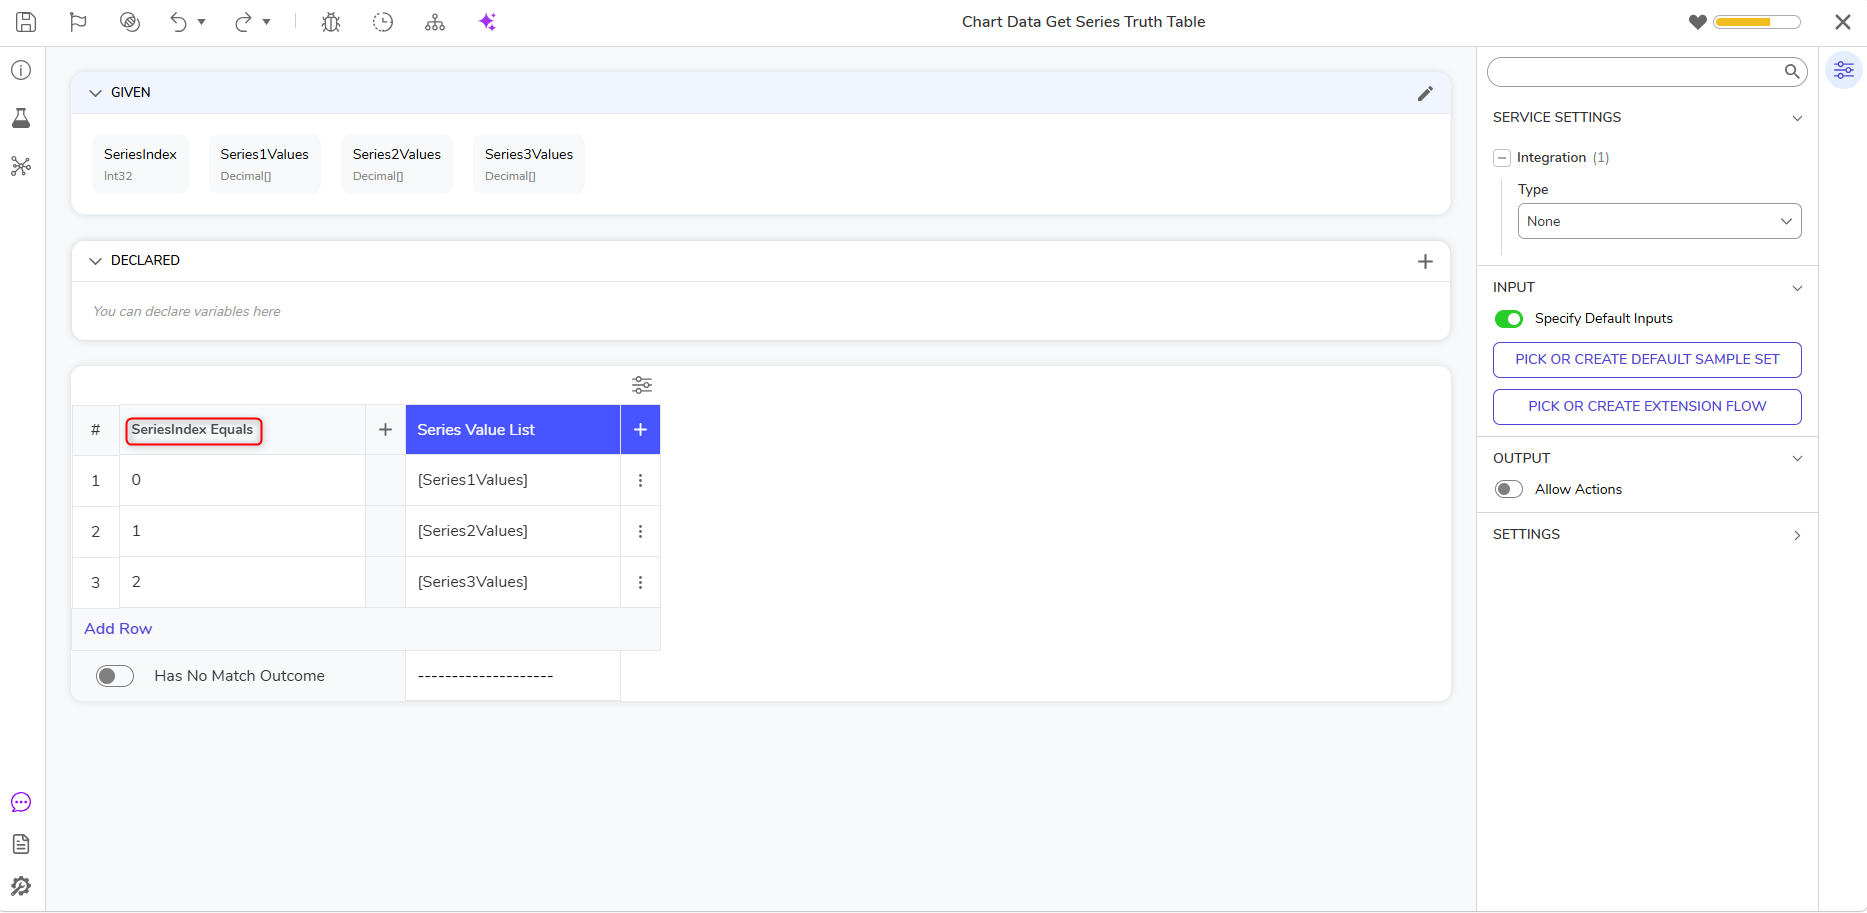
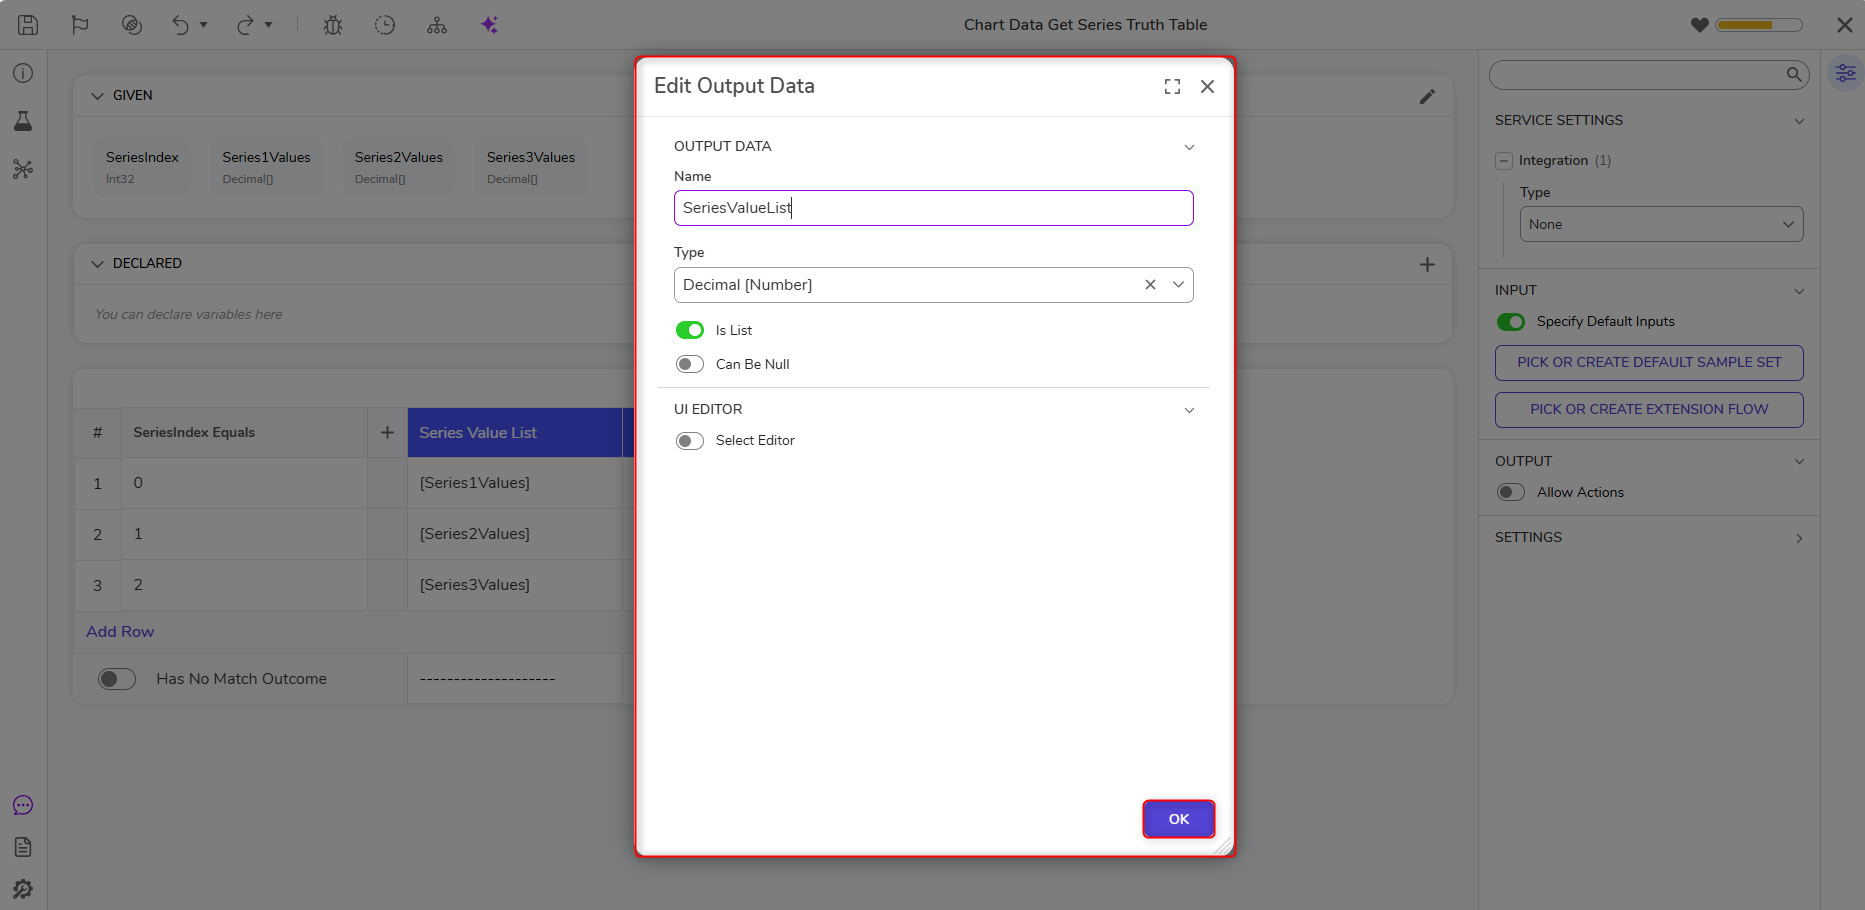
- Edit the Default Output Data column header by clicking the pencil icon.
- Change the Type to Decimal. Enable Is List.
- Select Ok.
- Change the input mapping below the Default Output Data header to Select From Flow, and select Series1Values.
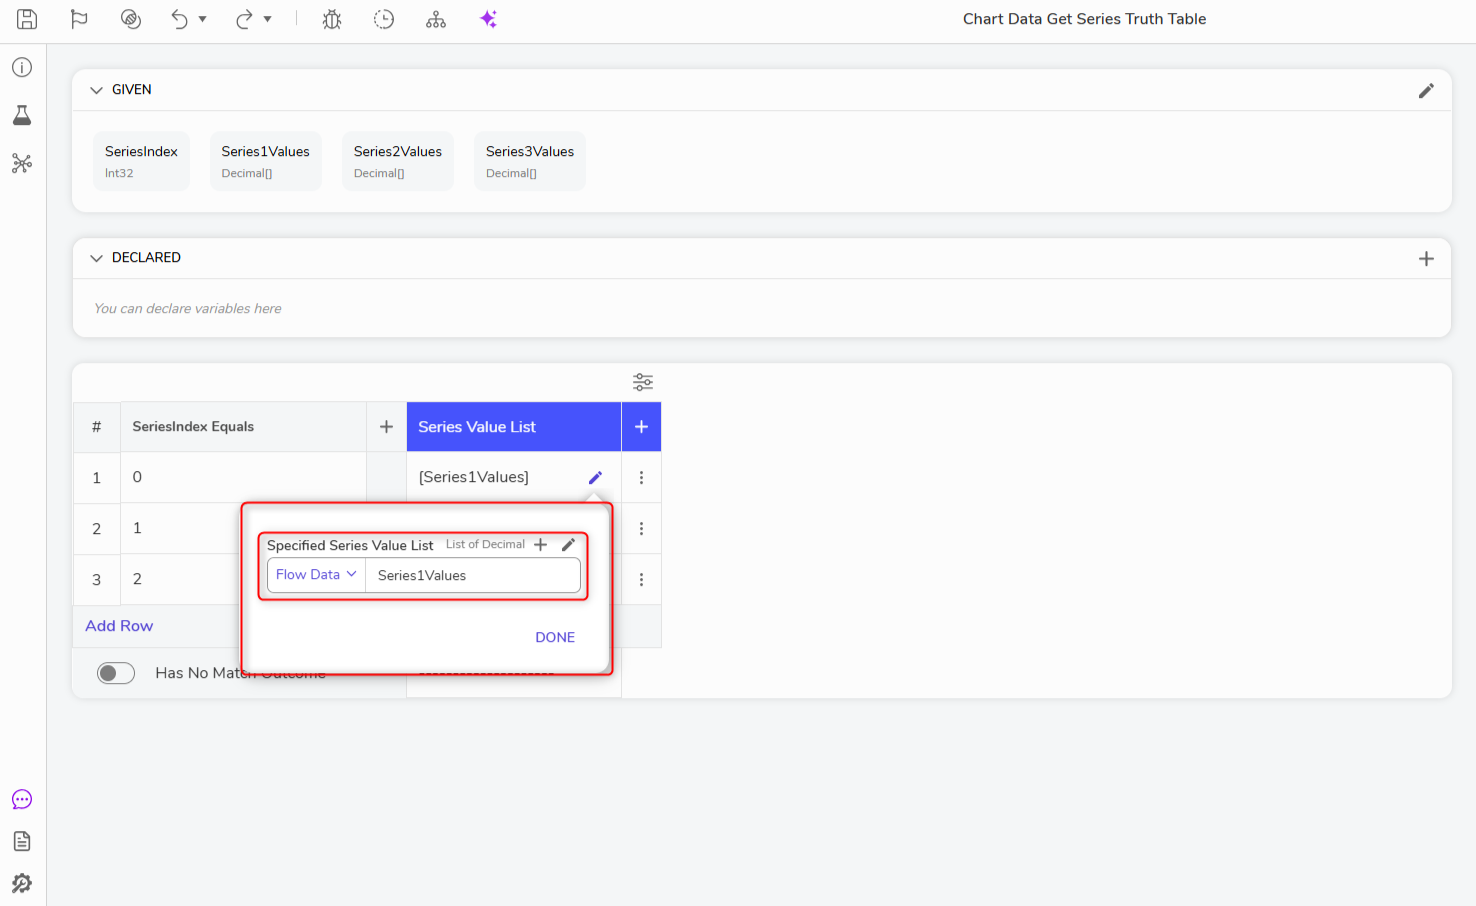
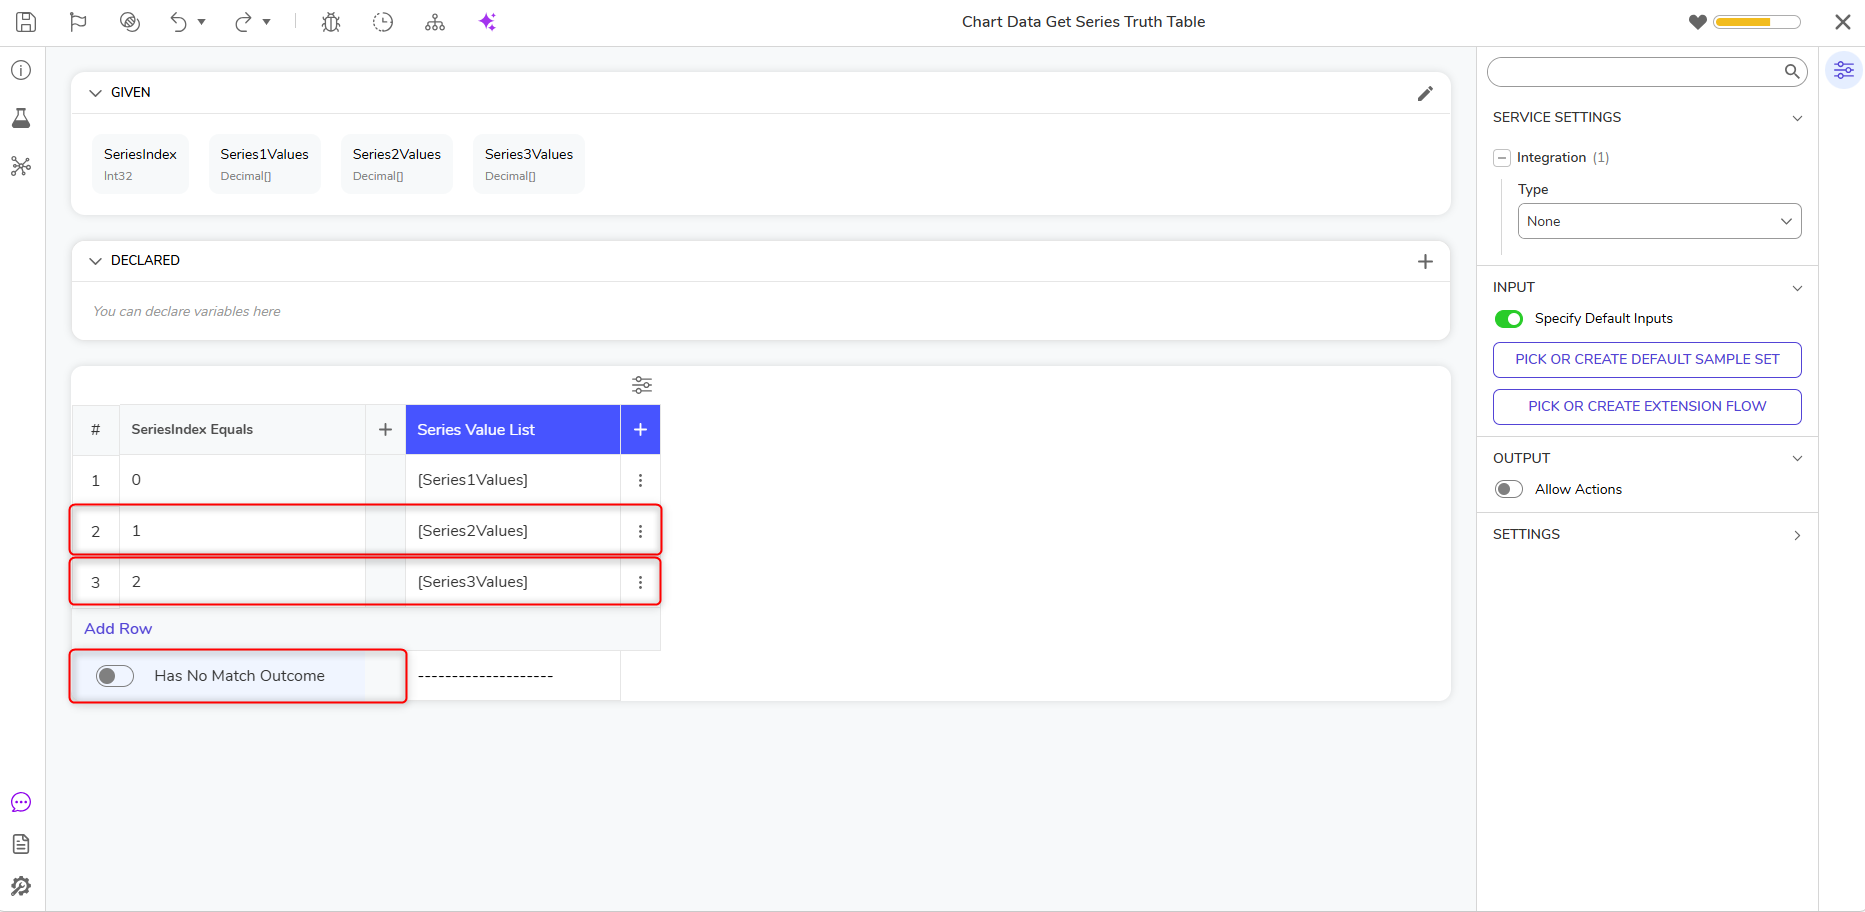
- Add a new row under SeriesIndex Equals, and add 1 for Inputs > Value2.
- Then, in the same row, add Series2Values under Series Value List as shown earlier.
- Add another row. Under SeriesIndex Equals, add 2 for Inputs > value2. Add Series3Values under Series Value List.
- Disable Has No Match Outcome before saving and exiting the Rule Designer.
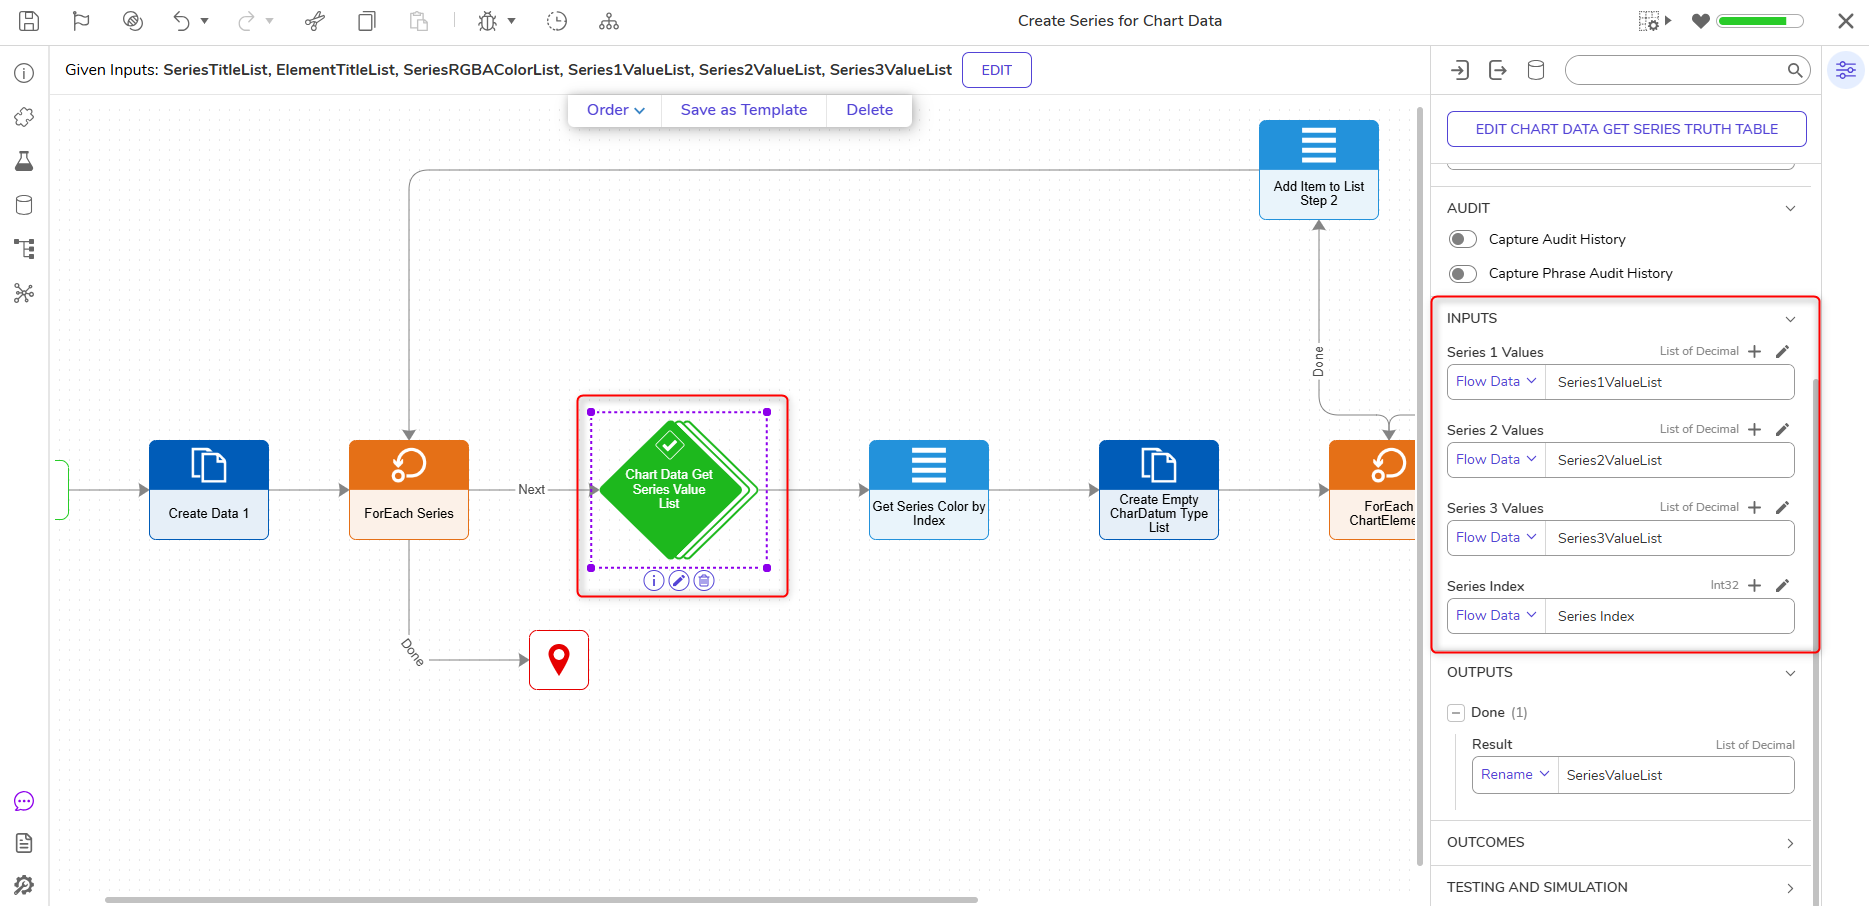
- Back in the Flow Designer, in the Properties panel > Inputs section, match each input with its corresponding value using a Select From Flow mapping.
- Rename the Output SeriesValueList.
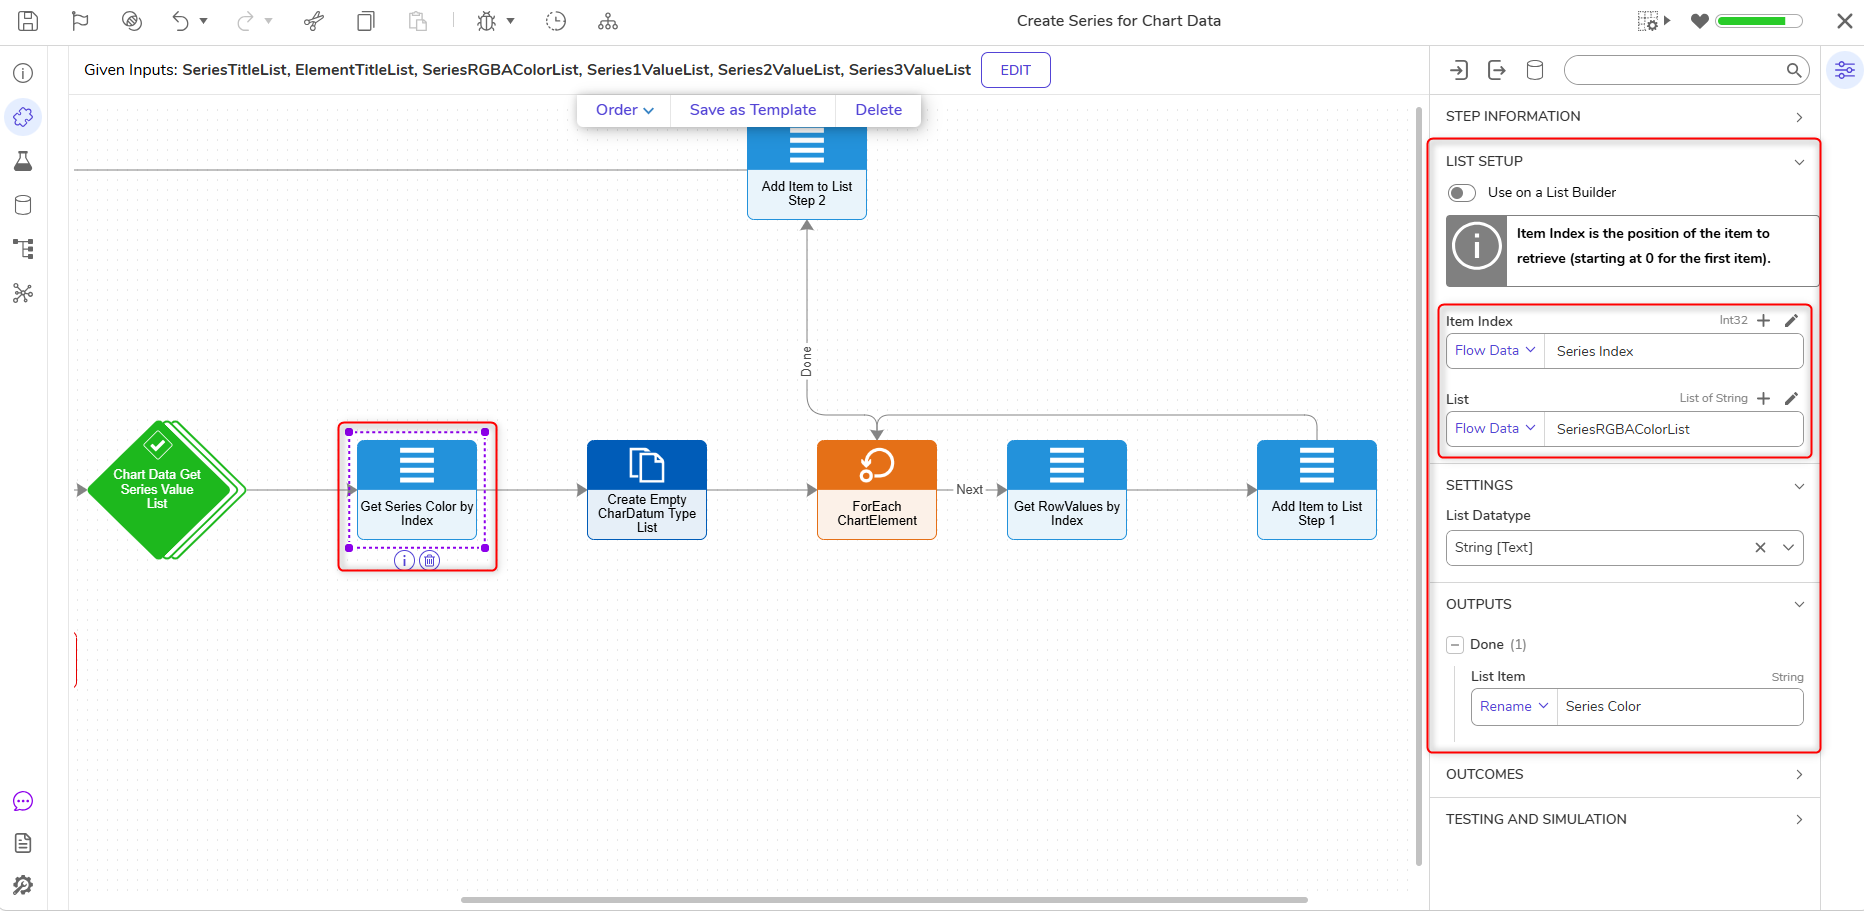
- Navigate to the Toolbox > Data > List and drag and connect a Get Item by Index step to the Truth Table outcome.
- With the Get Item by Index step selected, navigate to the Properties panel > List Setup > Item Index and choose a Select From Flow input mapping. Select SeriesIndex.
- For the List Input, choose Select From Flow and then select SeriesRgbaColorList.
- From the Toolbox > Favorite Steps section, drag and connect a Create Data step to the outcome of the Get Item by Index step.
- Under Data to Create, click Show Editor and enter CharElementList under name and ChartDatum under Type. Ensure Is List is checked.
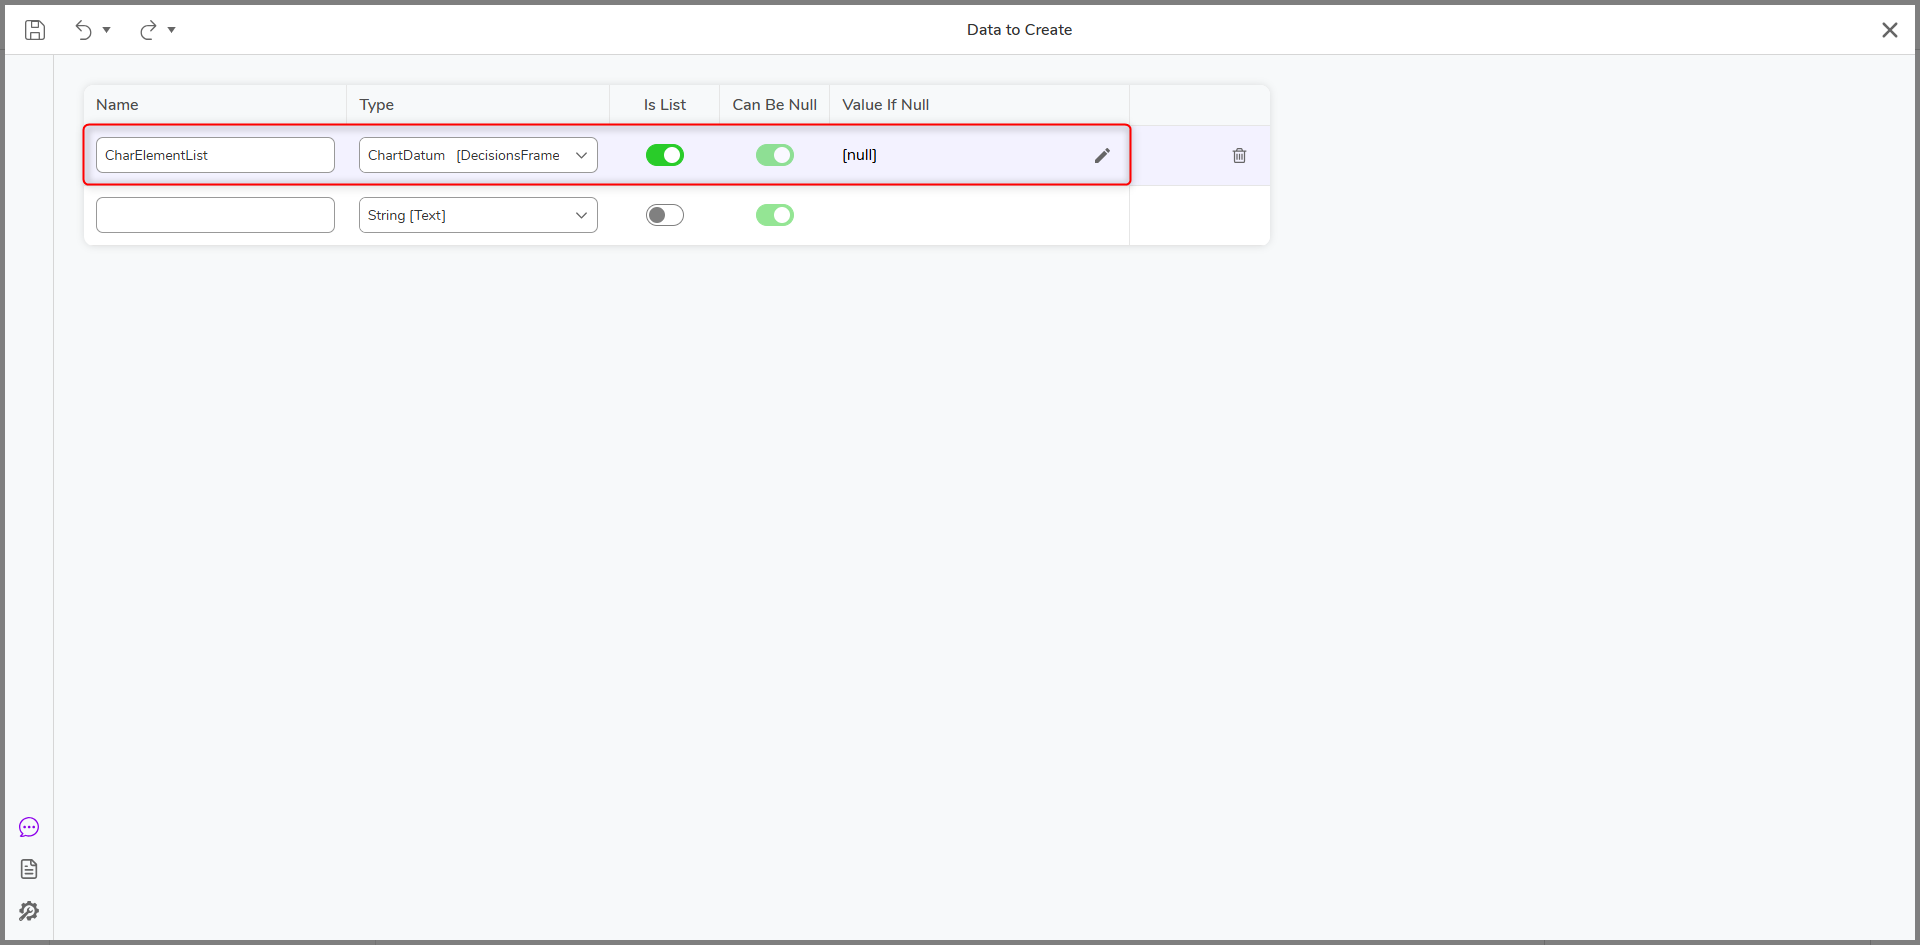
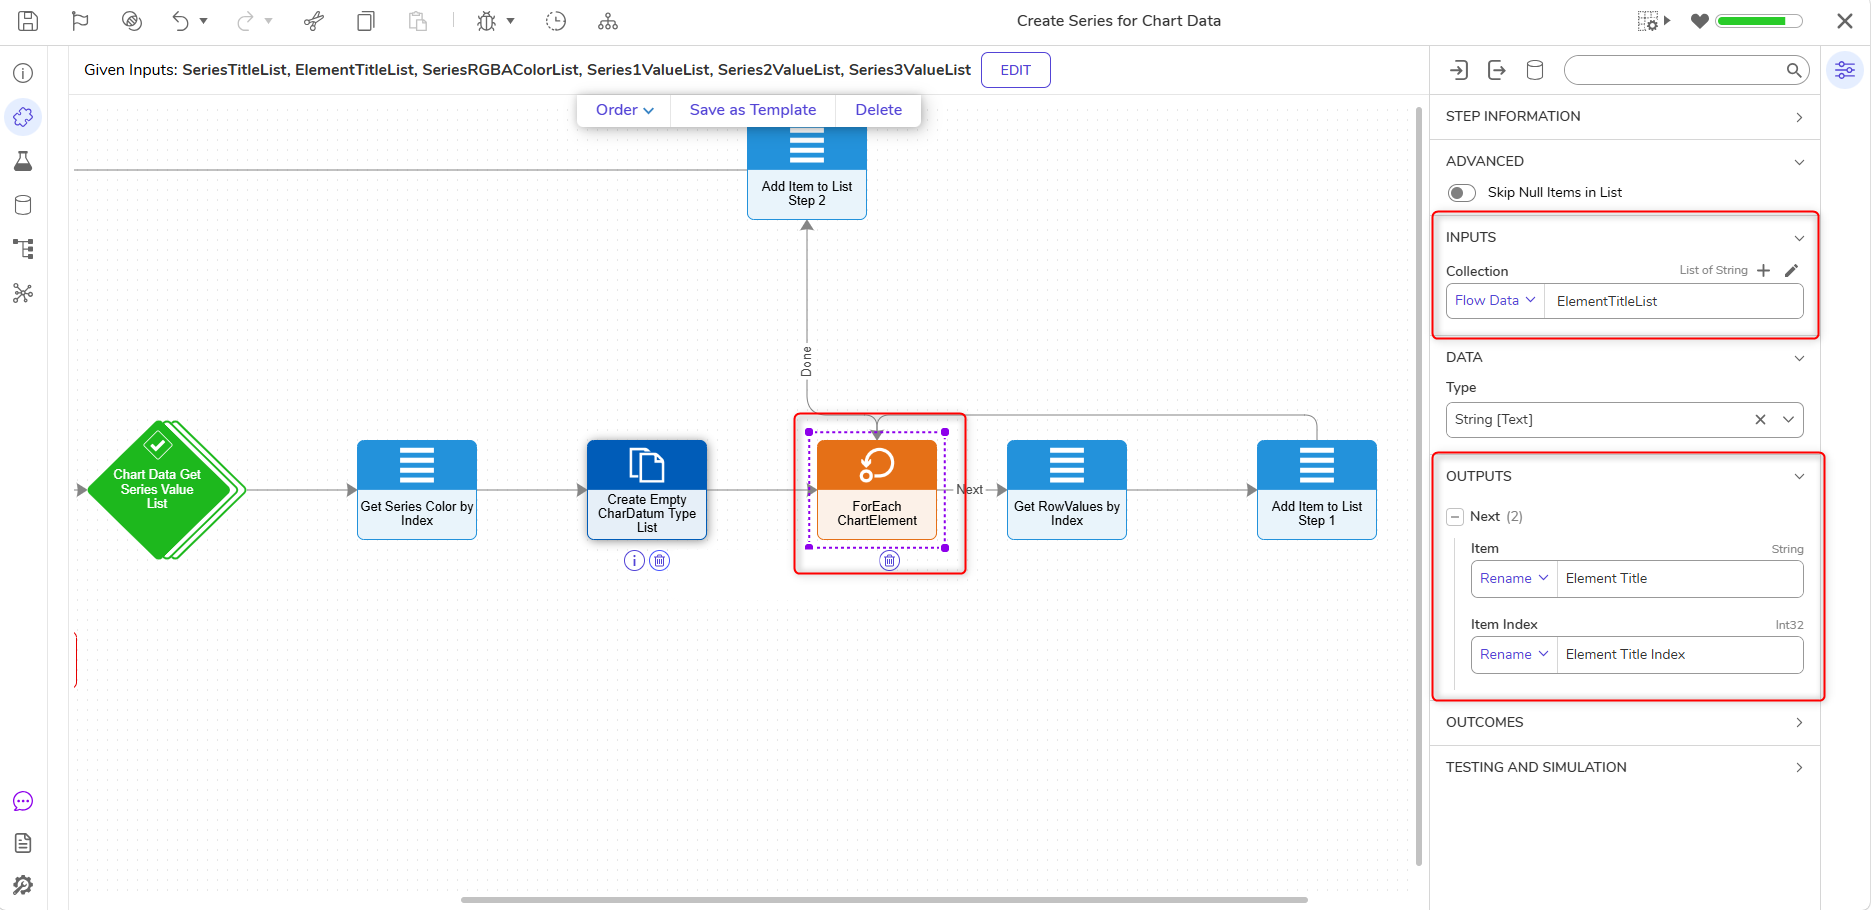
- Save and Exit the window, and connect a ForEach step to the Create Data step's outcome in the Toolbox > Flow Management > Iteration category.
- Navigate to the Properties panel > Inputs > Collection and change the input mapping to Select From Flow. Select ElementTitleList.
- Data will automatically populate the required fields. It is recommended to rename Outputs > Next items for clarity.
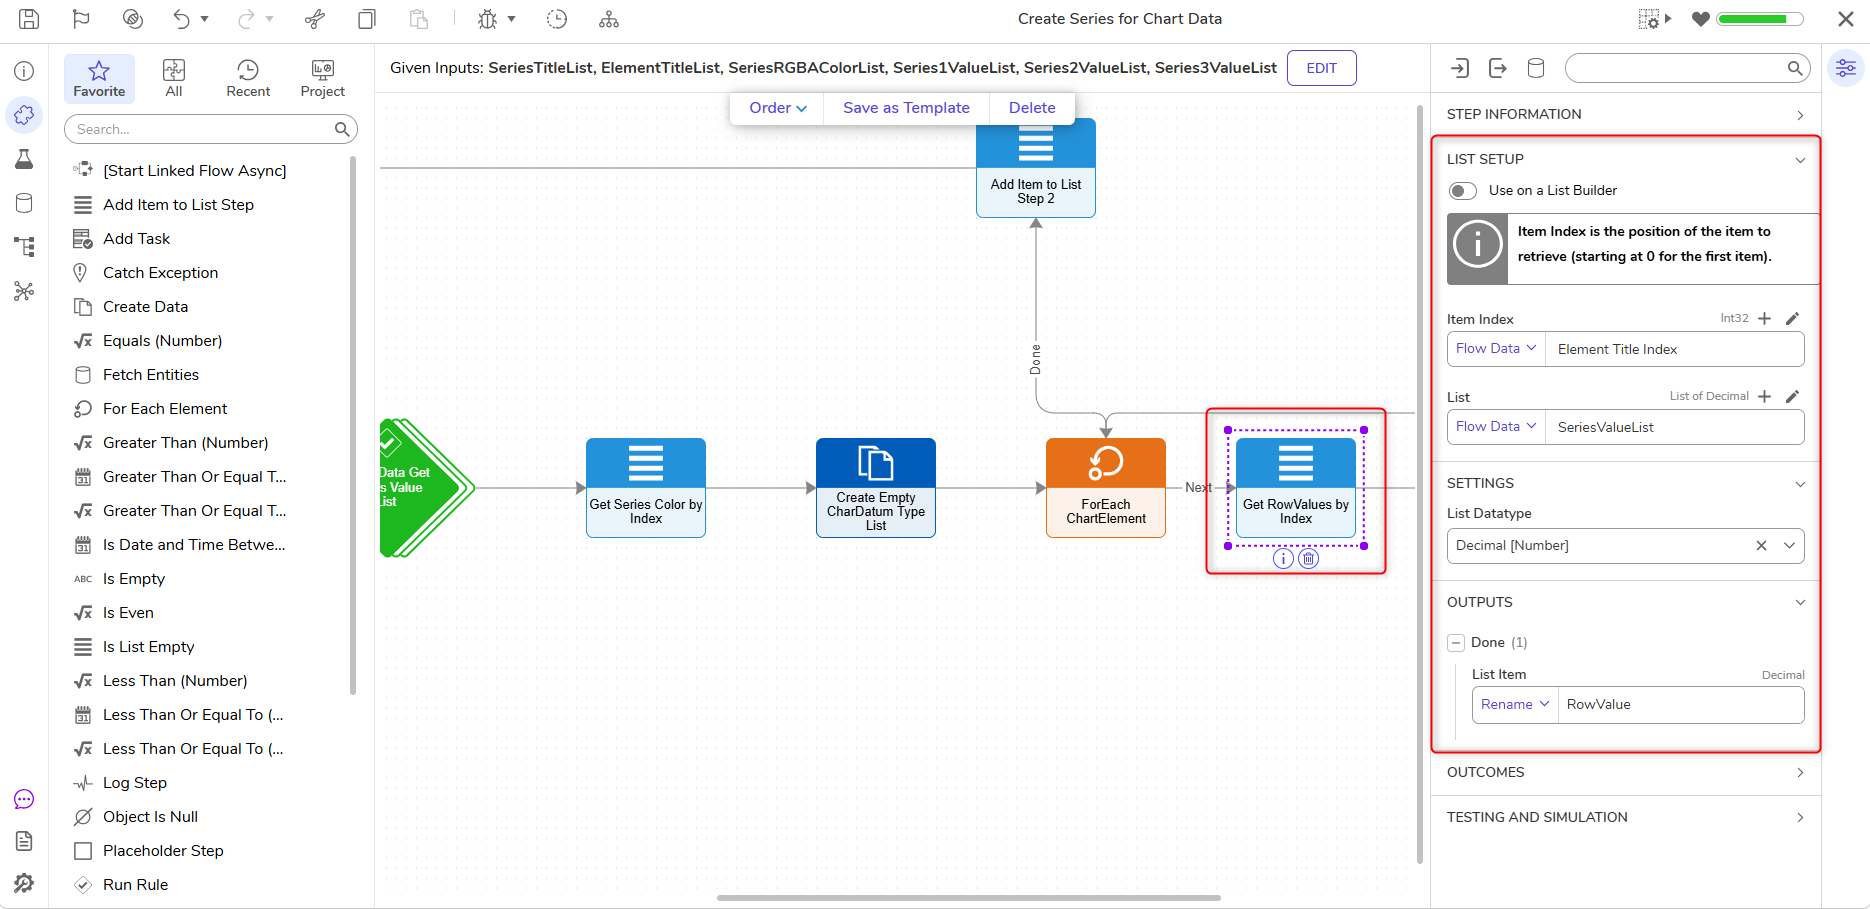
- On the Next outcome of the For Each step, connect another Get Item by Index step.
- Under Inputs > ItemIndex, change the input mapping to Select From Flow and choose ElementTitleIndex.
- For the List Input, choose SeriesValueList using a Select From Flow mapping.
- From the Toolbox > Data > List category, drag and connect an Add Item to List step to the outcome of the Get Item by Index step.
- With the Add Item to List step selected, change the Data > List DataType to ChartDatum using All/Search.
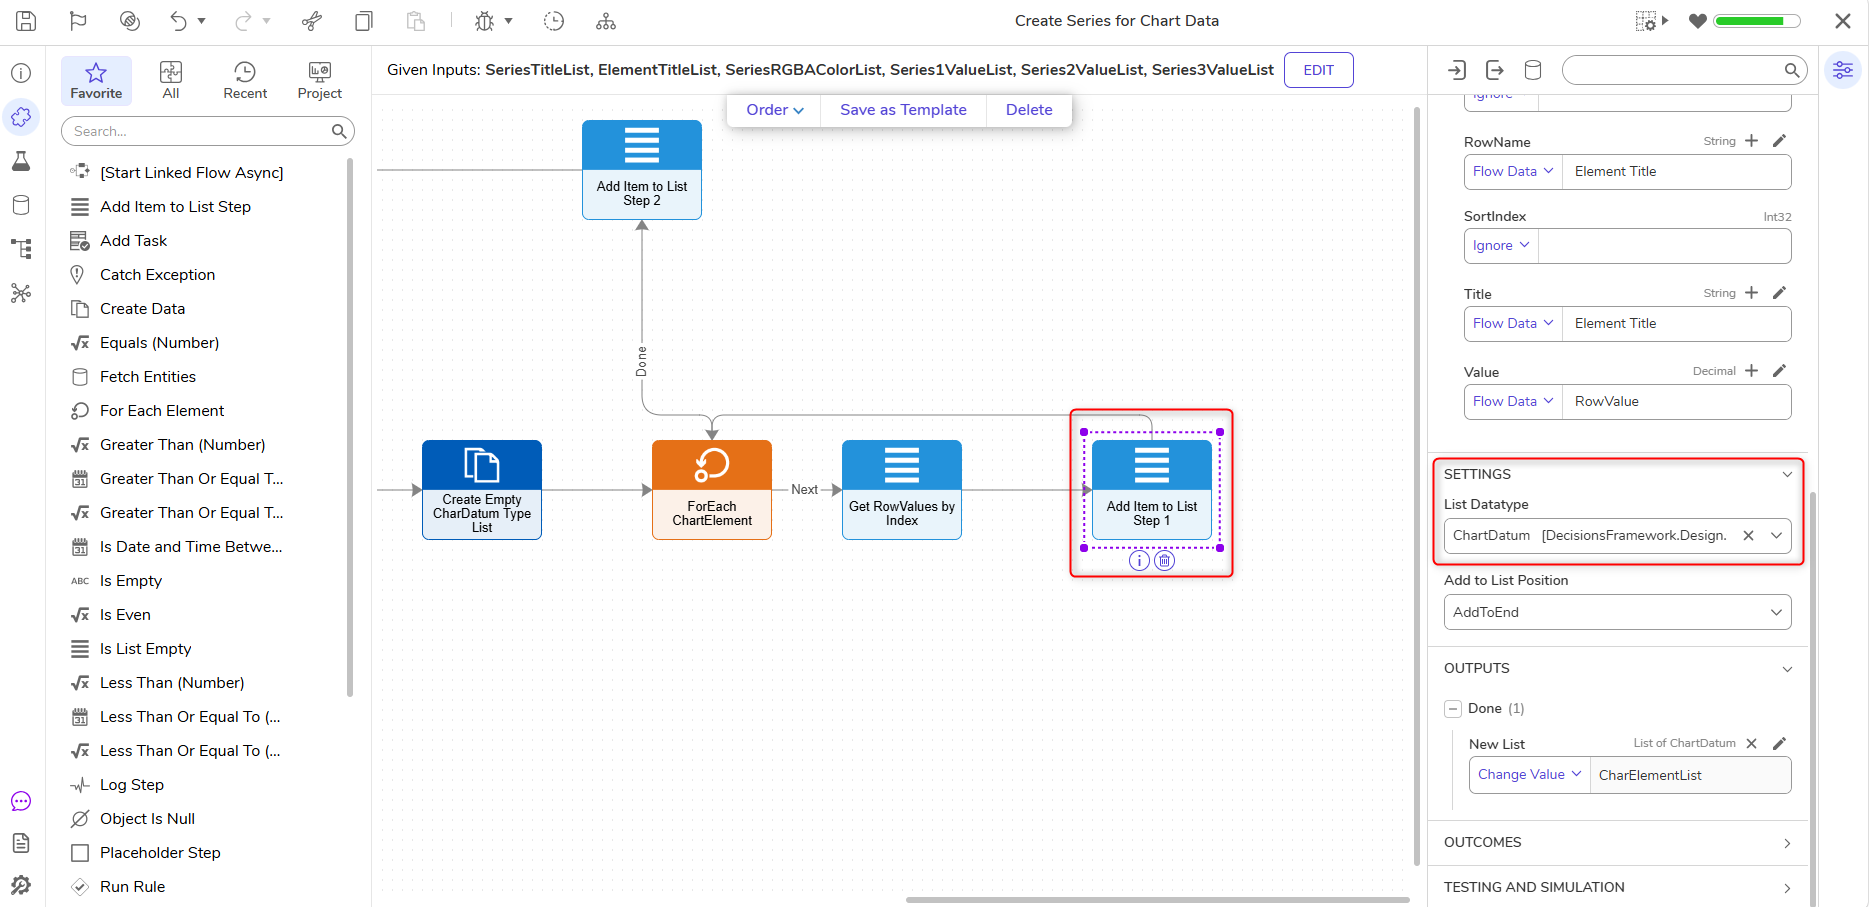
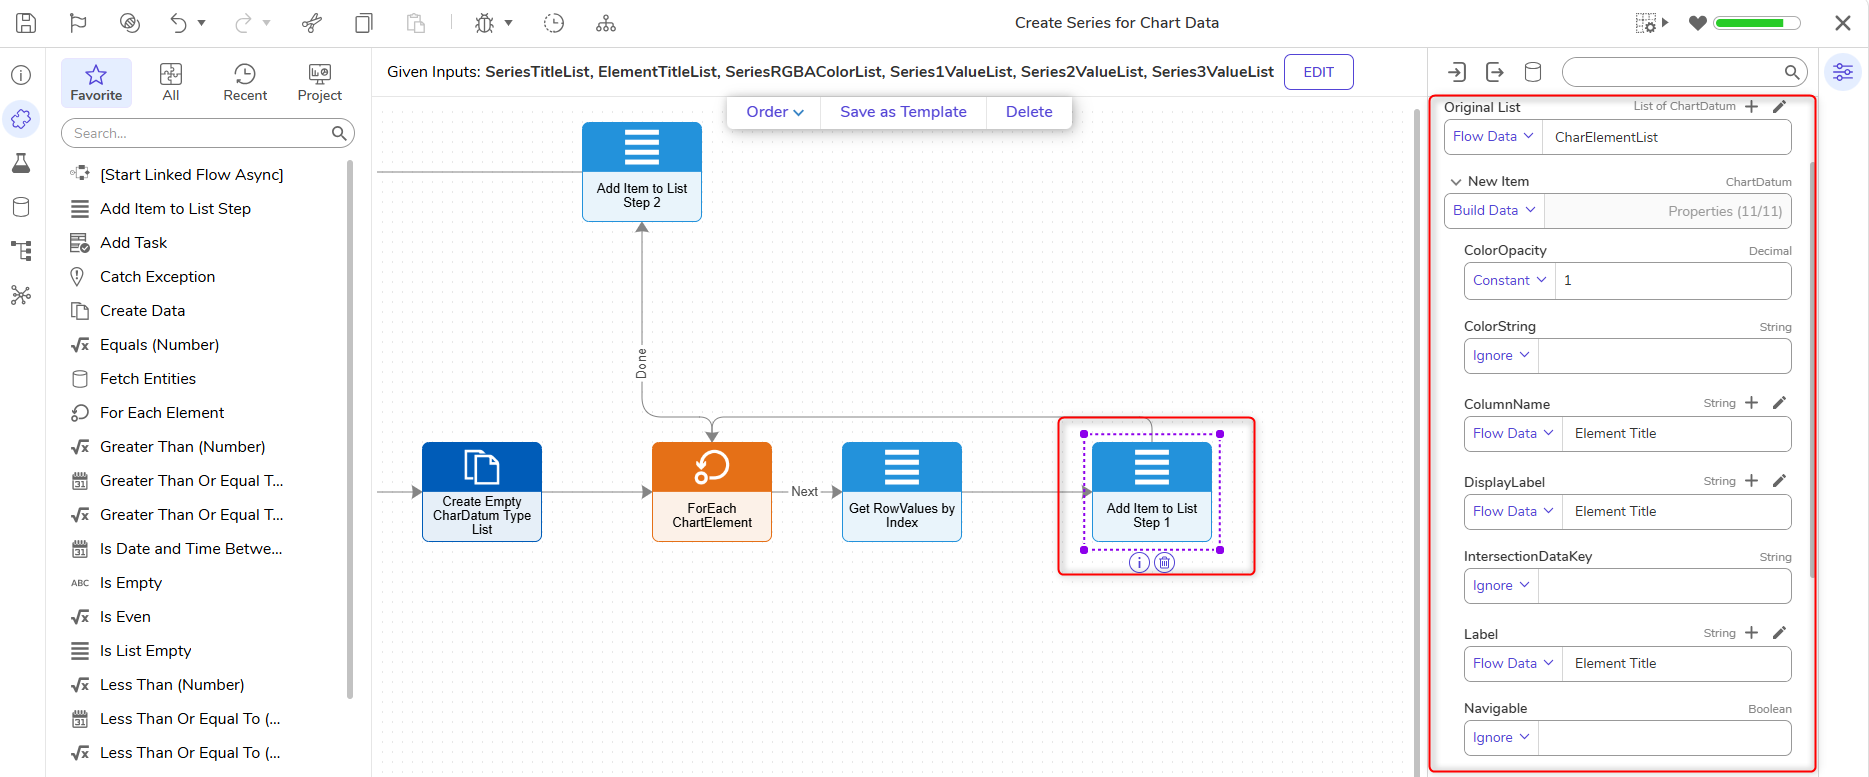
- Then, under Inputs > New Item, change the input mapping to Build Data.
- Change the input mapping of the Inputs > ColorOpacity to Constant and add 1.
- The Inputs > ColumnName, DisplayLabel, Label, RowName, and Title will all have a Select From Flow mapping with ElementTitle as the value.
- Set Inputs > Value to a Select From Flow mapping, select RowValue mapping, then select RowValue or the output from the previous Get Item by Index step.
- Next, set the Inputs > Original List to a Select From Flow mapping and choose ChartElementList.
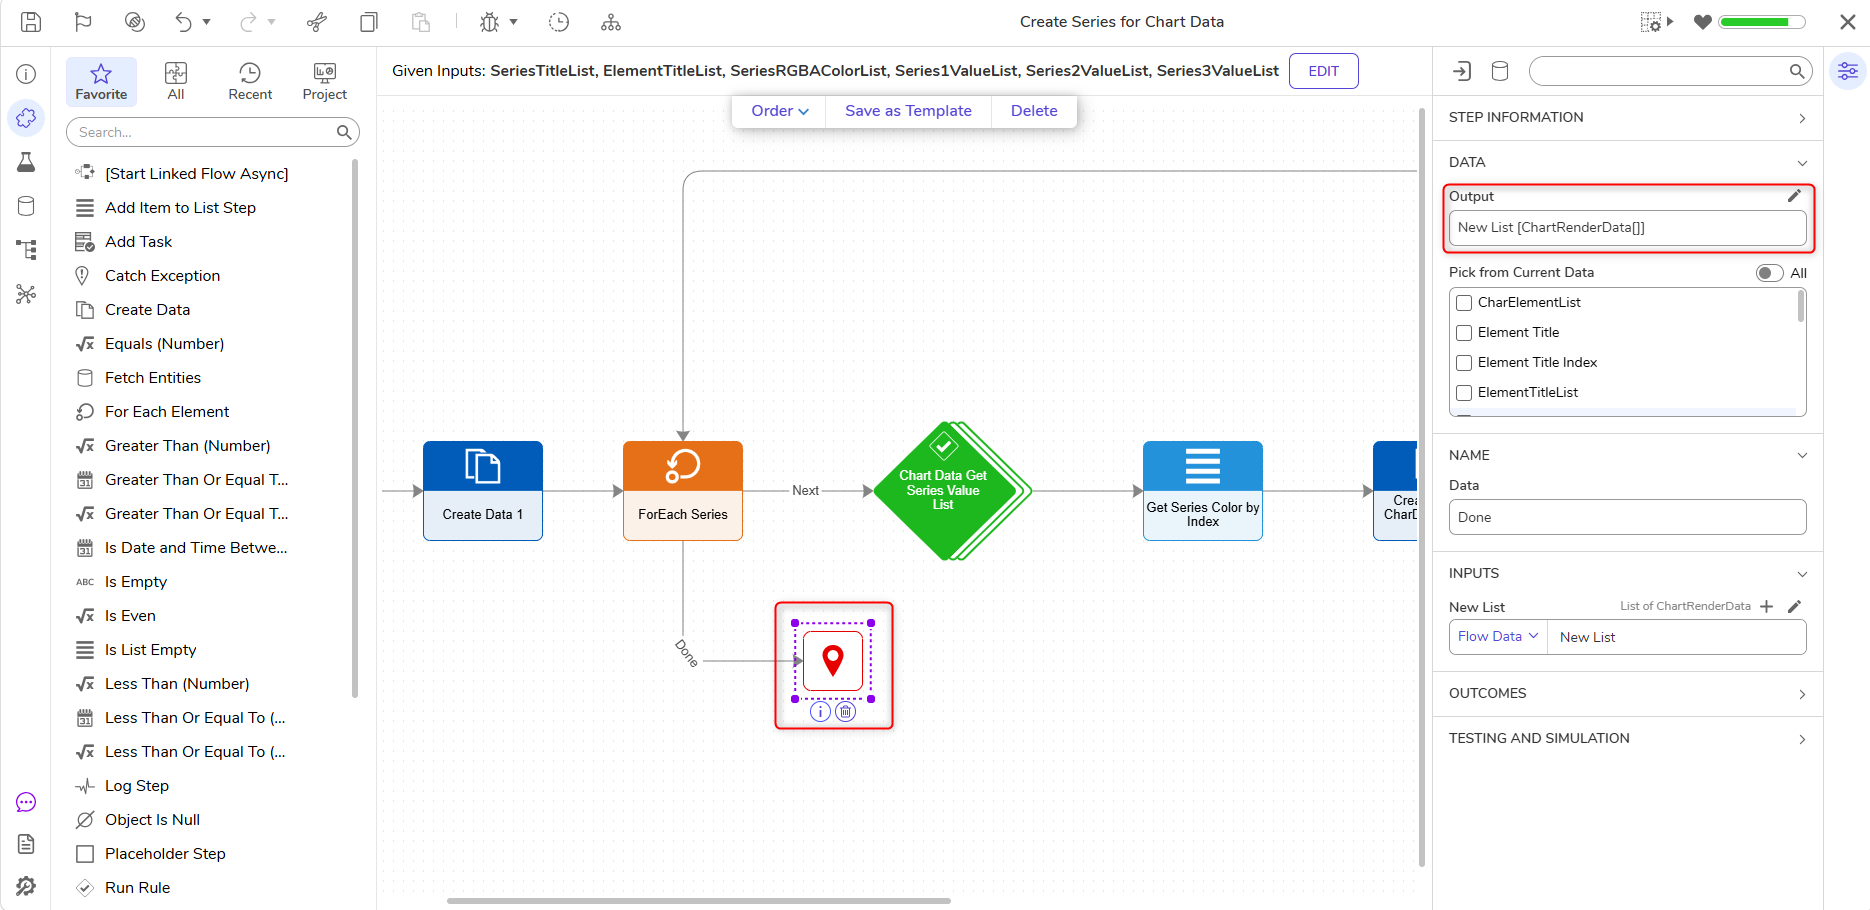
- Navigate to Outputs > Done > New List and set the input mapping to Change Value. Choose ChartElementList.
- Connect the outcome of the Add Item to List step to the last ForEach step.
.png)
- Connect the Done outcome of the last ForEach step to a second Add Item to List step.
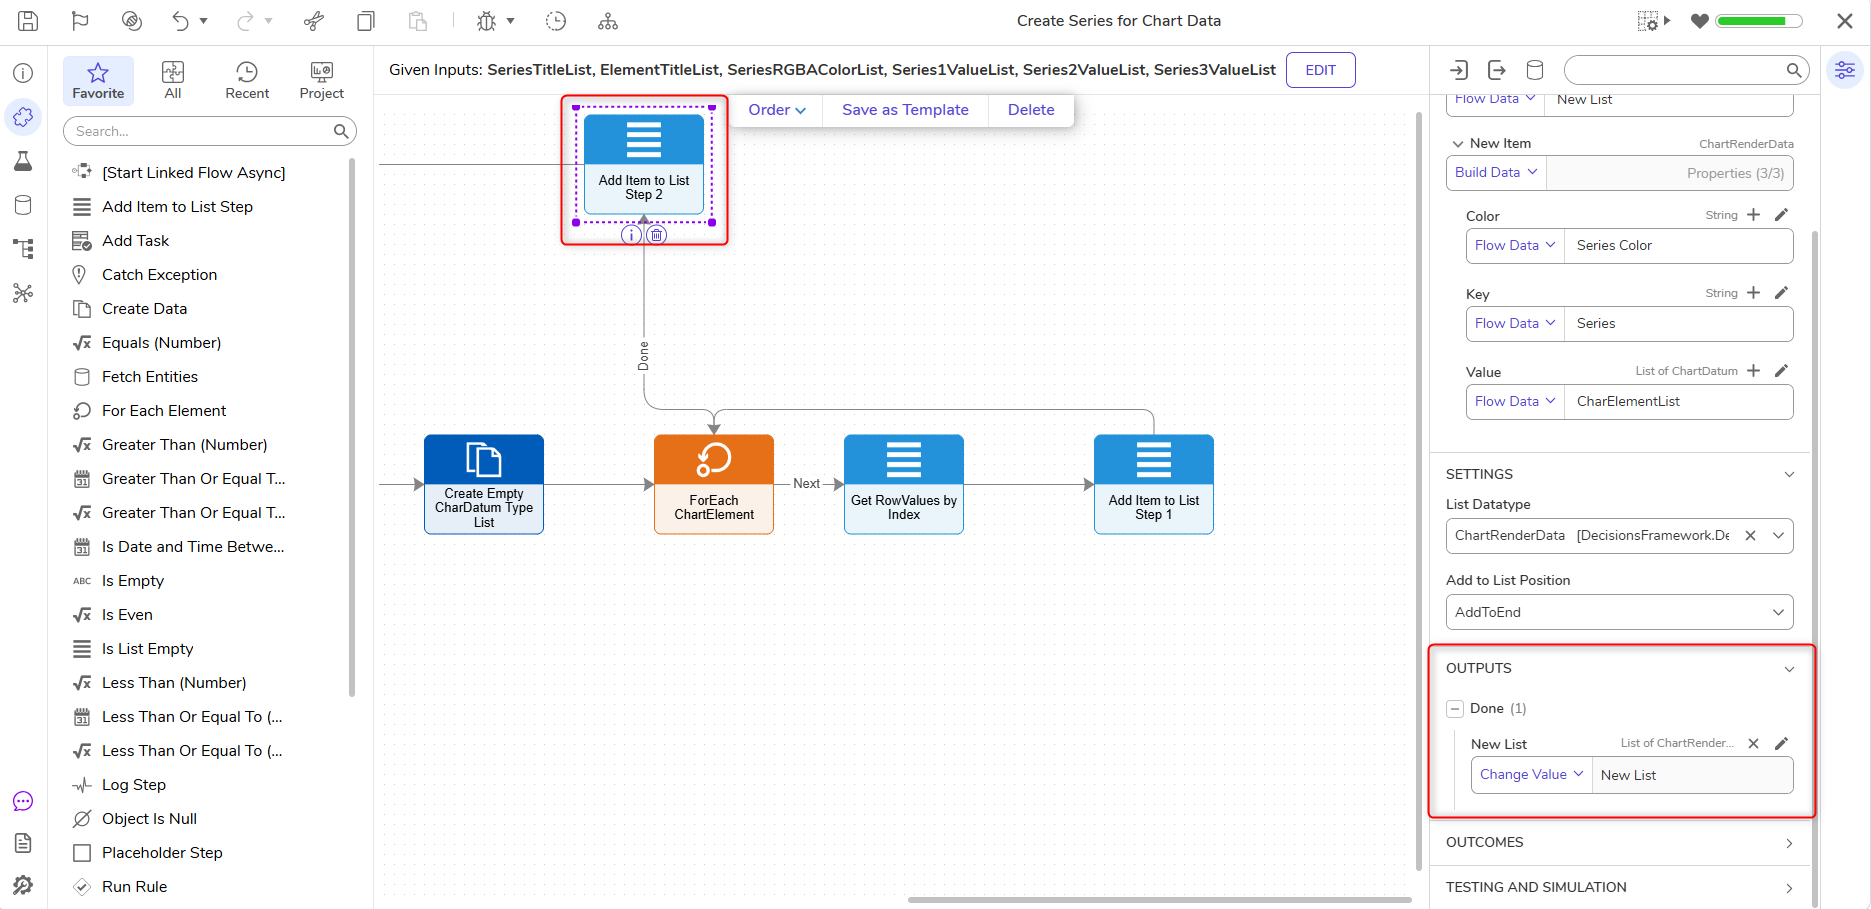
- Next, in the Properties panel of the second Add Item to List step, navigate to the Properties panel > Data > List DataType and choose ChartRenderData using All/Search.
.png)
- Under Inputs> New Item, choose the Build Data input mapping.
- Change the input mapping for Inputs > Color to Select From Flow and choose SeriesColor.
- The Inputs > Key will have a Select From Flow input mapping with Series selected.
- Inputs > Value will also have a Select From Flow input mapping with ChartElementList selected.
- The Inputs > Original List will have a Select From Flow input mapping of ChartRenderData.
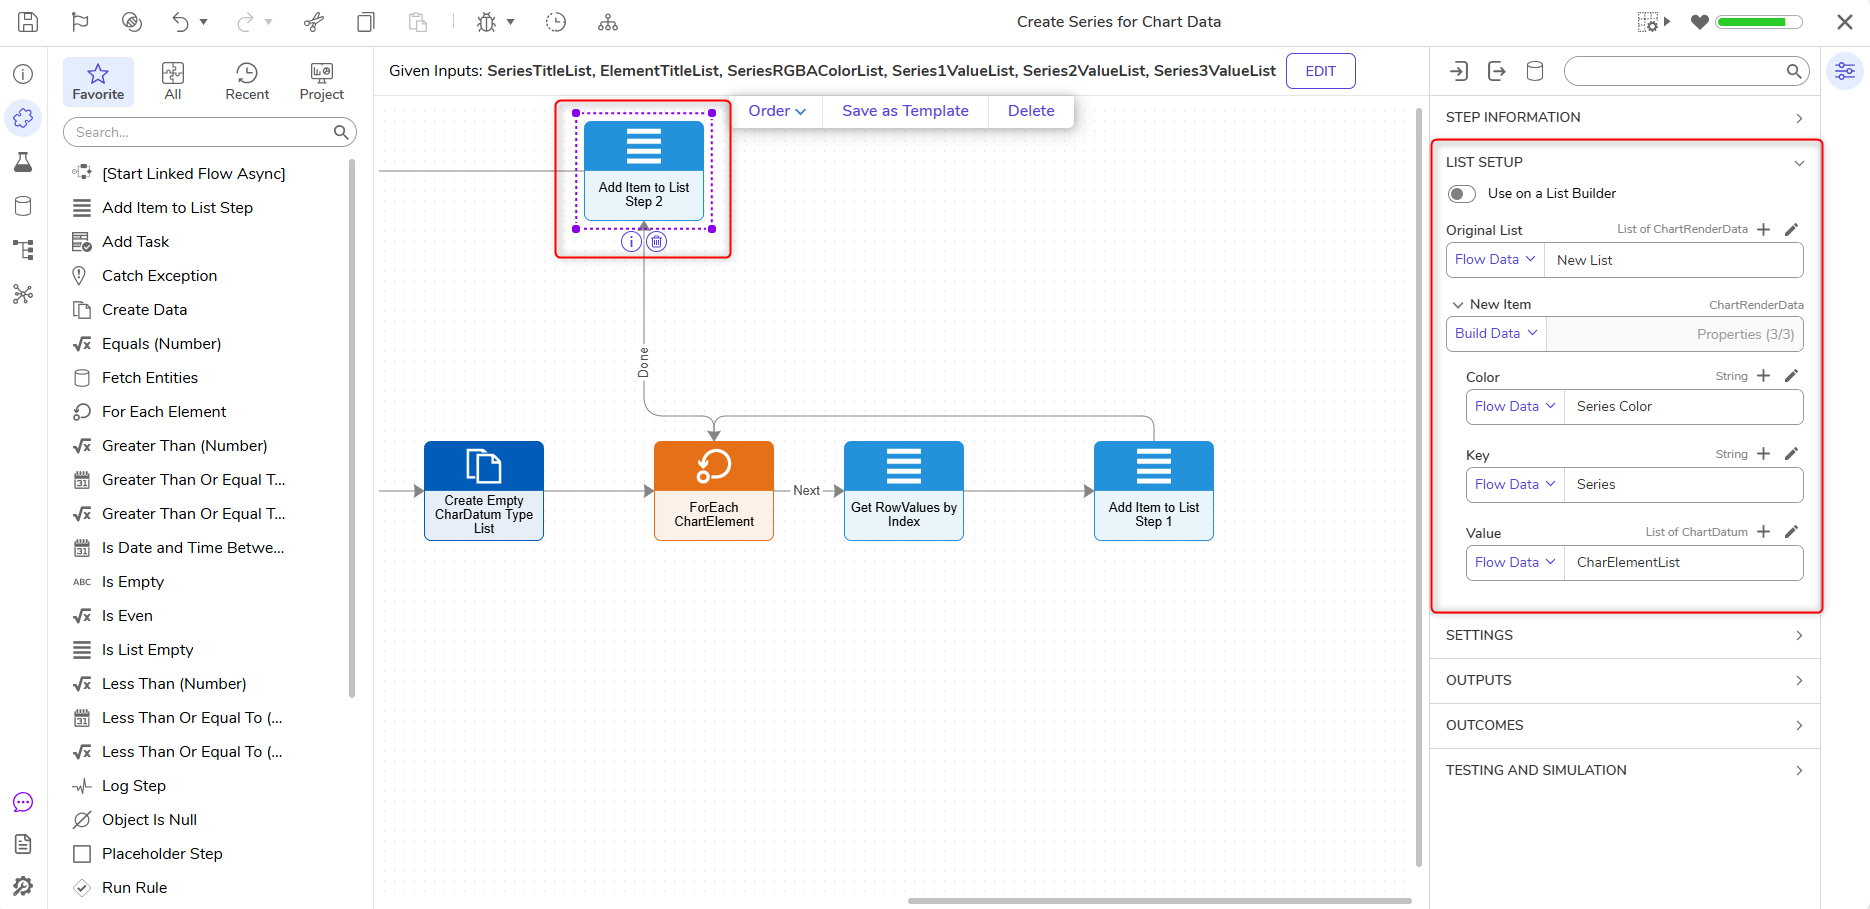
- Navigate to Outputs > Done > New List and set the mapping to Change Value and select ChartRenderData.
- Connect the outcome of the Add Item to List step to the First ForEach Step in the Flow.
- Make sure the Endstep passed the ChartRenderData Output, then save and exit the Flow Designer.
Debugging/Configuring the Final Result
- In the Main Flow Designer, navigate to the Properties panel > Inputs of the SubFlow.
- The Element Title List will have a Constant input mapping. Add Person and Machine.
- Change the Input mapping on the Series 1 Value List to Build Array. Add another item; all items have a Select From Flow input mapping.
- In the Data Input window for Item 0, select Person Accounts and select Count. Click Done.
- In the Data Input window for Item 1, select Machine Accounts and select Count. Click Done.
- Select Constant for Series Rgba Color List and Series Title List.
- For Series Rgba Color List, add rgb(255, 64, 64)
- For Series Title List, select Constant and add Accounts By Usertype.
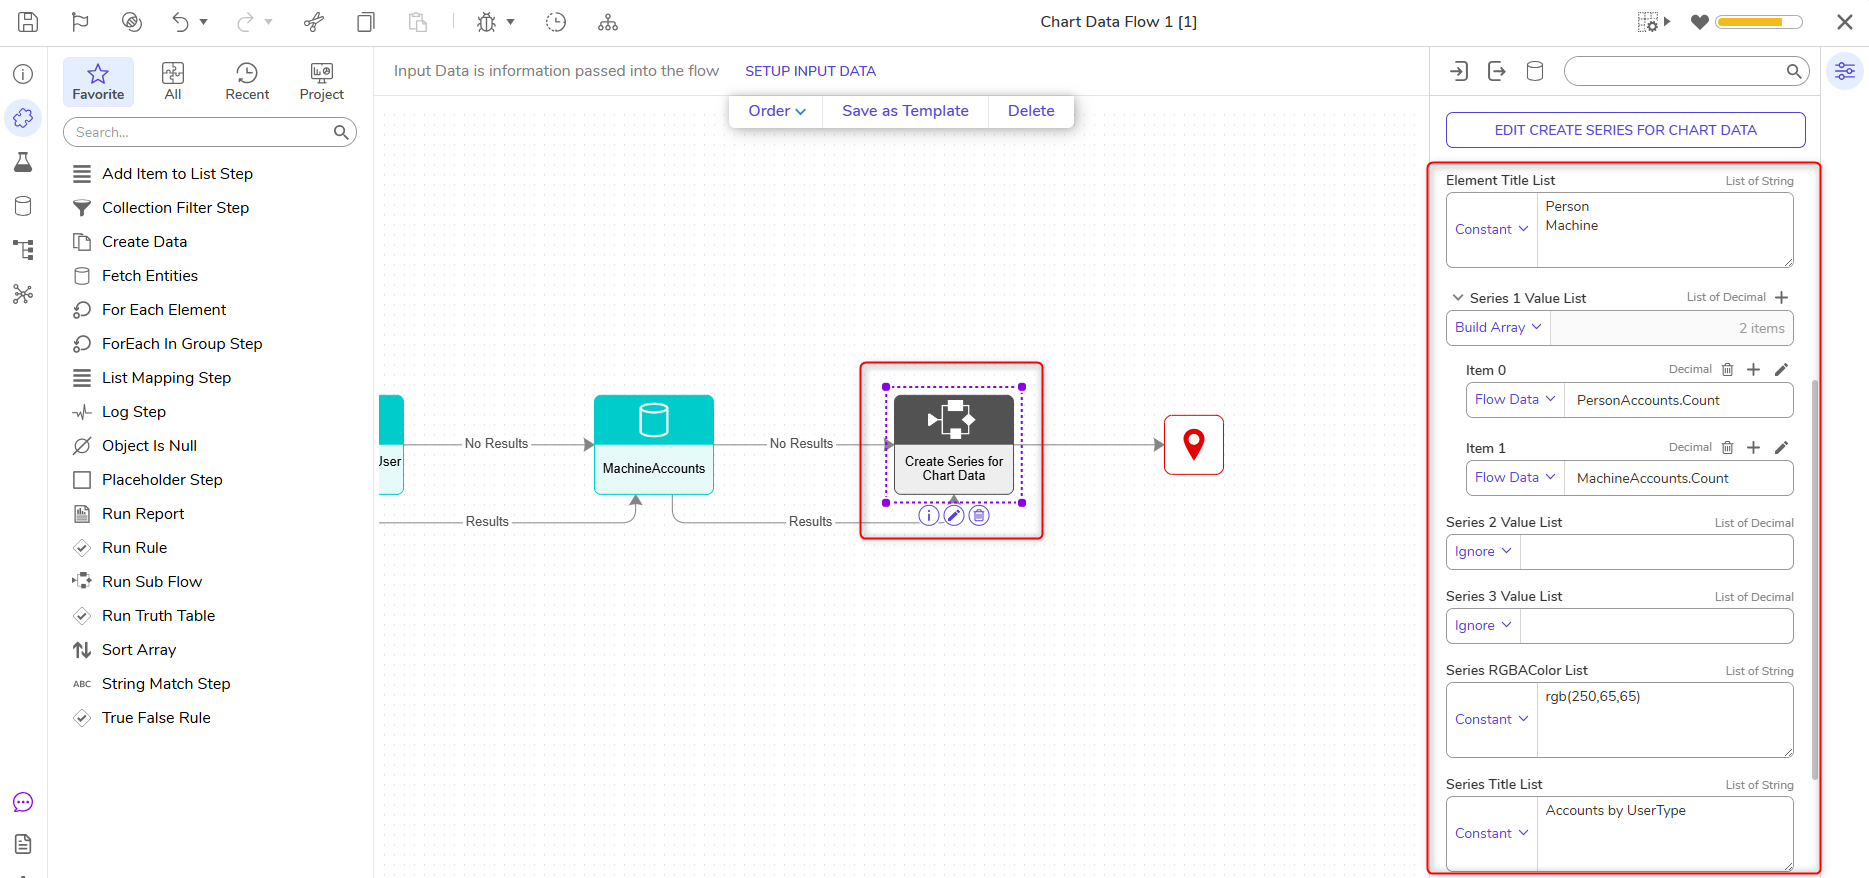
- Rename the New List Output to ChartRenderData.
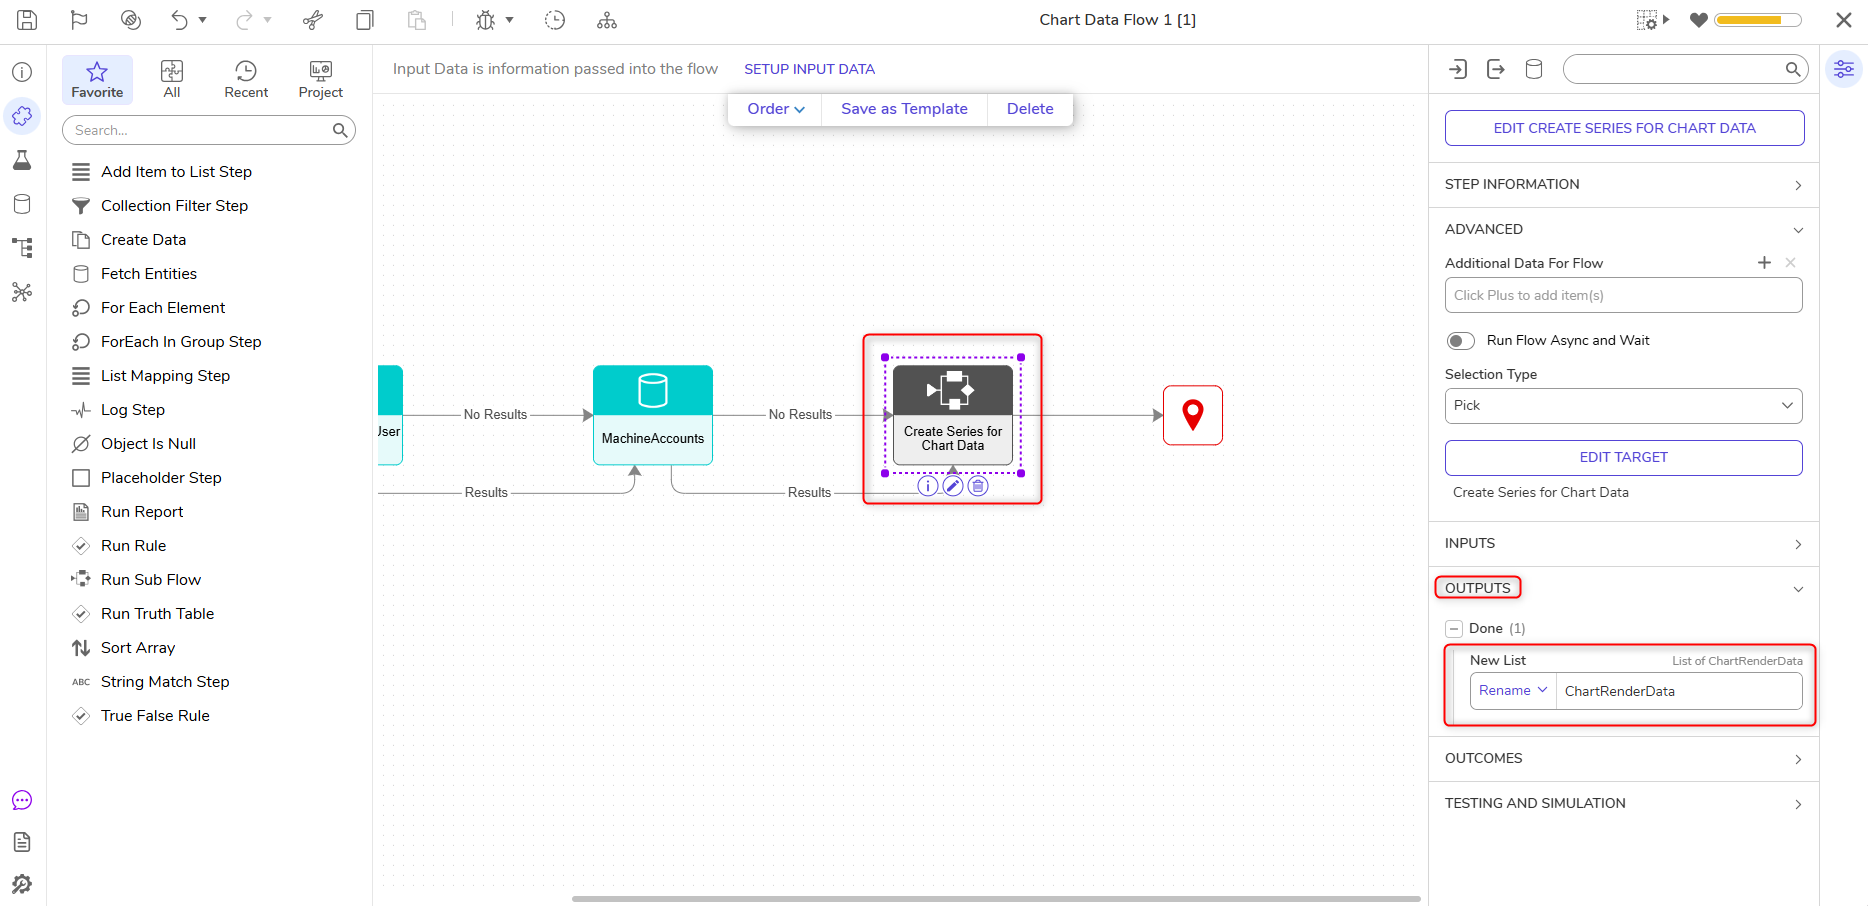
- Connect the Done path to the End Step. Under Inputs, choose Select From Flow and click ChartRenderData.
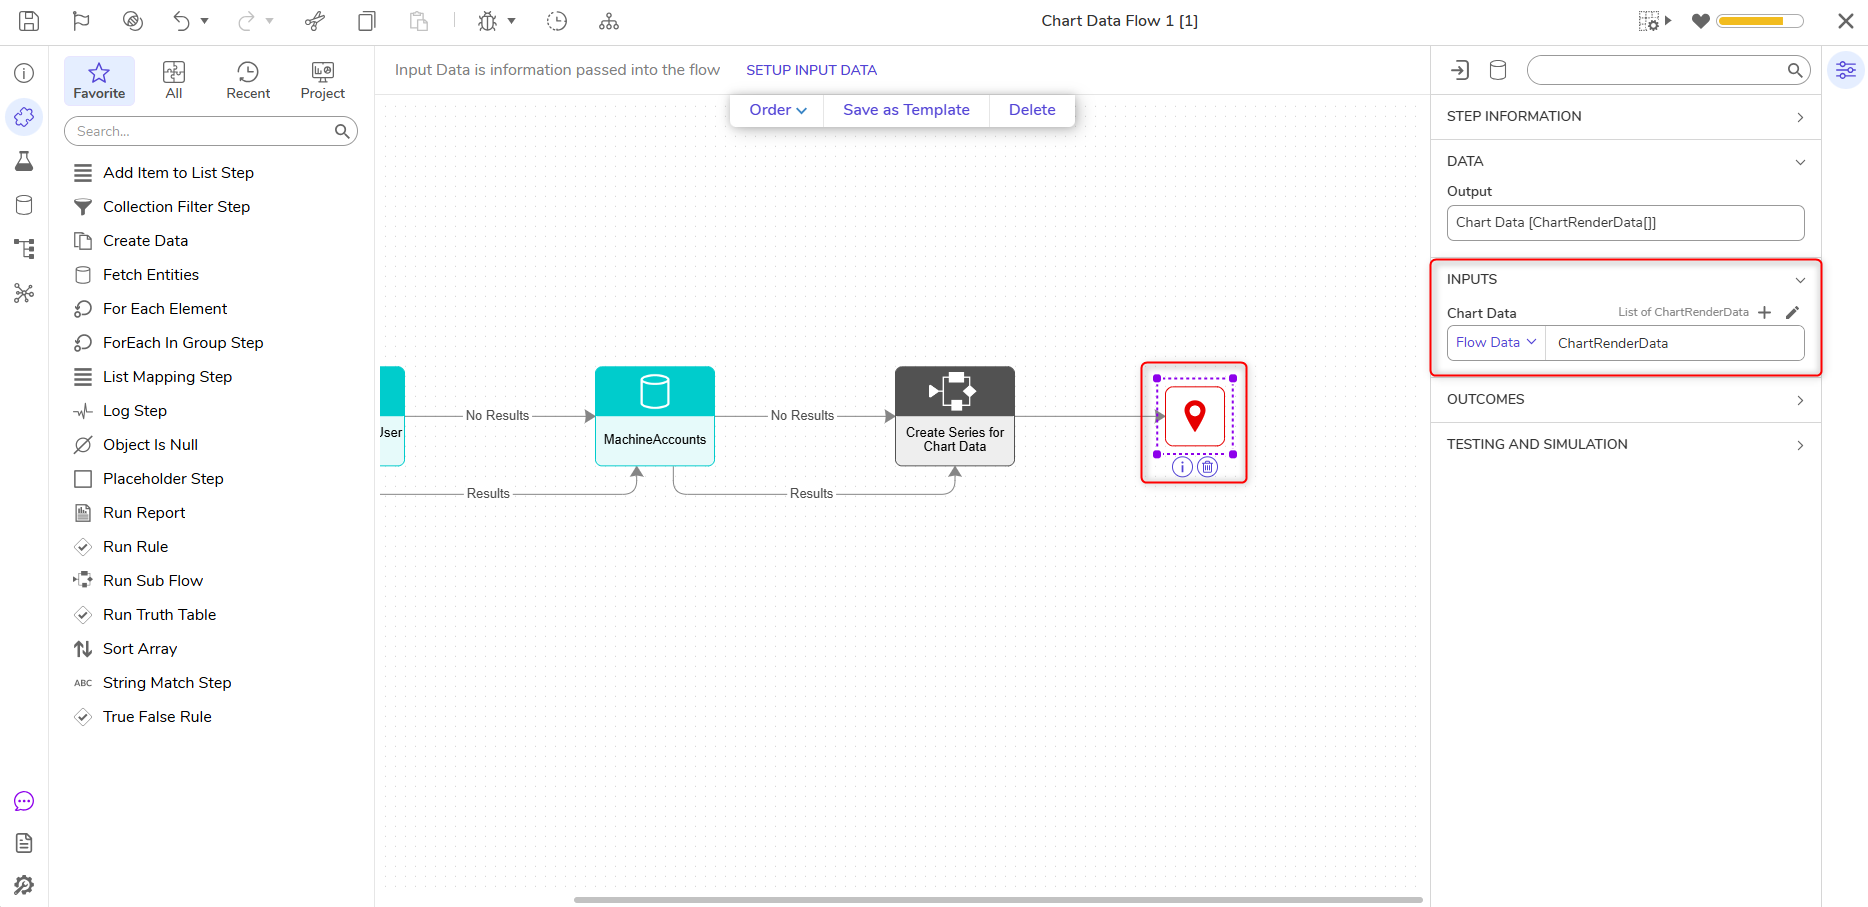
- Save and close the Flow, and then save and close the Page Designer.
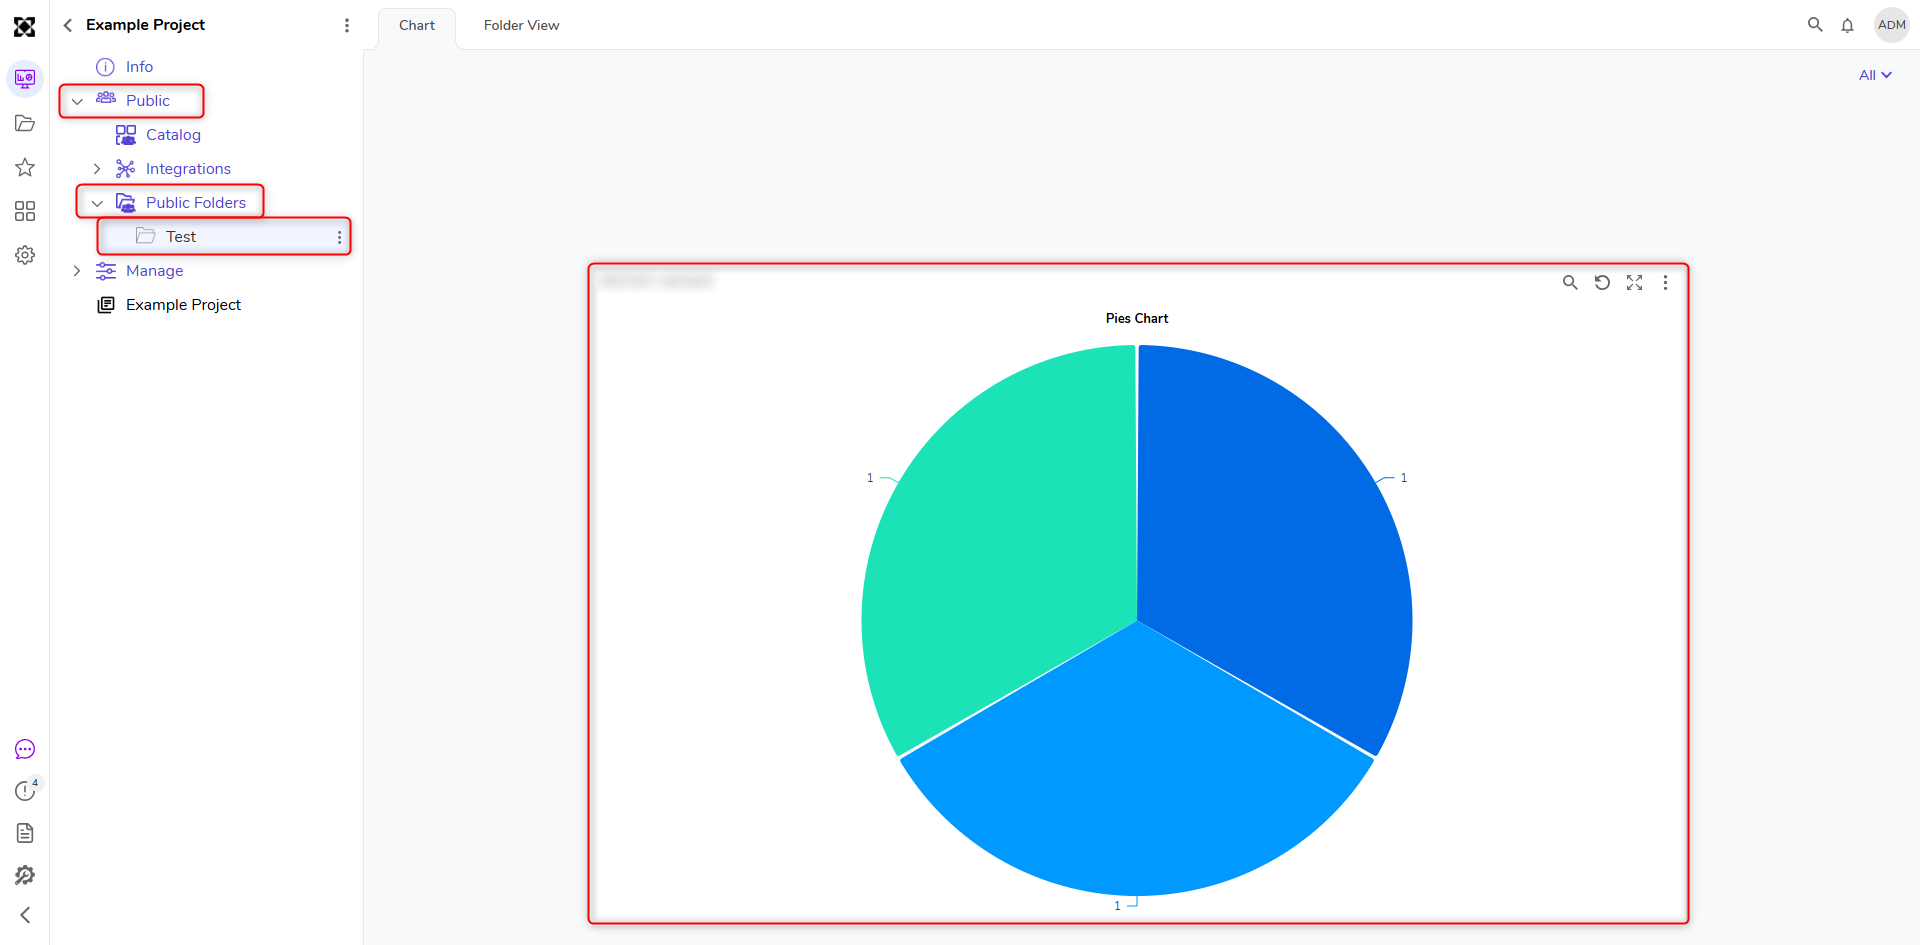
- Add the Page to the Public folder to see the Pie Chart populate with the selected data.