Overview
Users can populate a chart on a Page using Chart Data Modes. The Page Designer currently has three modes: Use Report Subtotals, Use Matrix, and Use Flow. Users can access these Modes in the Properties Panel once a chart is added anywhere on a Page.
Types of Chart Data Modes
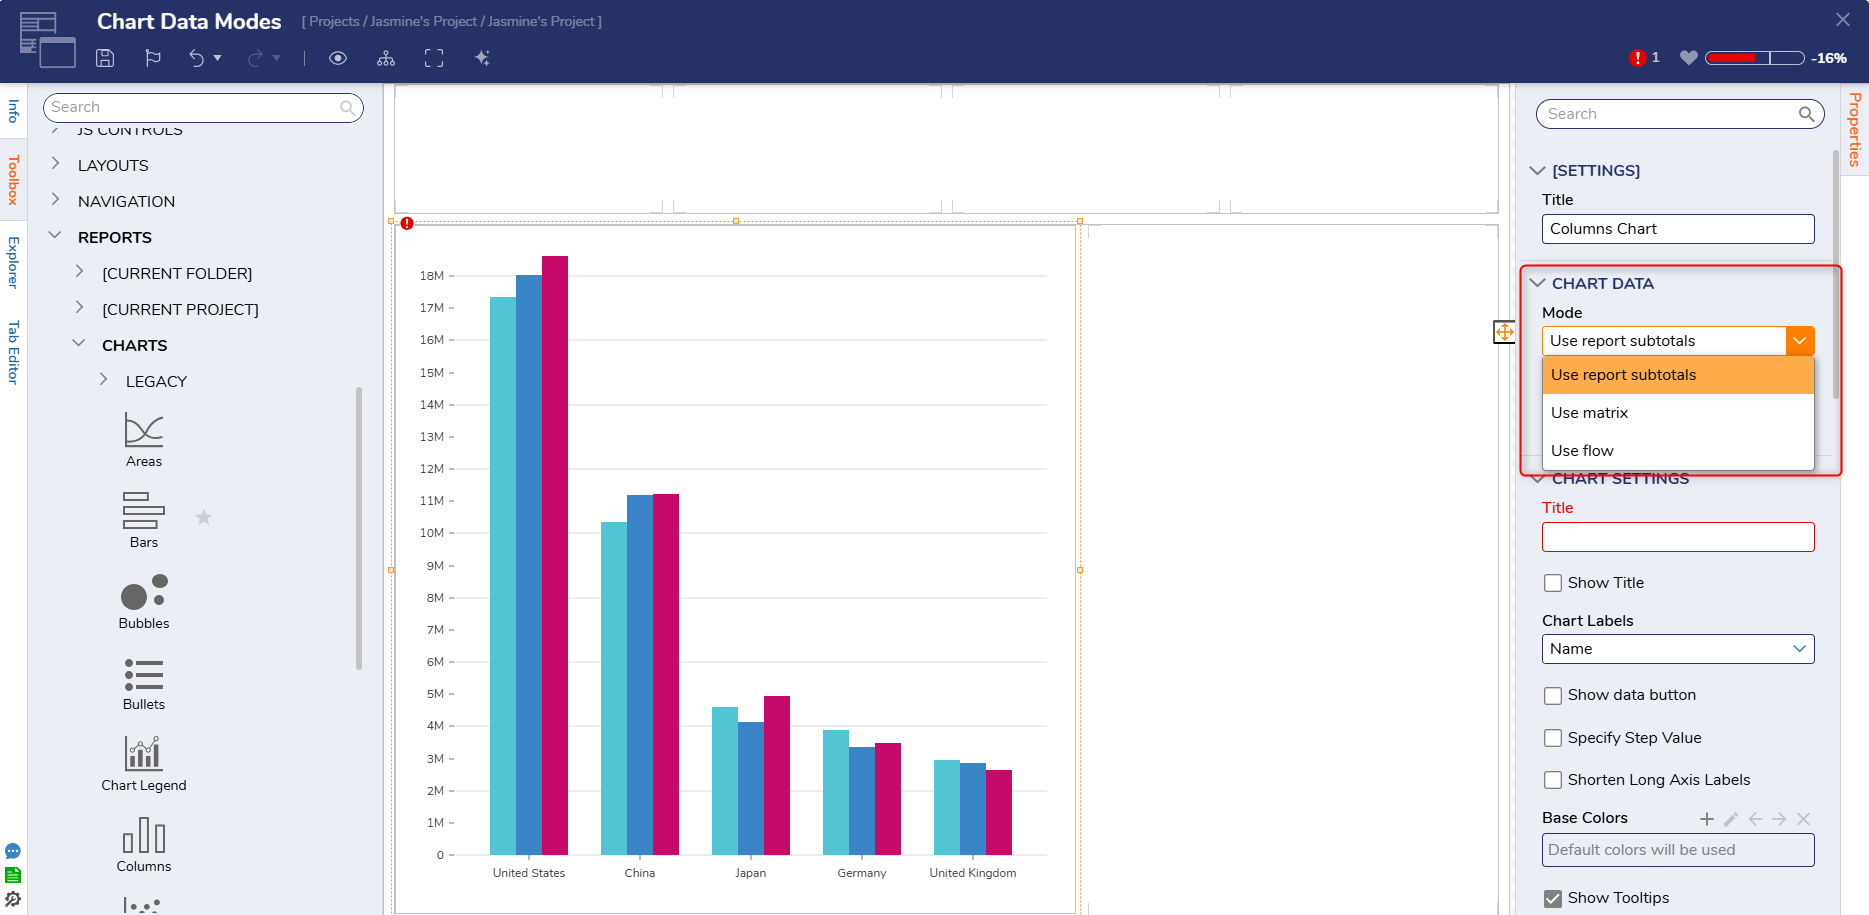
The Page Designer has three different types of Data modes for Charts applied to a Page:
Use Report Subtotals: This mode allows Users to select a new or existing Report and configure Data Sources, Filters, etc. Once the Report is configured, the chart will populate the selected data. 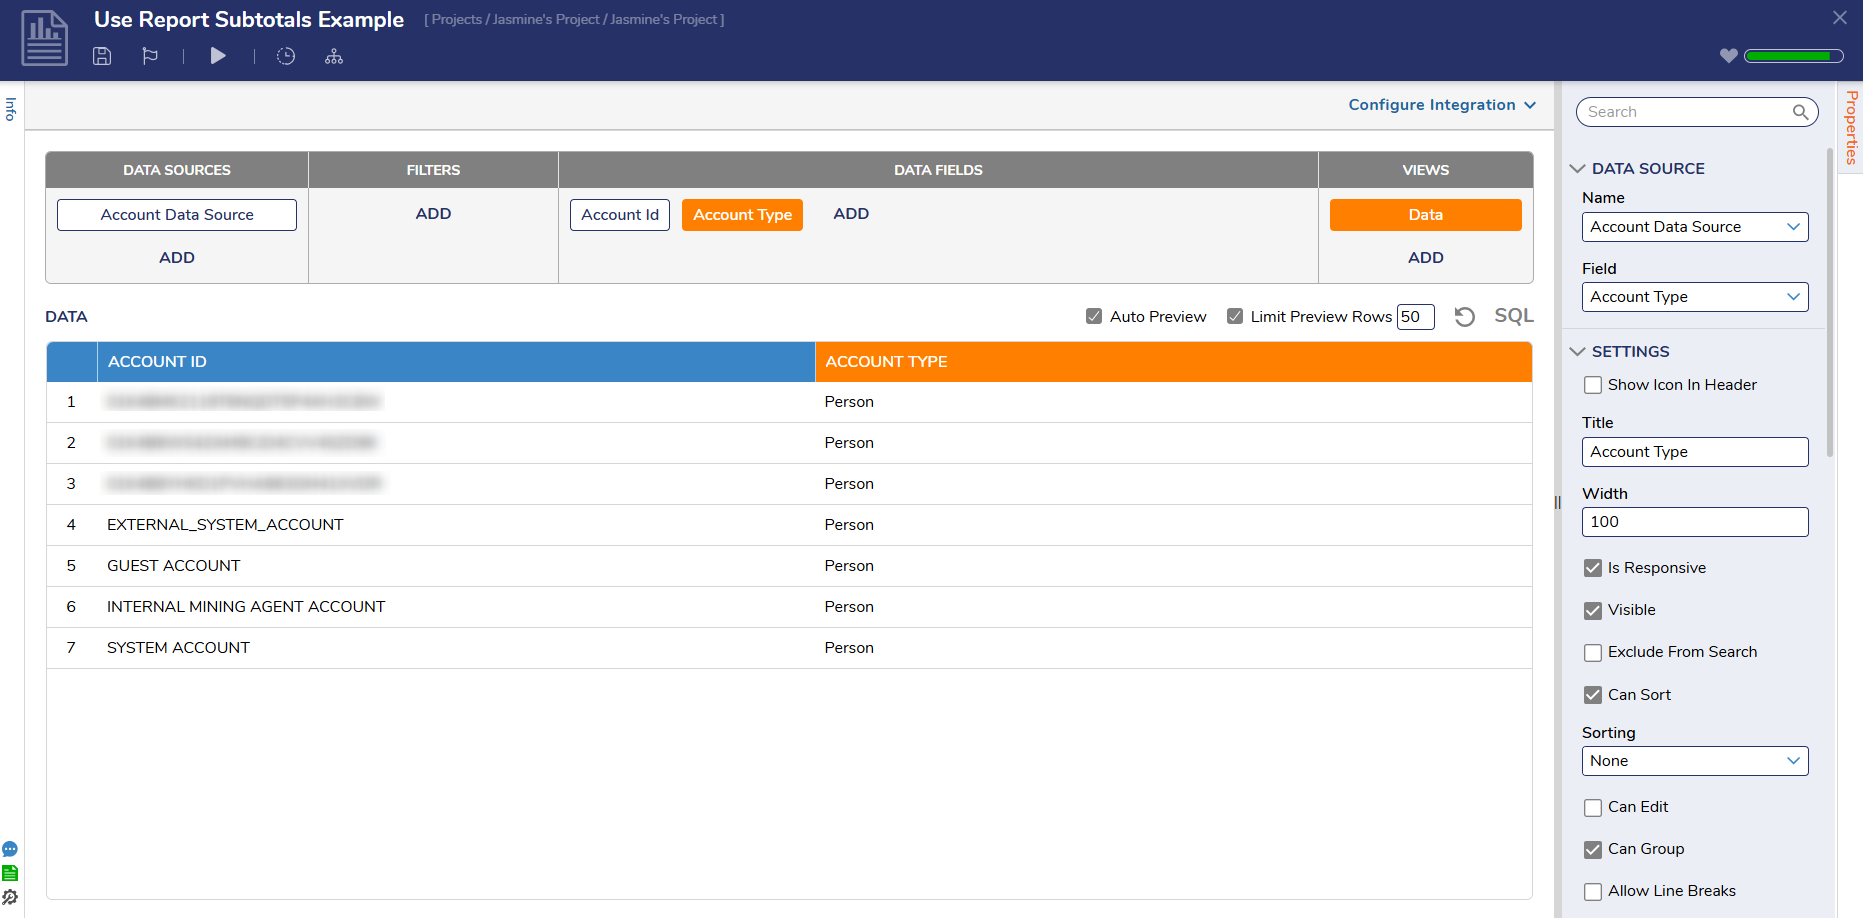
Use Matrix: This mode also utilizes Report data, but requires Users to select the Matrix View. Once the Matrix View is selected, different dimensions can be added as desired. 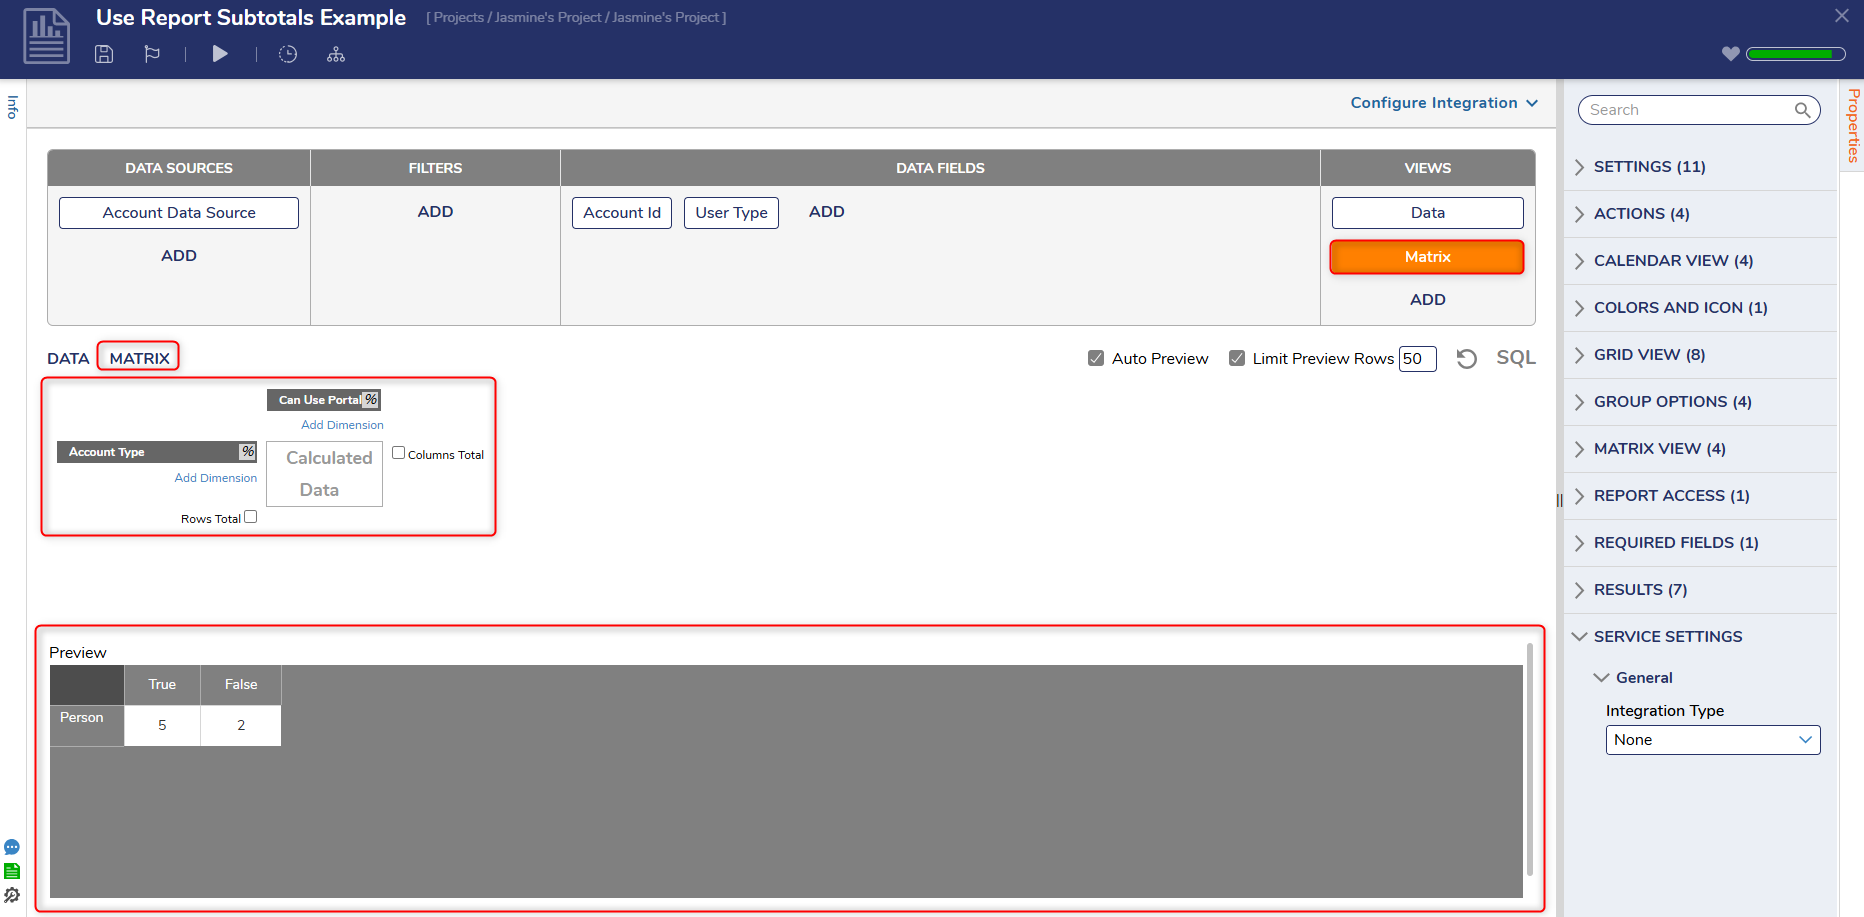
*Users should note that Rows Total must be clicked to properly display the chart with the selected data values. 
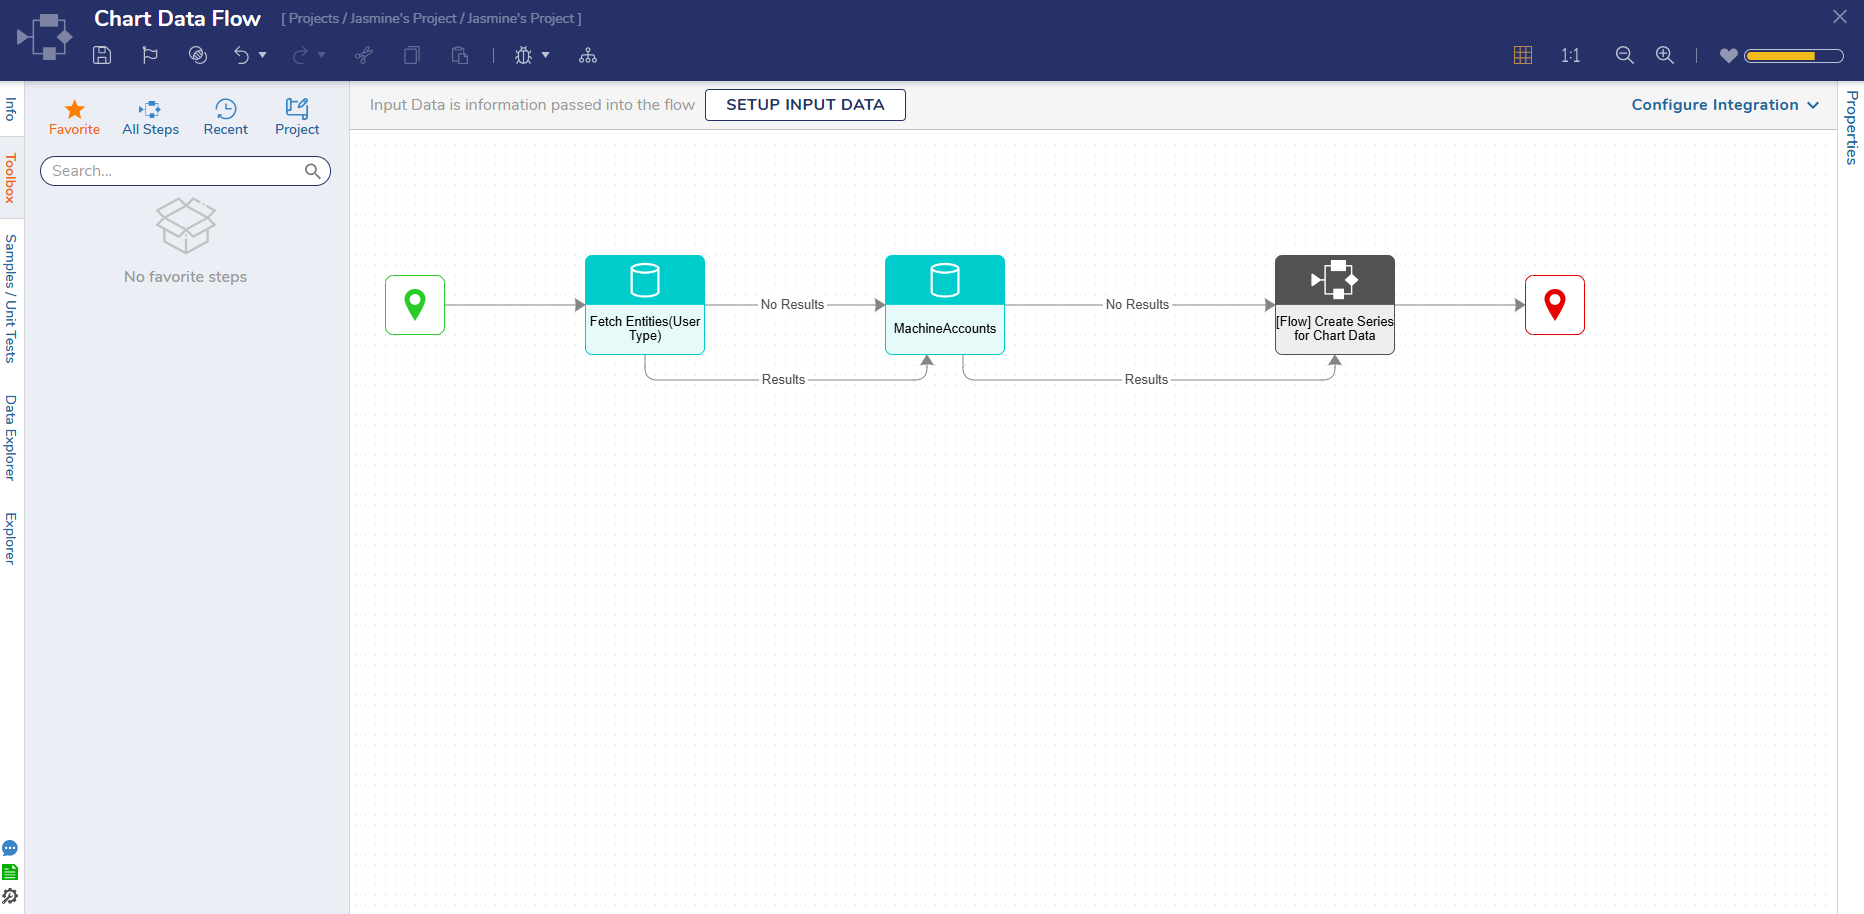
Use Flow: This Mode allows Users to select a new or existing Flow, and uses the data from steps added to the Flow to populate the chart.
How to Select a Chart Data Mode
To select a Chart Data Mode:
- Create a new Page or open an Existing Page.
- Open the Page and navigate to Reports > Charts in the Toolbox. Select a Chart from the Toolbox. The Chart Data Mode options will appear with any chart selected from the toolbox.
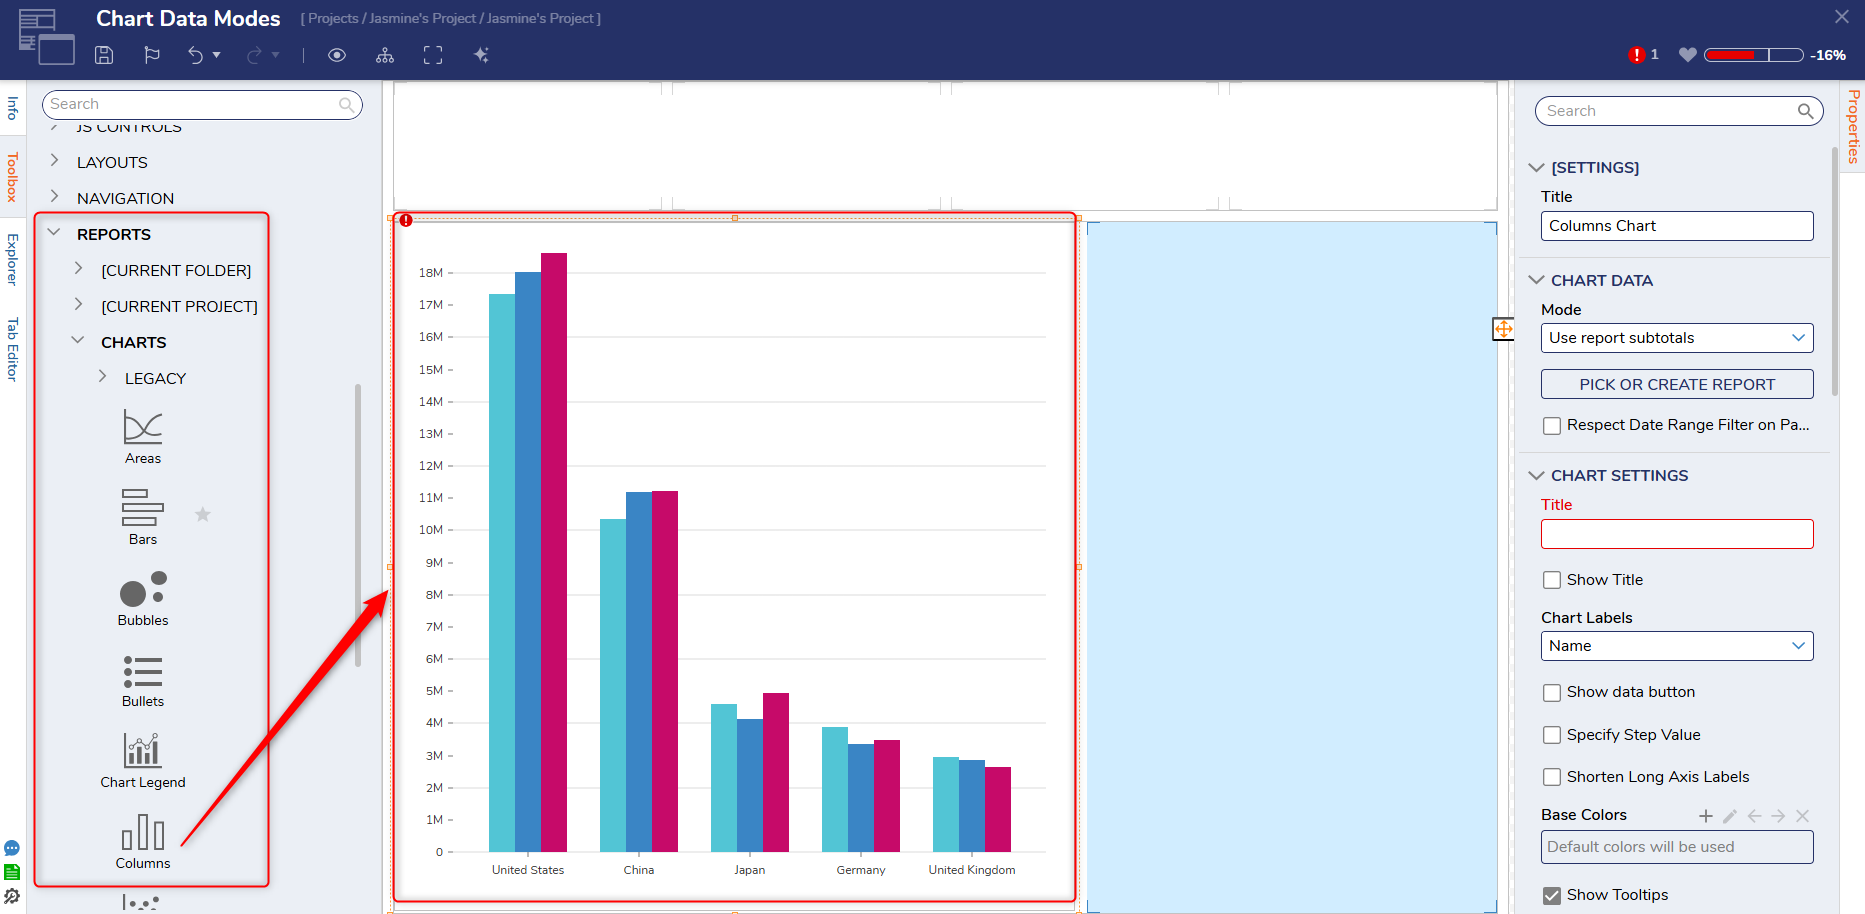
- Once a chart is selected, navigate to the Chart Data section of the properties panel.
- From here, select the desired mode that will populate the selected chart.
Example
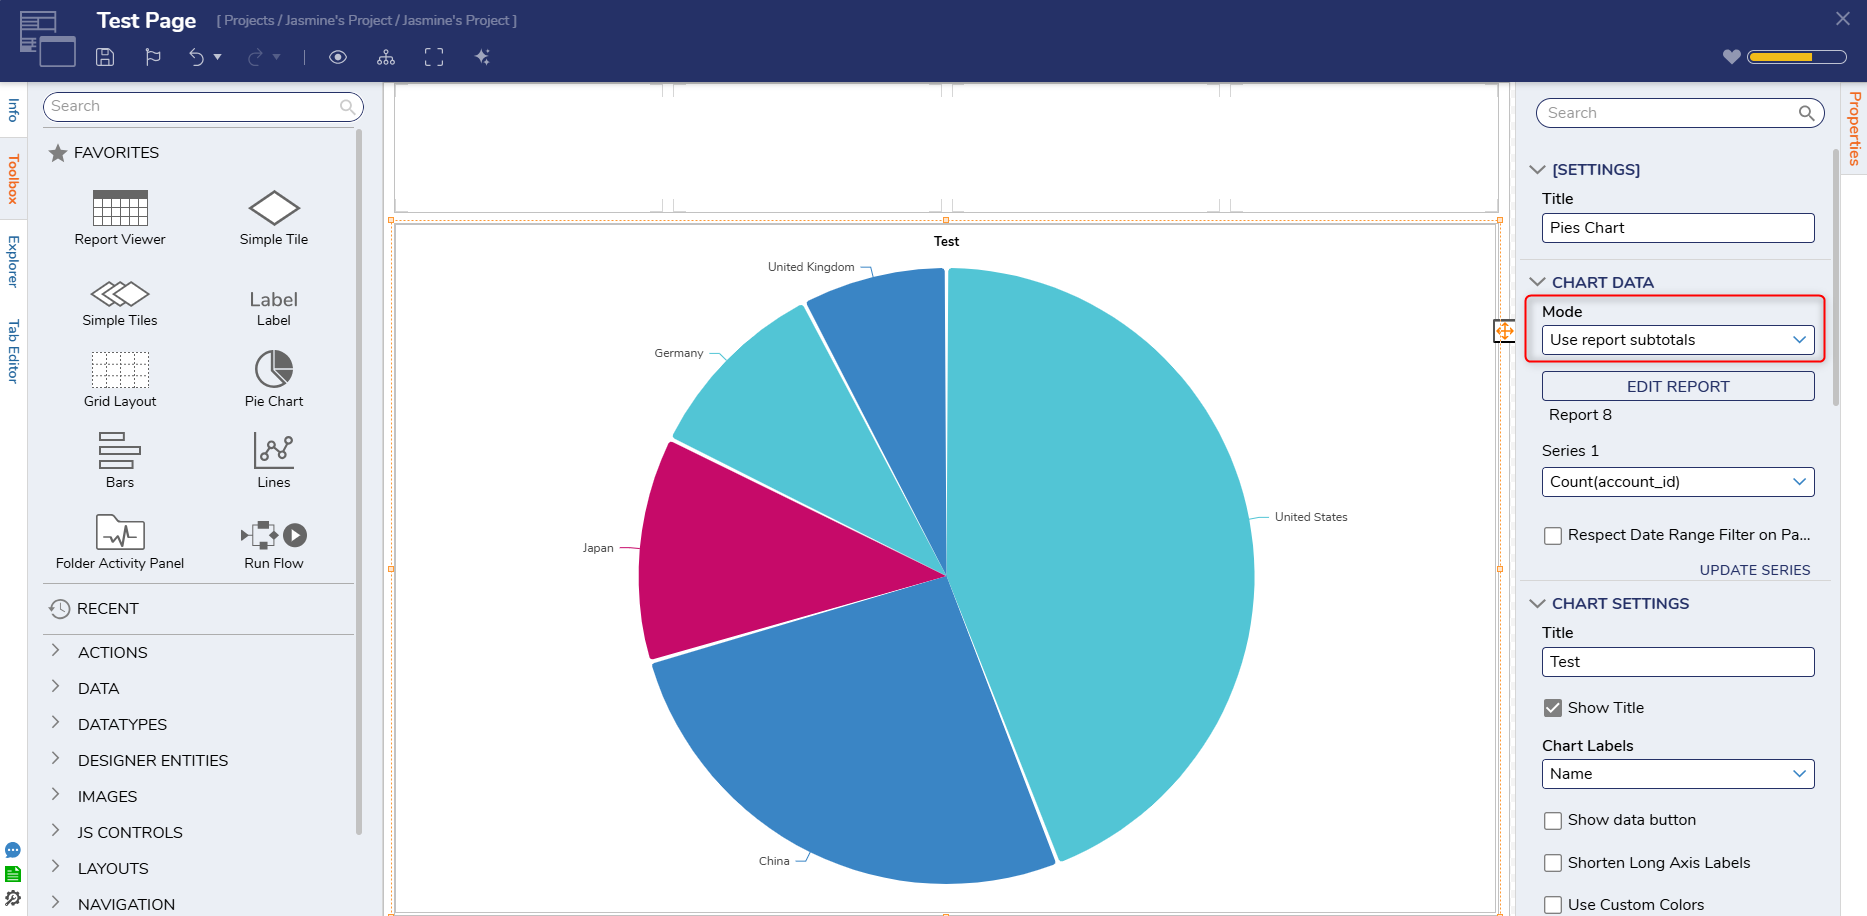
The following example demonstrates how to add a Pie Chart to a page and populate the chart using the 'Use Report Subtotals' Chart Data mode. This example will utilize the Account Data Source, Account ID, and Account Type as the data fields.
- Add a Pie Chart to a Page.
- Choose a name for the title and select the Use Report Subtotals Chart Data Mode.
- Click Create New Report. Users can also select an existing Report if one has already been created. Choose a name for the Report and select Create.
- In the Report Designer, choose a Data Source, a Filter (if desired), and Fields to populate the chart with data.
- Once the Report is customized as desired, select the Group by icon next to at least one field. The chart will not display data if no fields are grouped on the Report.
.png)
- Save and close the Report and return to the Page Designer.
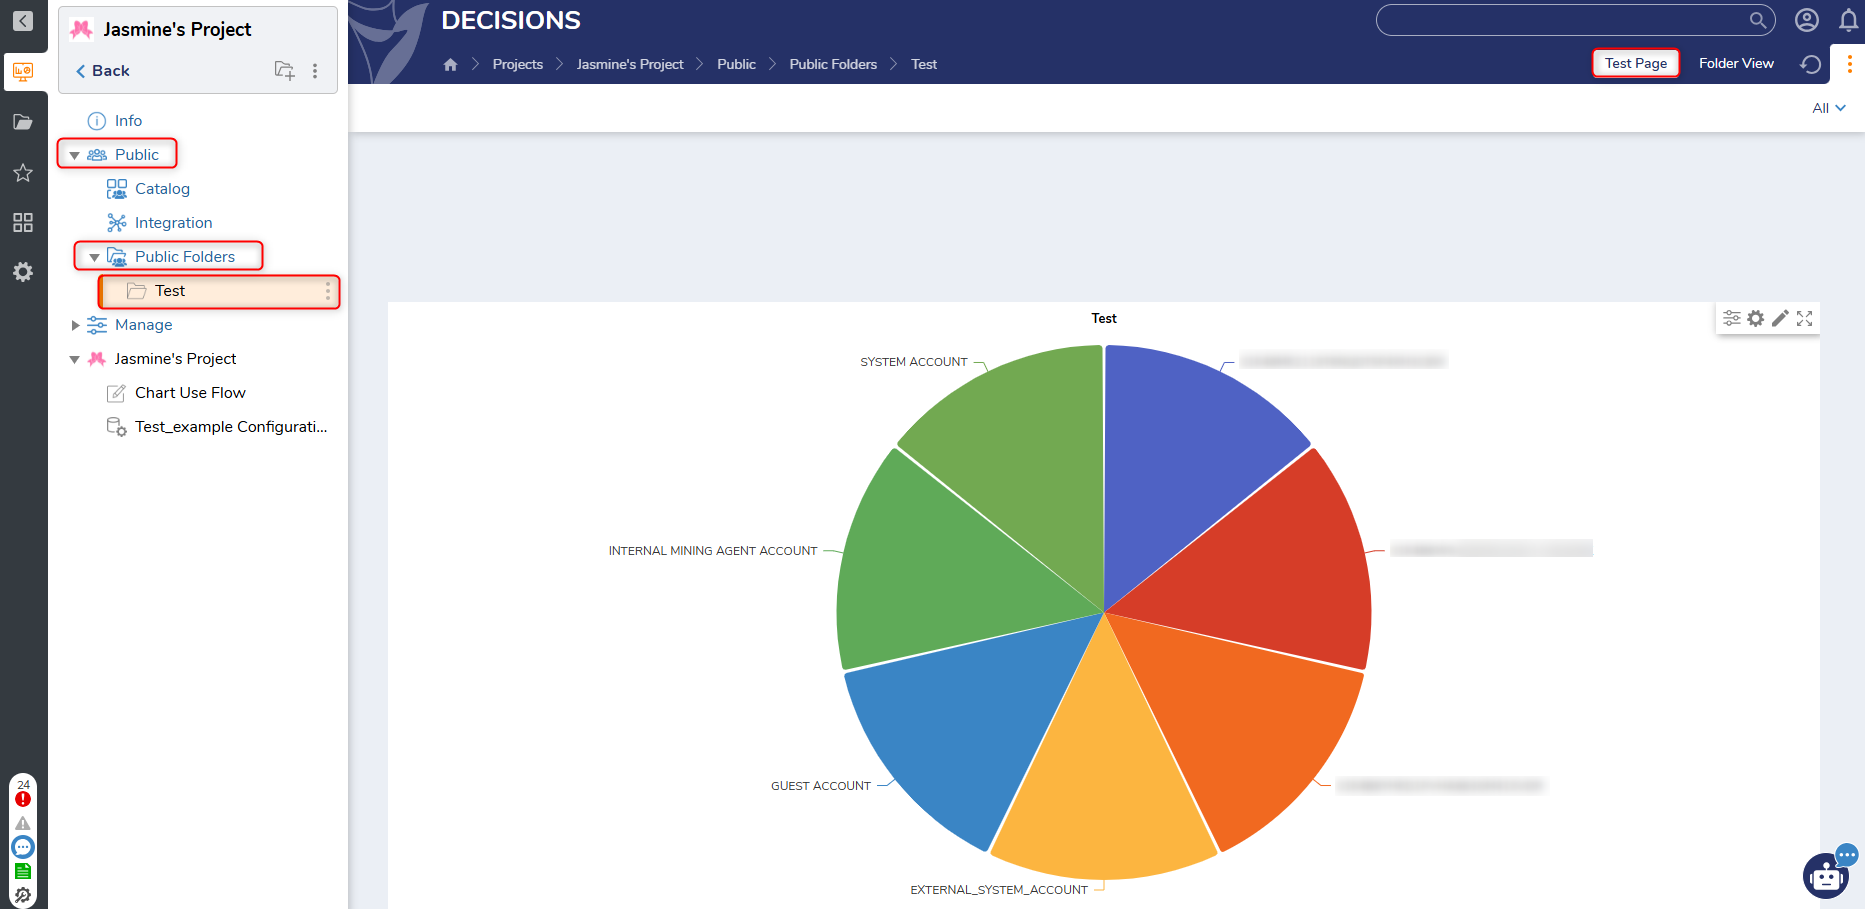
- Save and close the Page Designer. Users should note that the chart will not be visible until the Page is added to a public Folder.