Overview
Diagram Tiles use a modified Flow Designer to create a Page/Dashboard Tile that can display information as charts or images on a Page. One of these charts is the Bars chart, which can be used to display information as a bar graph.
Adding a Bars Chart to a Diagram Tile
This example will show how to set up a bar graph using the Bars chart in the Diagram Tile Flow Designer. Other chart controls will have a similar process.
- Create a new Page and Dashboard.
- In the Page Designer, expand the Tiles section in the Toolbox tab, then select and move the Diagram Tile control into the workspace.
- With the control selected, expand the DIAGRAM TILE section of the properties and select PICK DIAGRAM TILE FLOW.
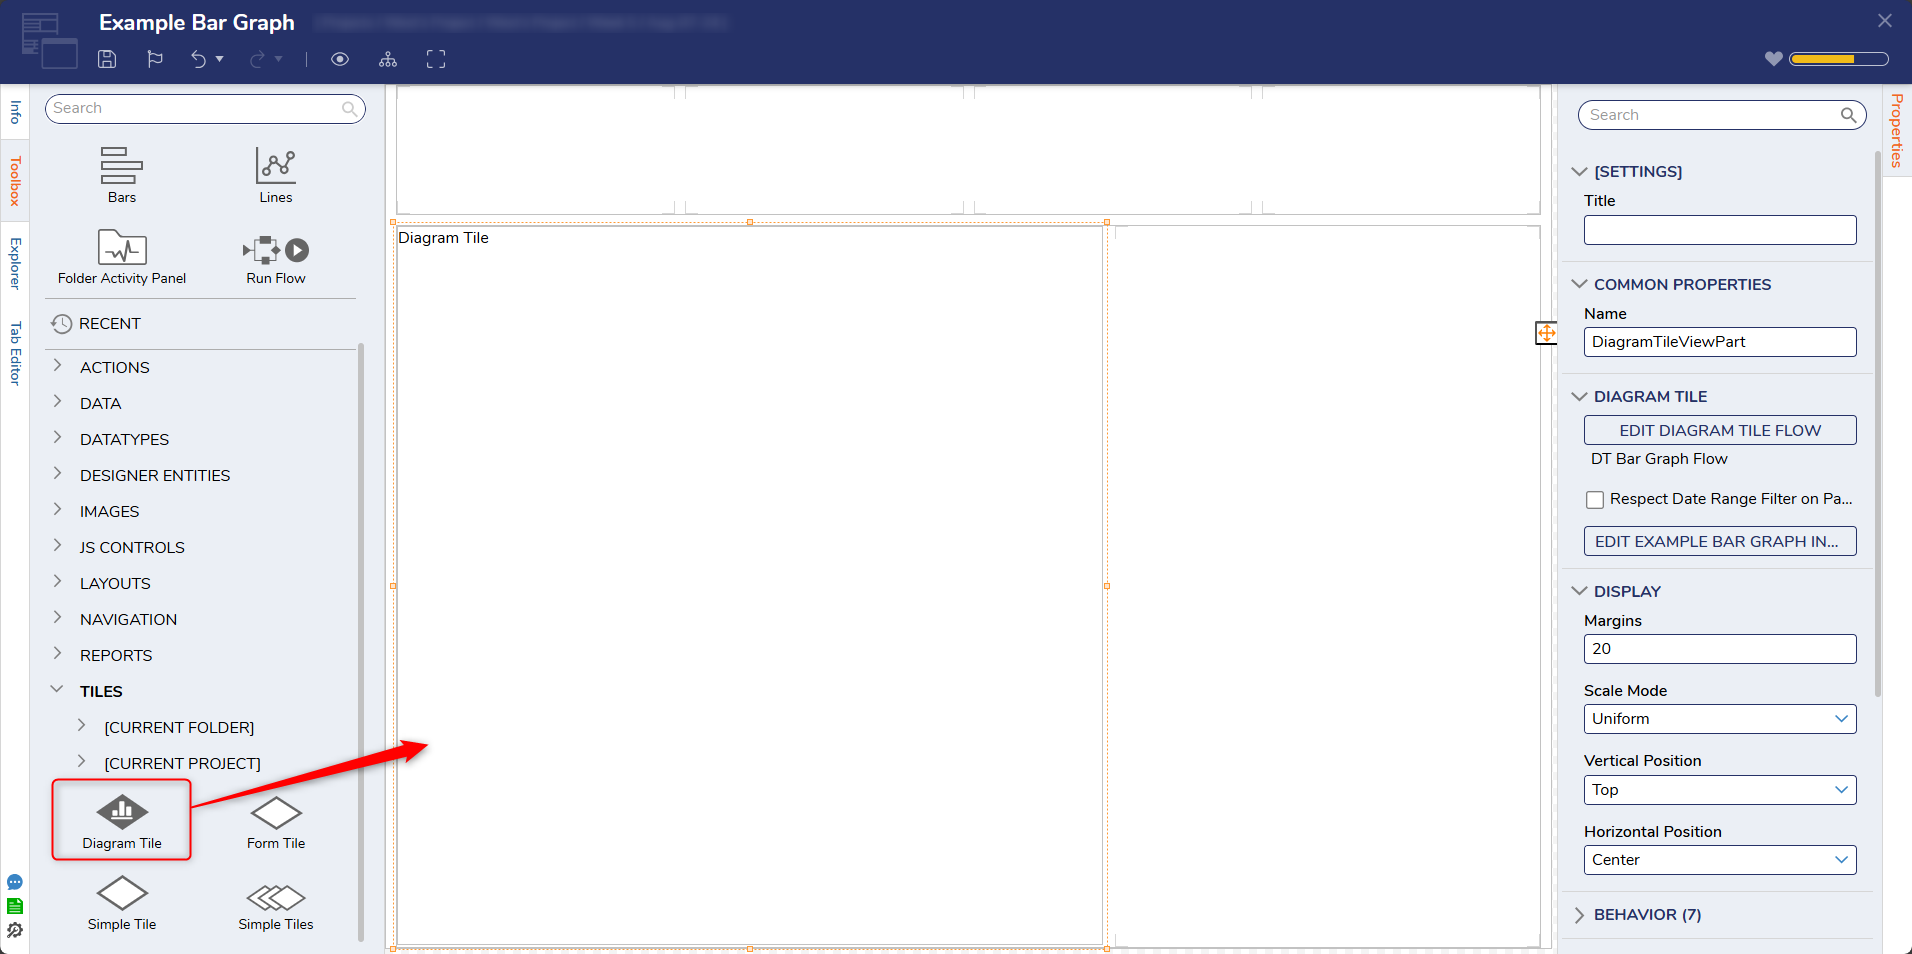
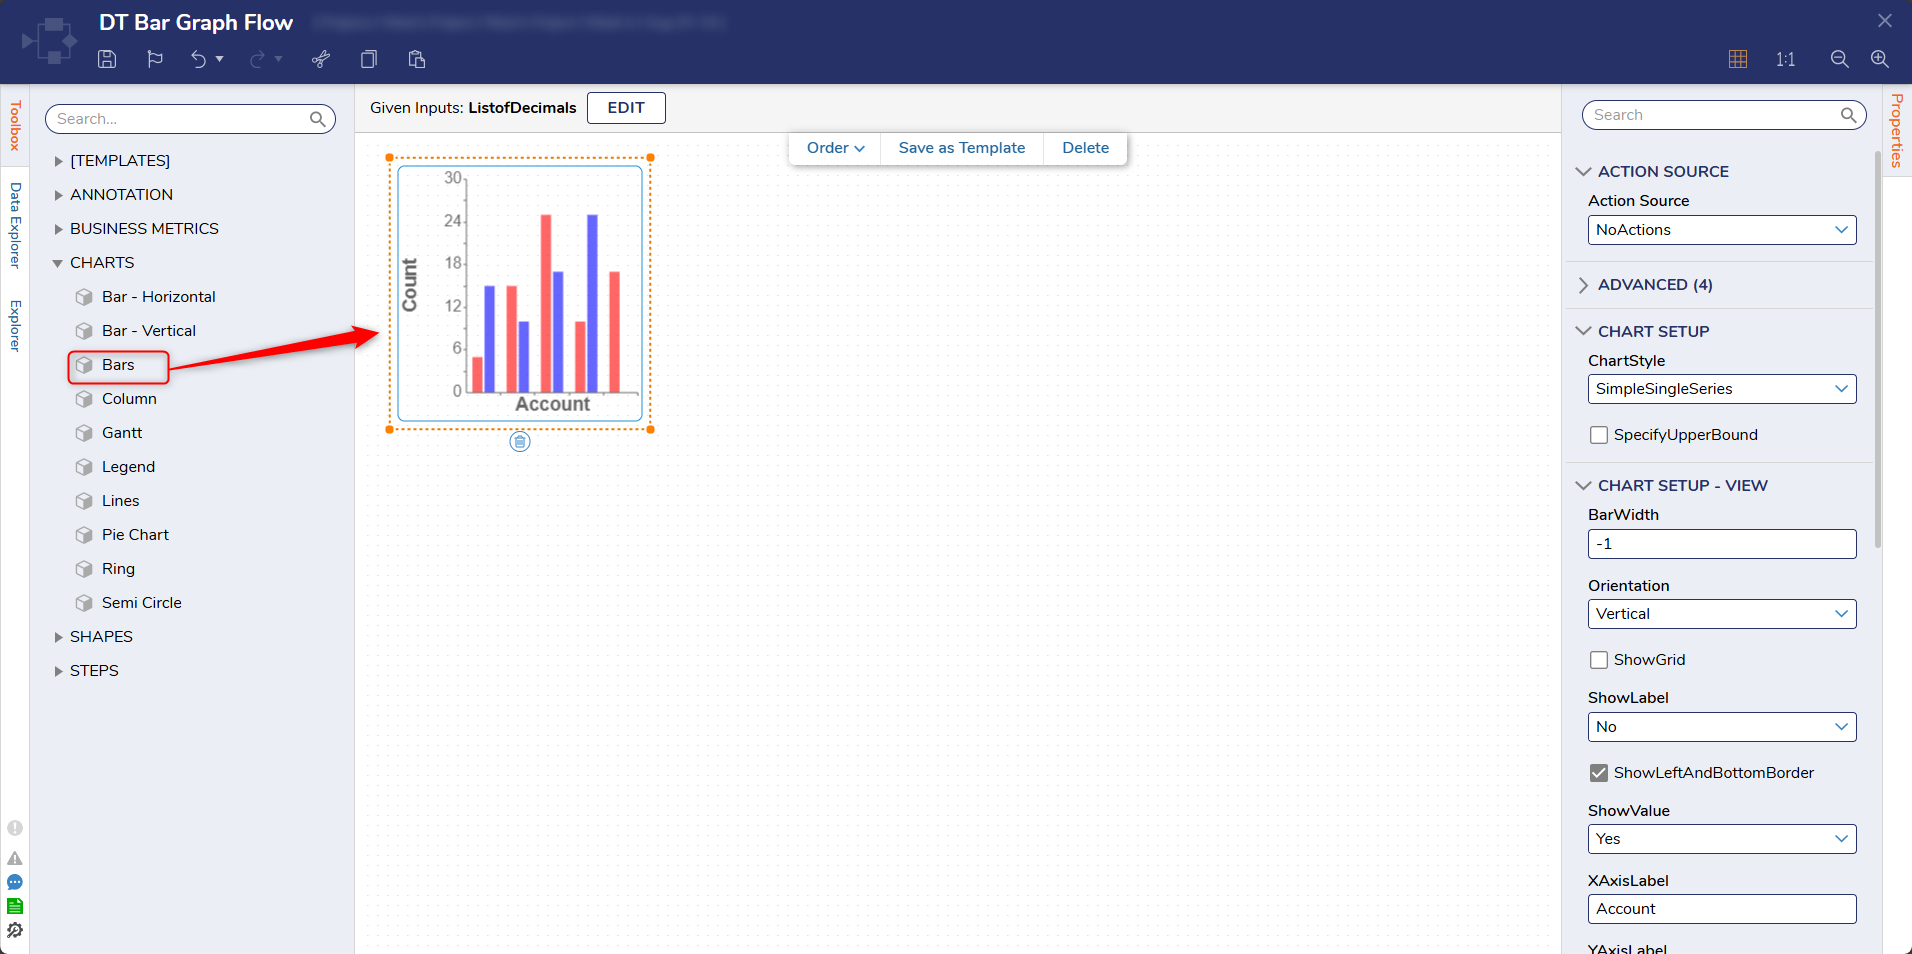
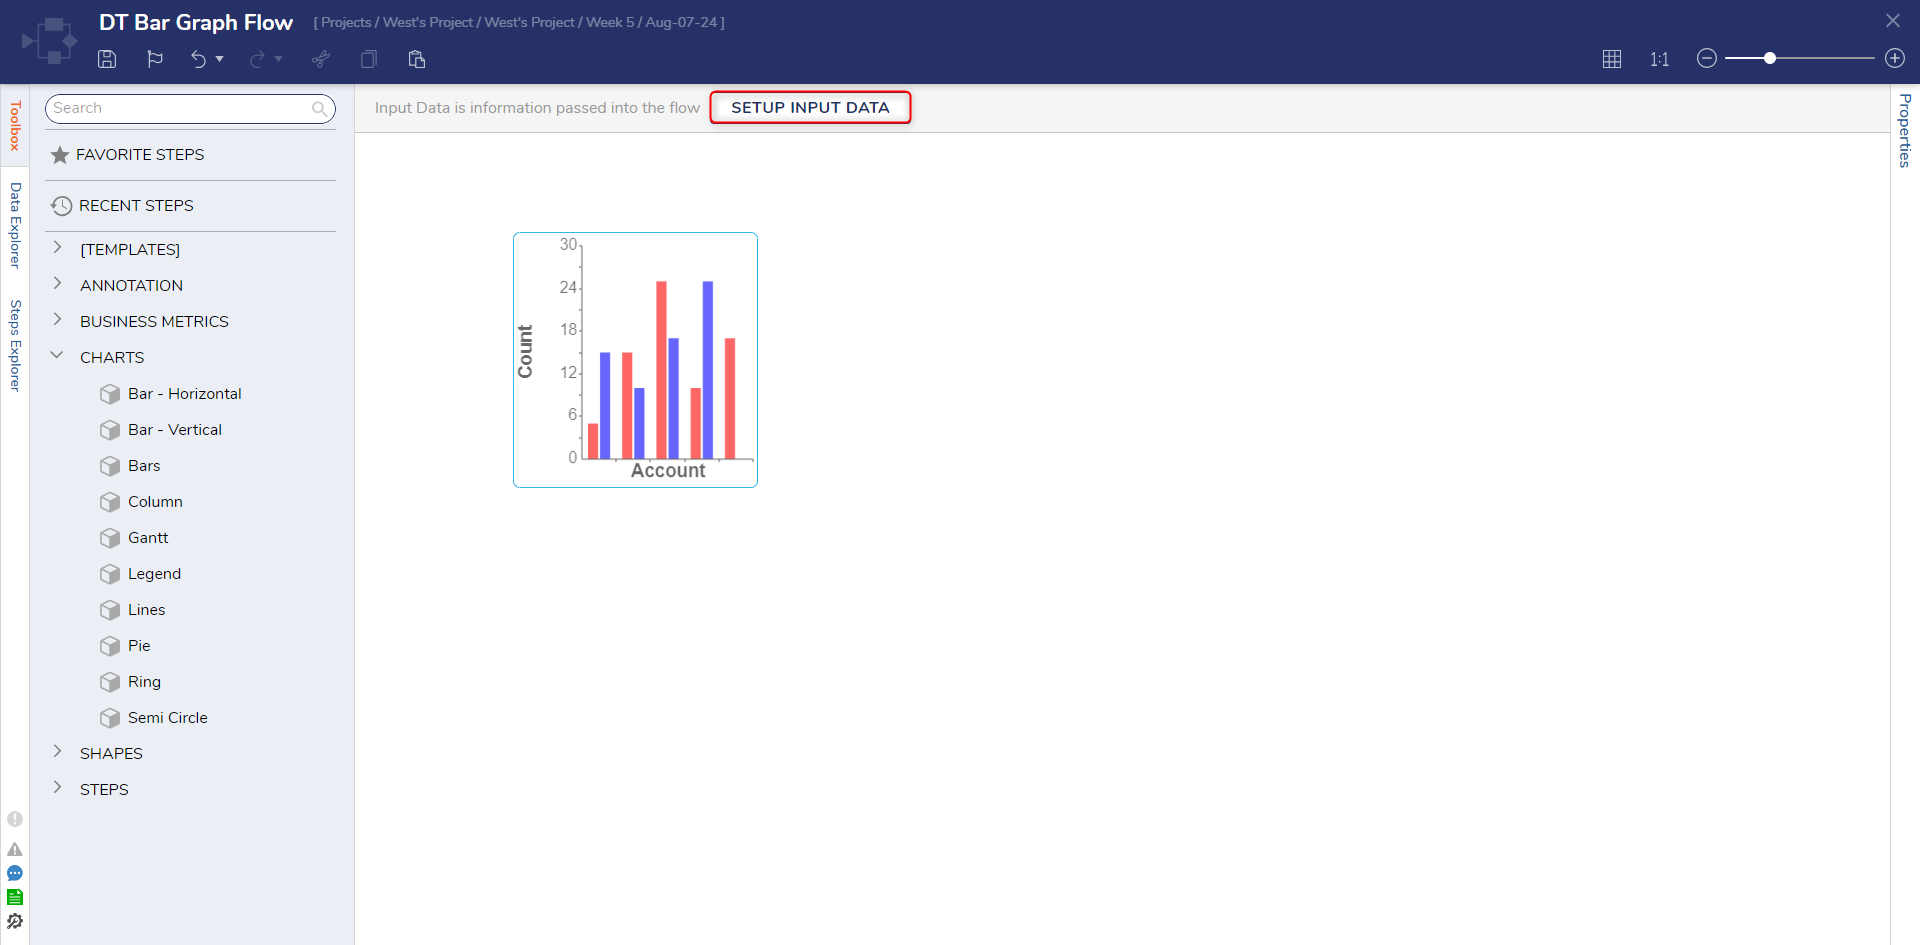
- The Diagram Tile Designer will open. In the Toolbox, Expand the CHARTS section of the Toolbox and move the Bars control into the workspace.
Bars Properties
Below is an overview of the settings found in the Properties panel for the Bars Chart.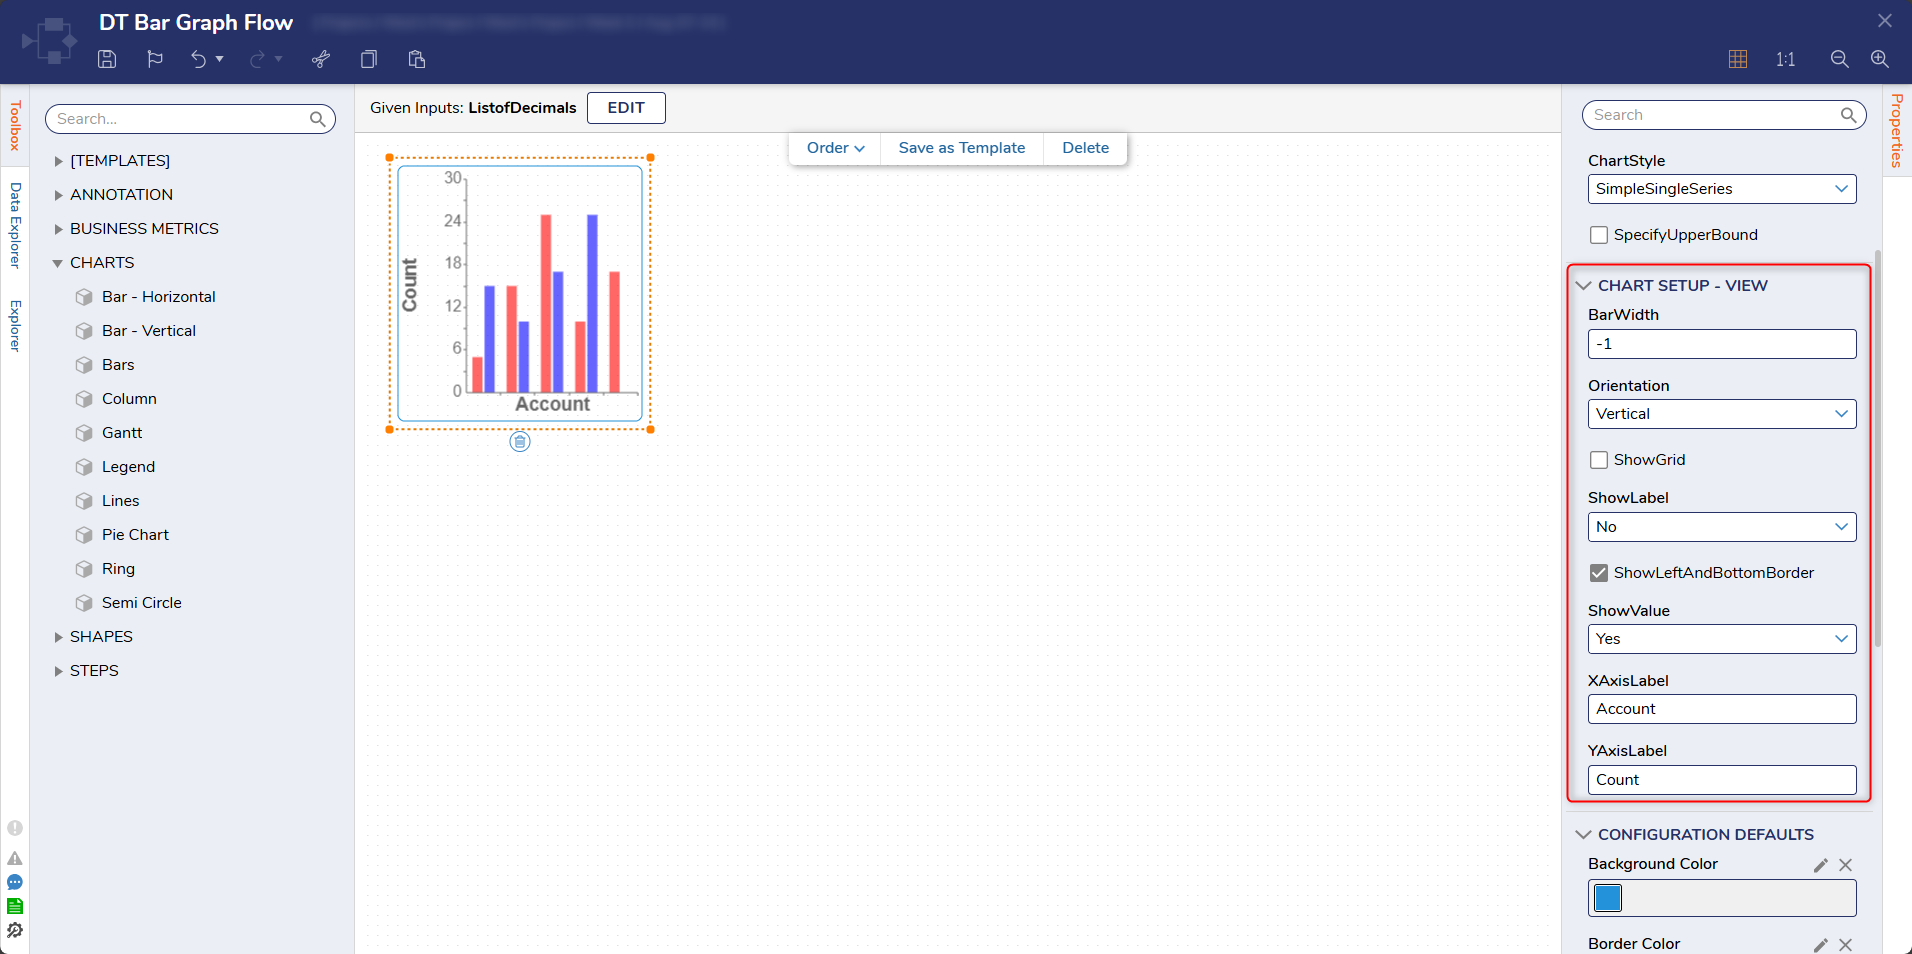
Action Source
This setting determines if Actions can be initiated when this control is selected
| Setting | Description |
|---|---|
| NoActions | Prevents actions from being run when the control is selected on a page. |
| Flow | Causes the specified Flow to run when it is selected. |
| Metric Definition | Collects metrics when the chart is selected in a Diagram Tile. |
Advanced
| Setting | Description |
|---|---|
| Height | Sets the height of the chart. |
| Width | Sets the width of the chart. |
| X | Sets the X location in the workspace that the control exists on. |
| Y | Sets the Y location in the workspace that the control exists on. |
Chart Setup
ChartStyle
| Setting | Description |
|---|---|
| SimpleSingleSeries | Bar graph style involving only single bars. Uses only a list of Decmials as an input. |
| SimpleDoubleSeries | Bar graph style that groups two selected columns side by side. Uses two lists of Decimals as an input. |
| MultipleSeries | Bar graph style that allows for more complex bar charts to be created. Uses a list of Line Definitions as an input. |
SpecifyUpperBound
Creates a new input to specify the upper bound for the chart
Chart Setup - View
| Setting | Description |
|---|---|
| Bar Width | Sets the width of each bar displayed in the chart. |
| Orientation | Aligns the Bars either horizontally or vertically depending on the selection. |
| ShowGrid | Provides a grid for the chart. |
| Show Label | Displays the label for each field in the chart. |
| Show Value | Displays the Y values for the table. |
| XAxisLabel | Sets the label for the X Axis. |
| YAxisLabel | Sets the label for the Y Axis. |
Configuration Defaults
| Setting | Description |
|---|---|
| Background Color | Sets the background color for the chart control. |
| Border Color | Sets the border color for the chart control. |
| Border Width | Defines the border width for the chart control. |
| Image | Sets an image which will appear on the chart control. |
| Z Order | Determines if the selected control will be placed in front of another control. |
| Font Attributes | Defines the font used for the labels. |
| Outcome Paths | Creates an outcome path on the Diagram Tile control. |
Creating Inputs for a Bars Chart
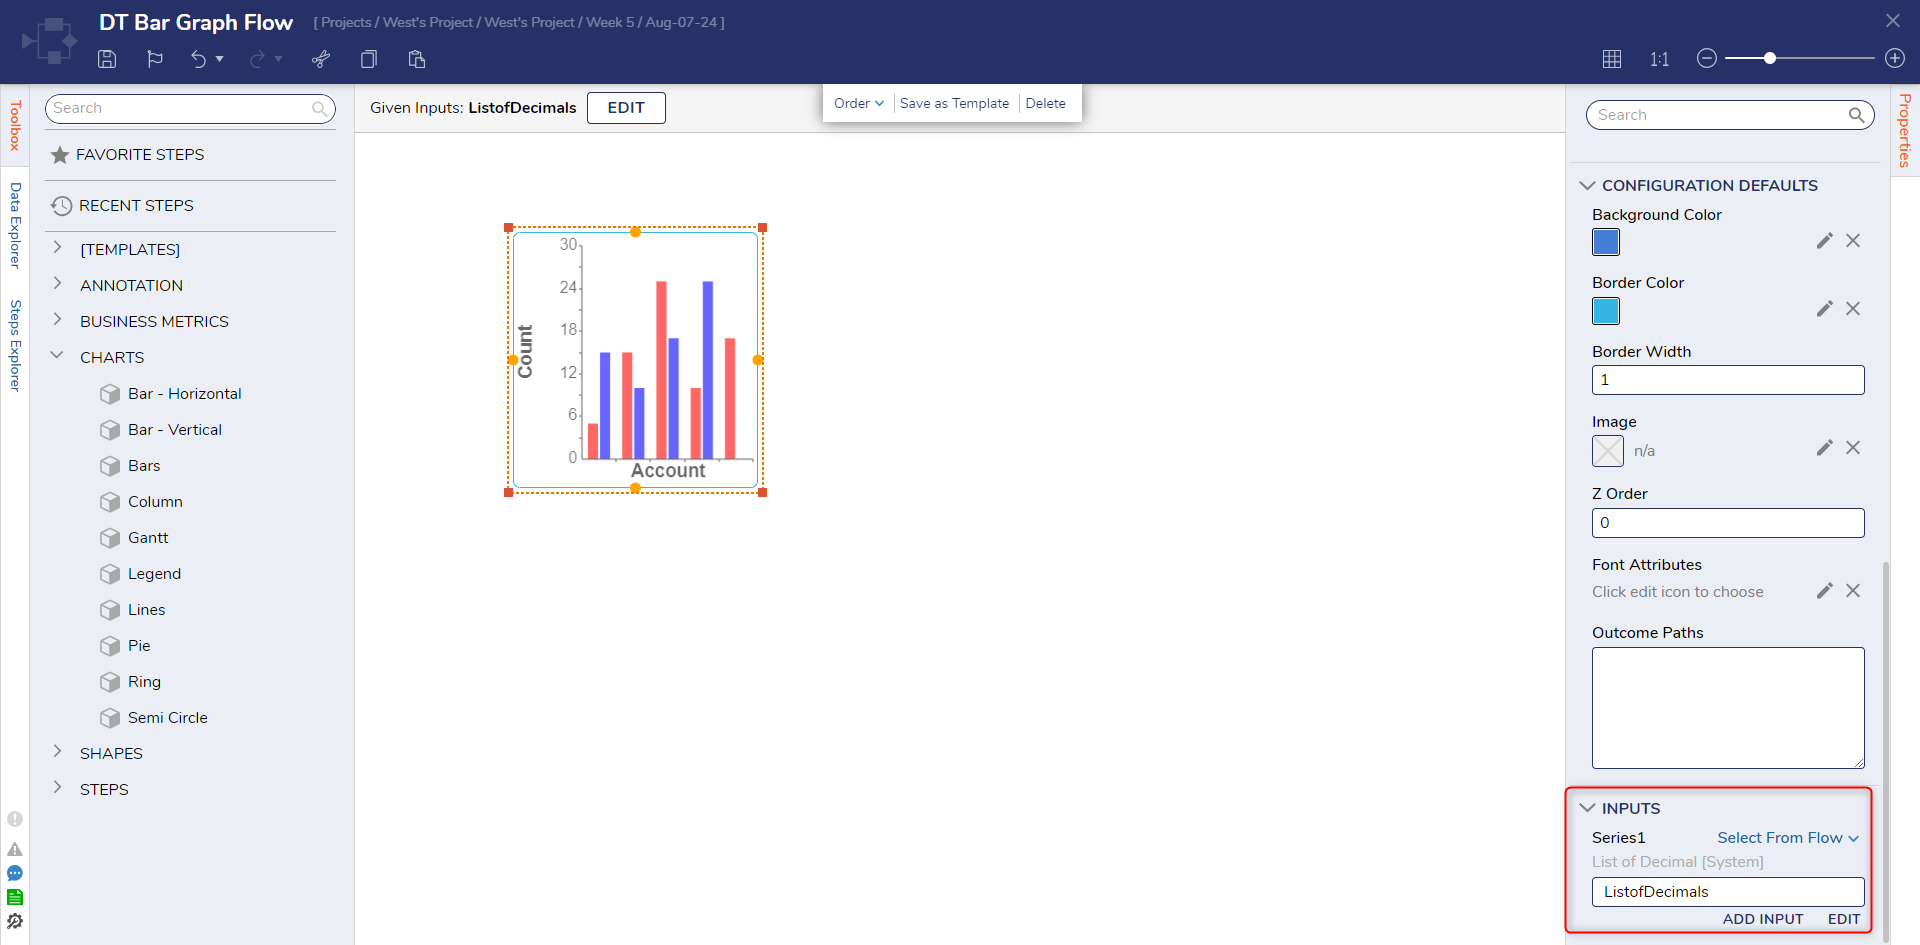
For this example, the Inputs section has only one required configuration needed. The only input is Series1, which is expecting a List of Decimals as input data. This example will output the total count accounts, and the count all active and inactive accounts for an environment.
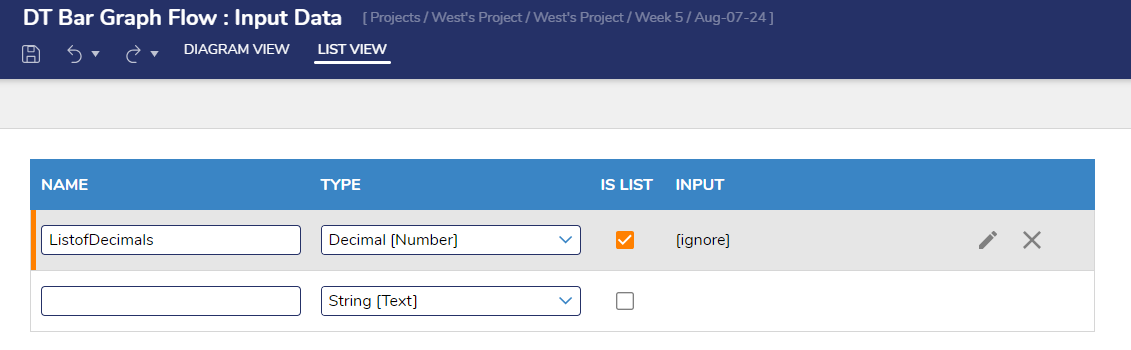
- In the Diagram Tile Designer, select SETUP INPUT DATA.
- Define a list of Decimals as an input, then Save.
- Select the Bars control. In the Properties panel, map the input to Series1 under the INPUTS section.
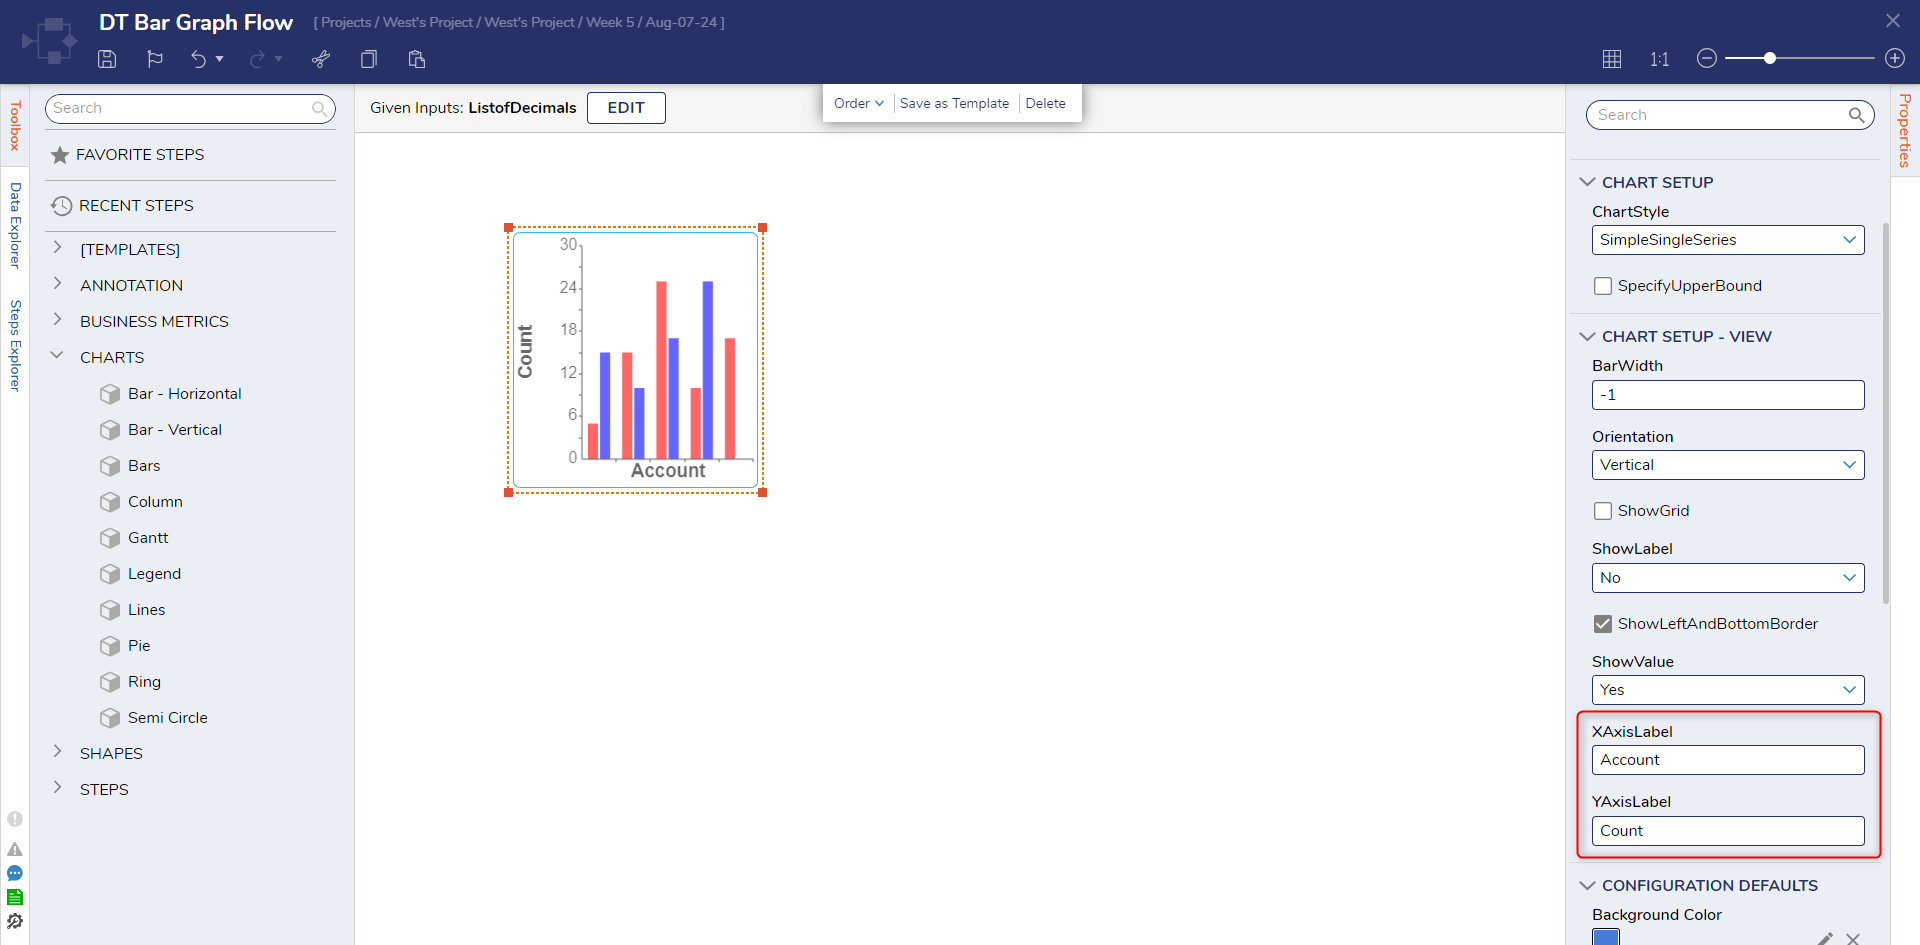
- Under Chart Setup - View, define an X and Y axis label for the chart. Save and close the Diagram Tile Designer.
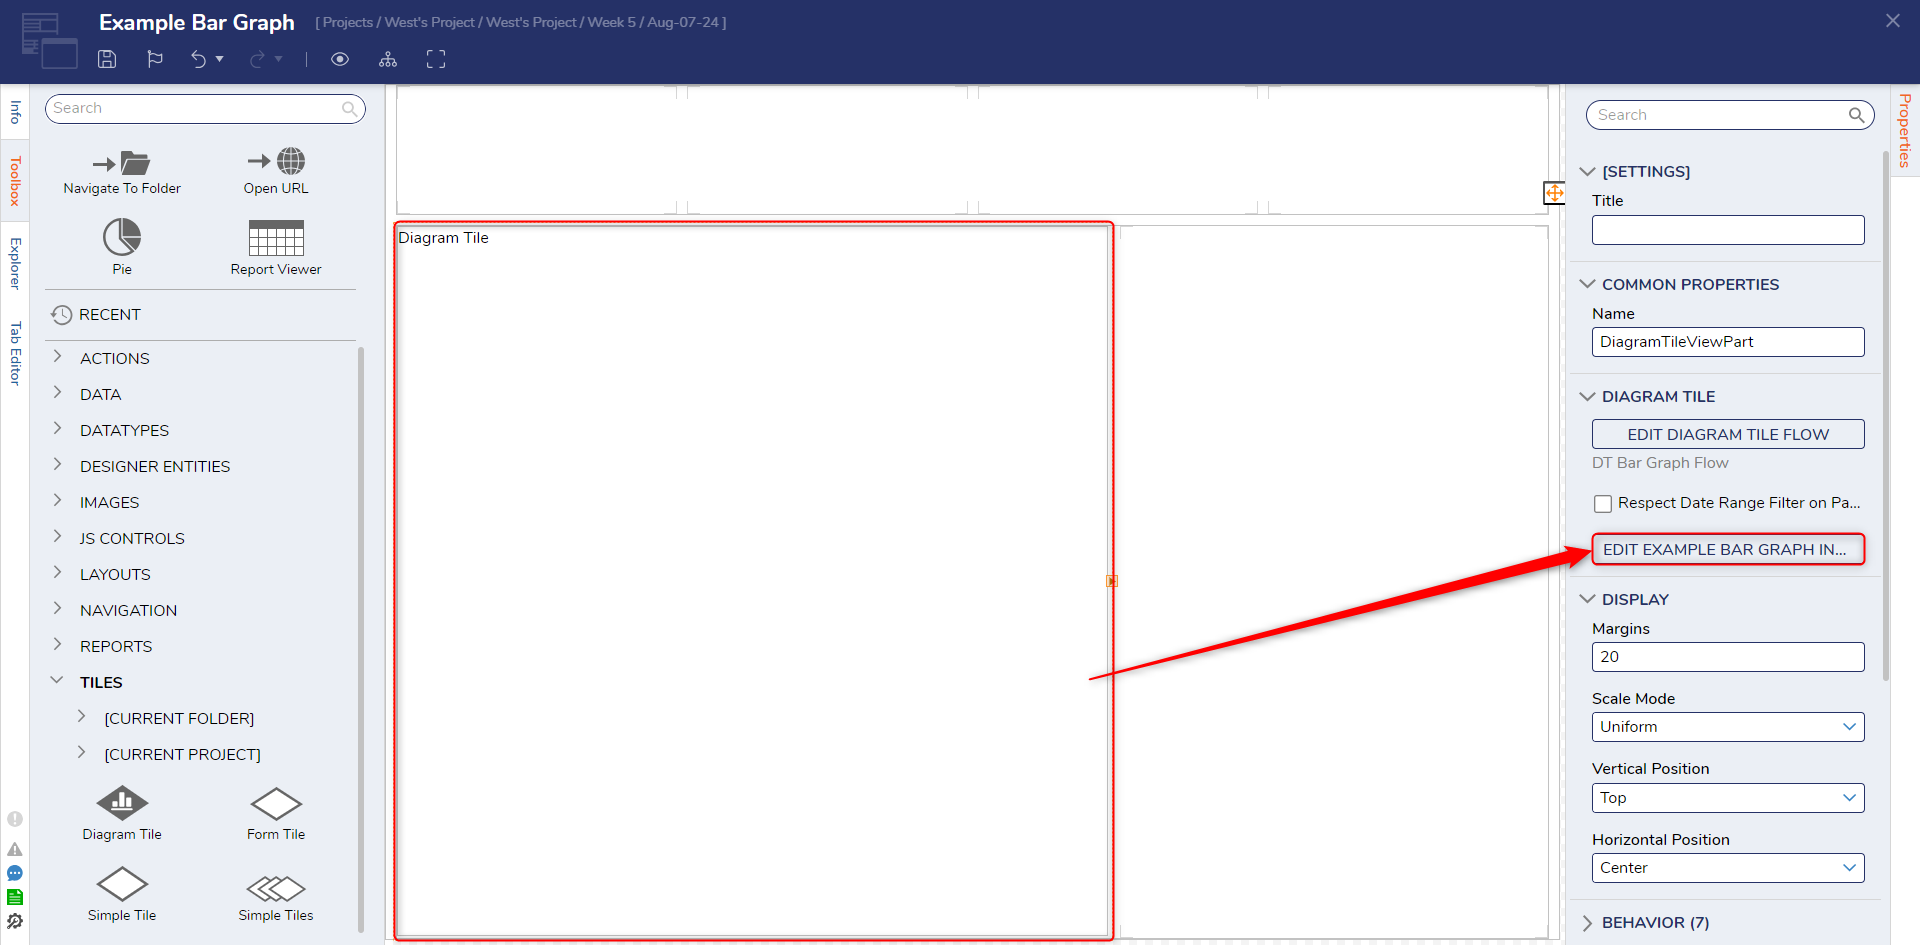
- Back in the Page Designer, select the Diagram Tile control so that the properties appear.
- In the DIAGRAM TILE section, select the EDIT DIAGRAM TILE PAGE INPUT FLOW button that has appeared.
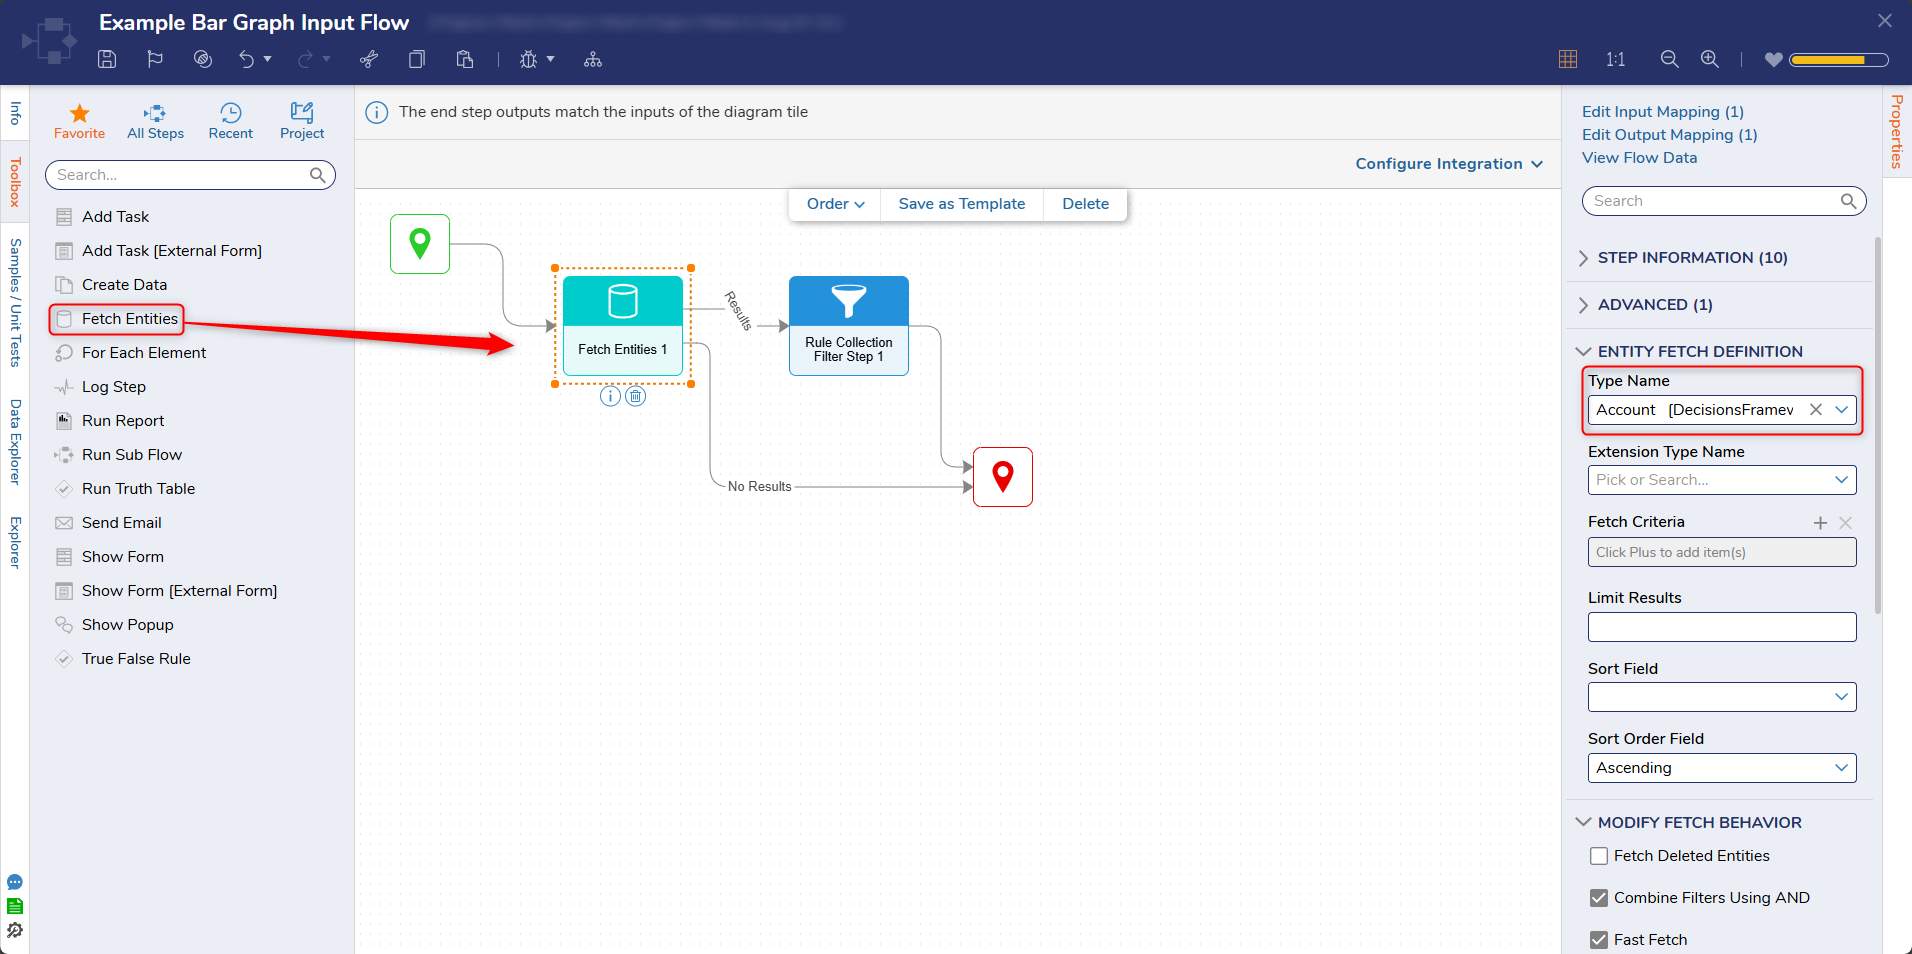
- In the Flow Designer, under Database select the Fetch Entities step and expand the ENTITY FETCH DEFINITION section.
- Use the Type Name dropdown and find the Account data type.
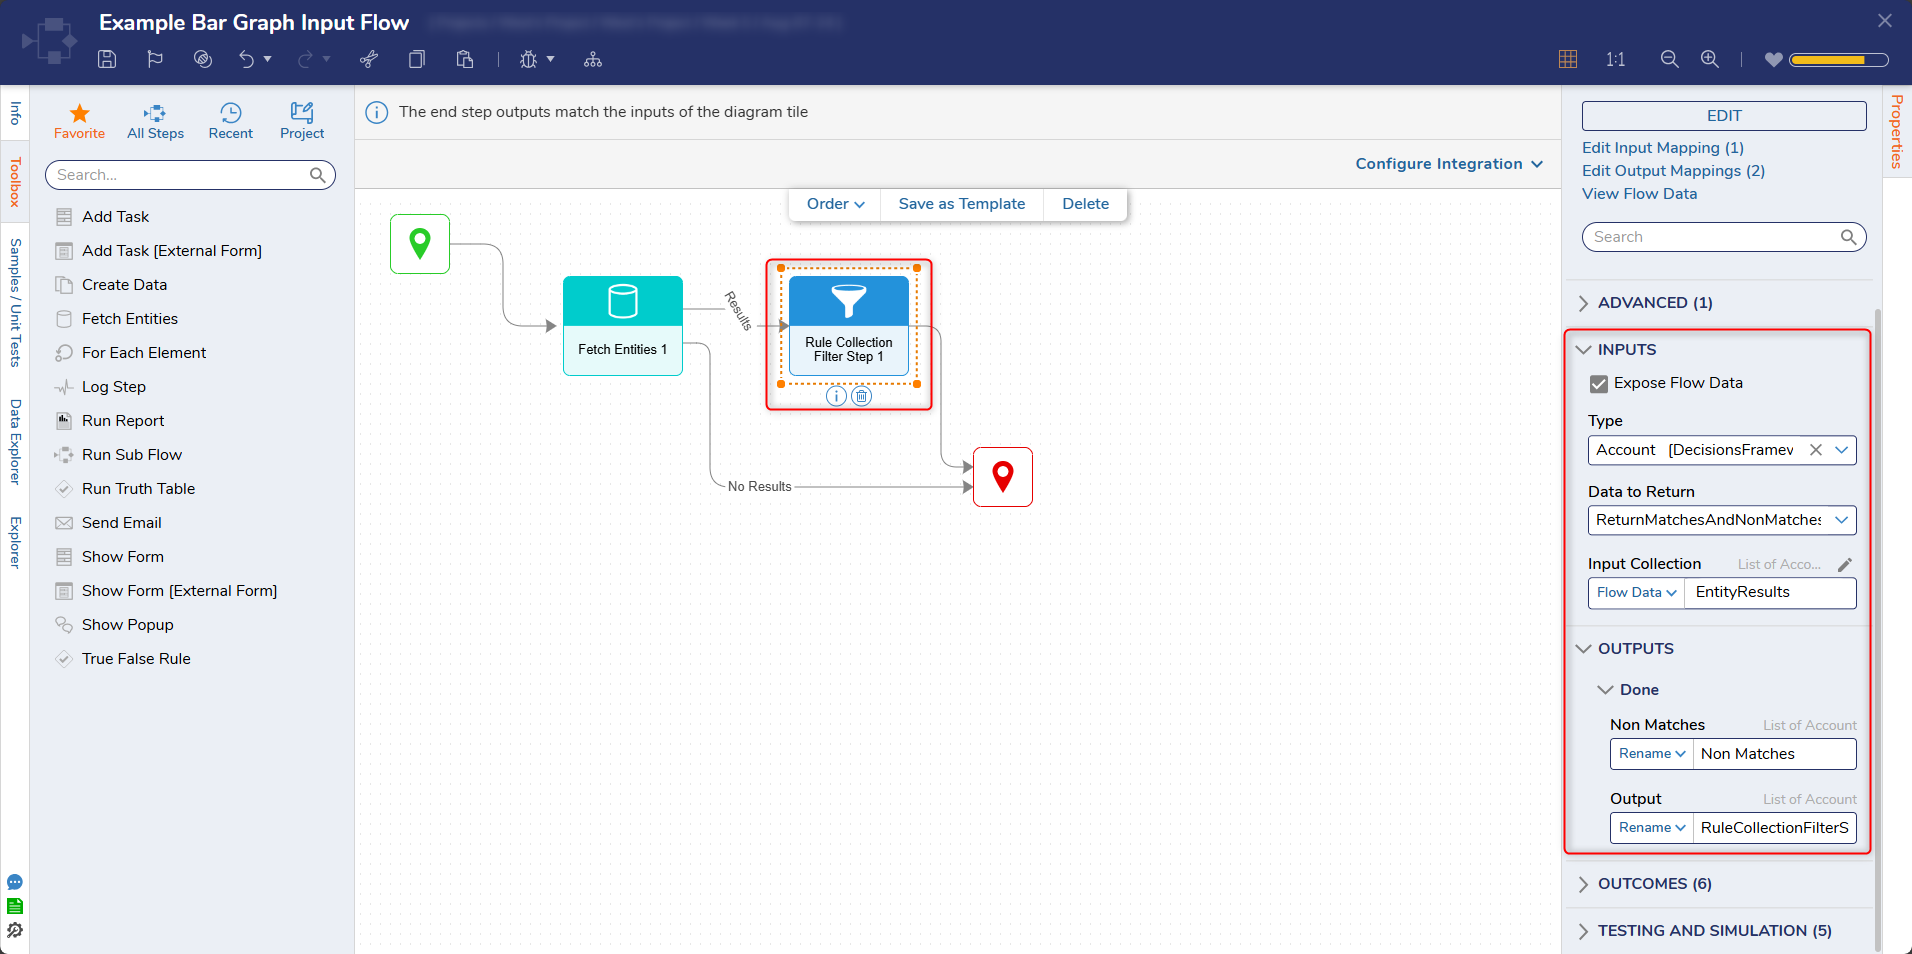
- Add a Rule Collection Filter step into the Flow. Configure this step to output the list of currently active accounts and inactive accounts
- On the End step, select Build Array for the ListofDecimals input.
- Click ADD to create new entries to the list.
Use the count of the results returned from the Fetch Entities and Rule Collection Filter steps as inputs to the list.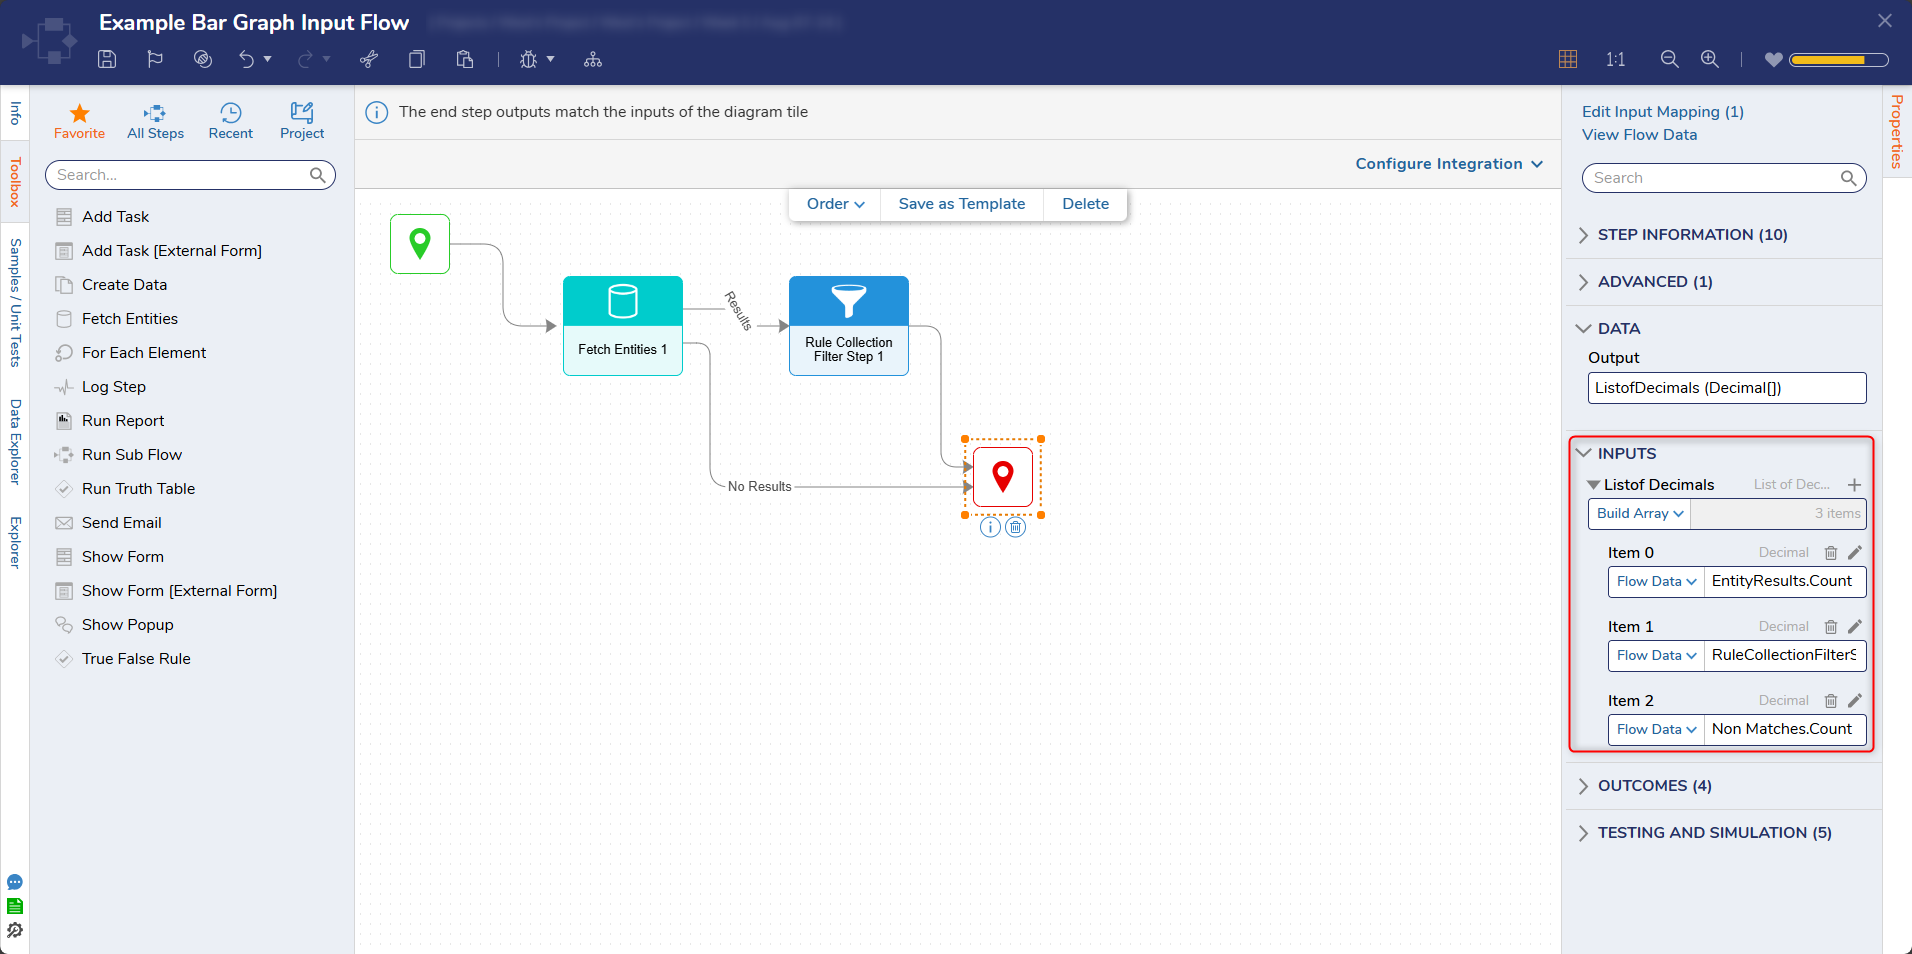
- Save and close the Flow.
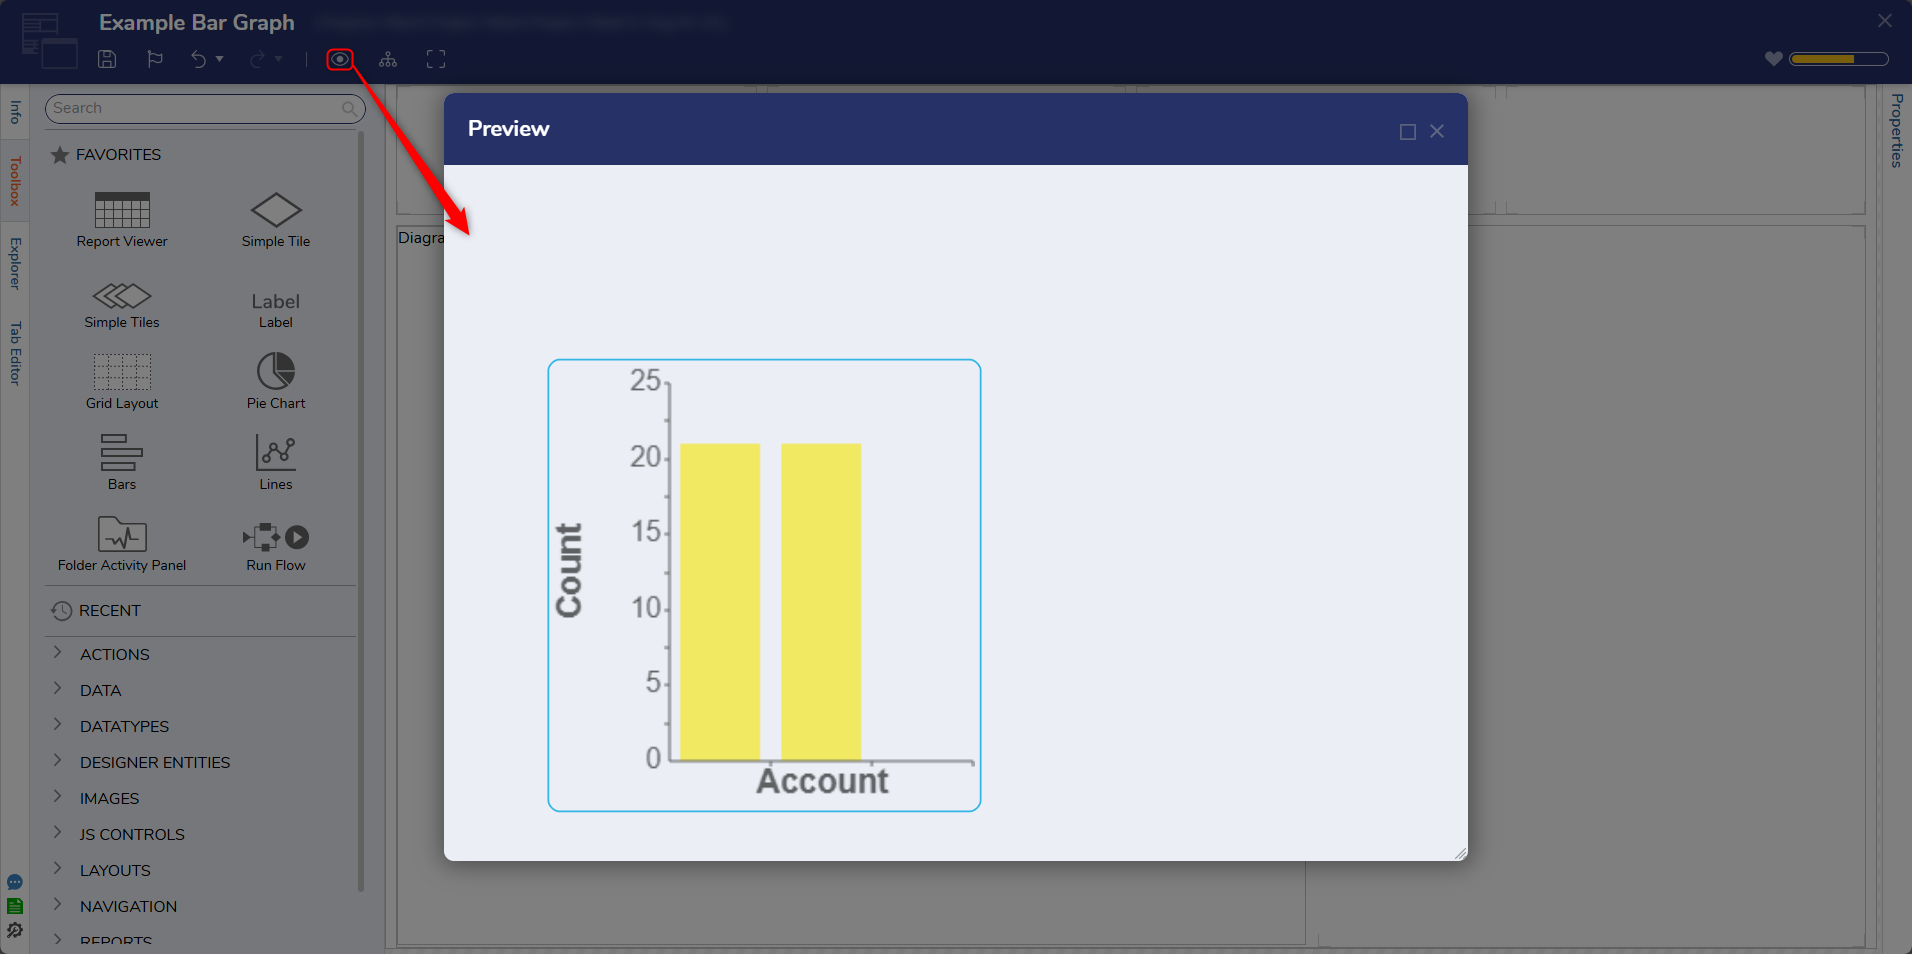
- In the Page Designer, select Preview. The bar graph should display the total number of accounts, and the number of active and inactive accounts.