Overview
In some instances, data must be added to a Flow to accurately populate a Chart using data from a Report.
In the Page Designer, the options available to show Chart Data include Use Report Subtotals, Use Matrix, and Use Flow. The Use Report Subtotals is a typical use case that allows the user to pick or create a Report to display the data. The Use Flow option allows the user to fetch and filter data that will be shown as a Chart using a Flow. The Flow behavior cannot be changed if it was created from the Page Designer's Properties panel. This type of Flow Behavior will output a list of ChartRenderData.
Each individual ChartRenderData makes up one (1) series of data for the Chart; this allows the user to customize different series differently. Each series contains different pieces of the Chart, for instance, the slices on a Pie Chart are individually structured as the ChartDatum type. A series of ChartRenderData contains a list of ChartDatum.
In this ChartDatum type, there are several fields: Title, Label, and Display Label that can all be mapped in and treated as the same value. The boolean Navigable determines whether or not something can be drilled into when selected. The Value decimal is the actual amount allotted to that piece of the chart.
In the following example, the Use Flow Mode will be demonstrated with a Pie Chart displaying the different types of user accounts.
Example
- In a Designer Folder, click CREATE FORM from the Global Action Bar.
- In the Create Form window, select and name the default Page.
- In the Page Designer, navigate to the Toolbox > FAVORITES section and drag a Pie component to the workspace.
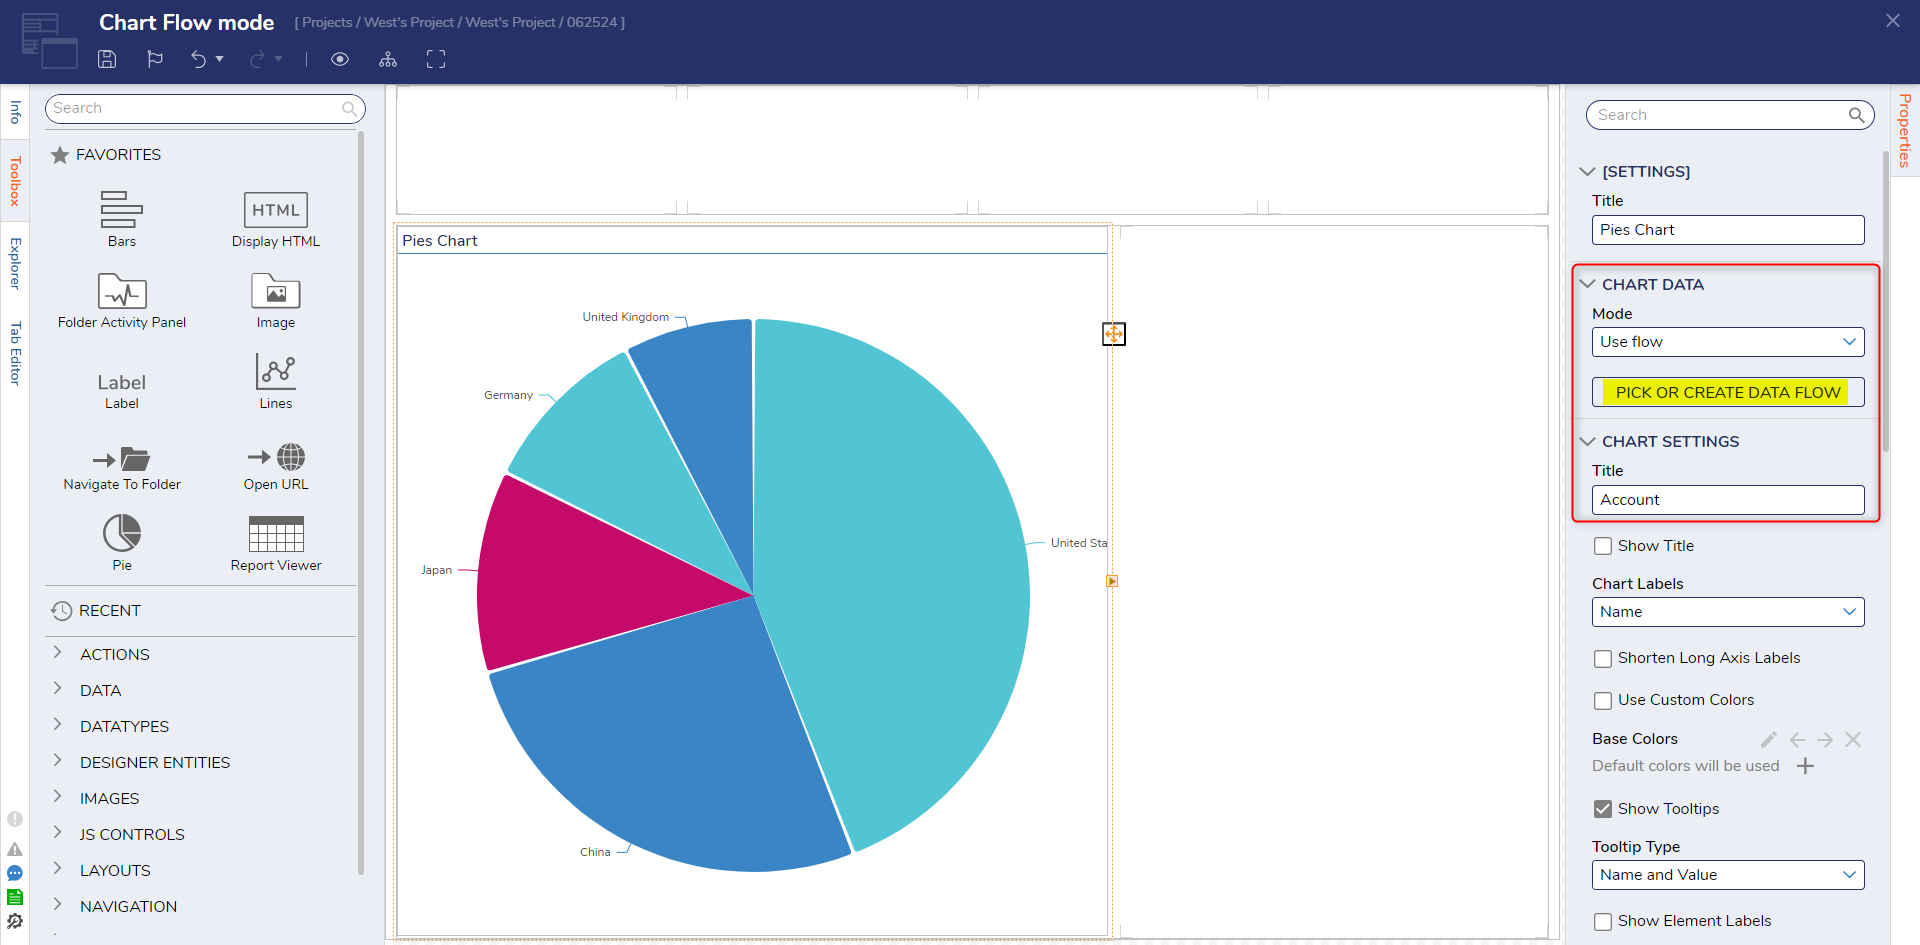
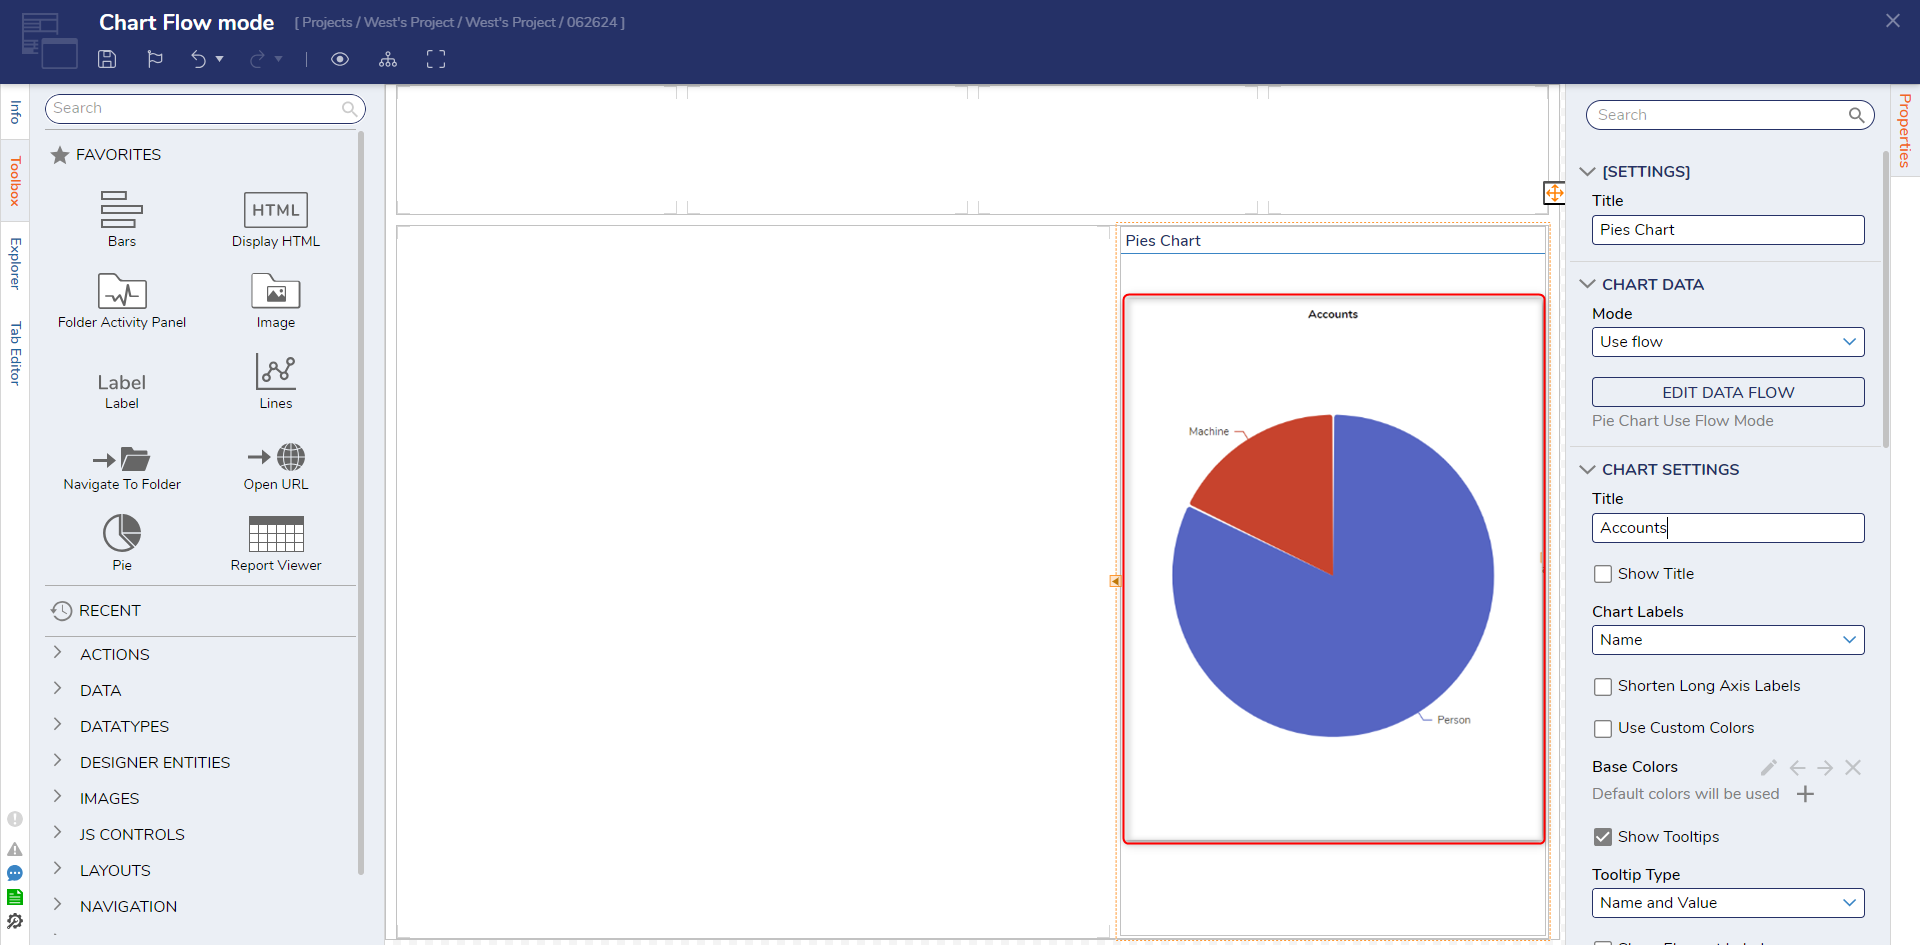
- In the Properties panel, navigate to CHART DATA > Mode and change the mode to Use Flow.
- Name the Chart under CHART SETTINGS > Title. Next, click PICK OR CREATE DATA FLOW. Then, click CREATE.
- Select and name the Chart Data Flow. Click CREATE again.
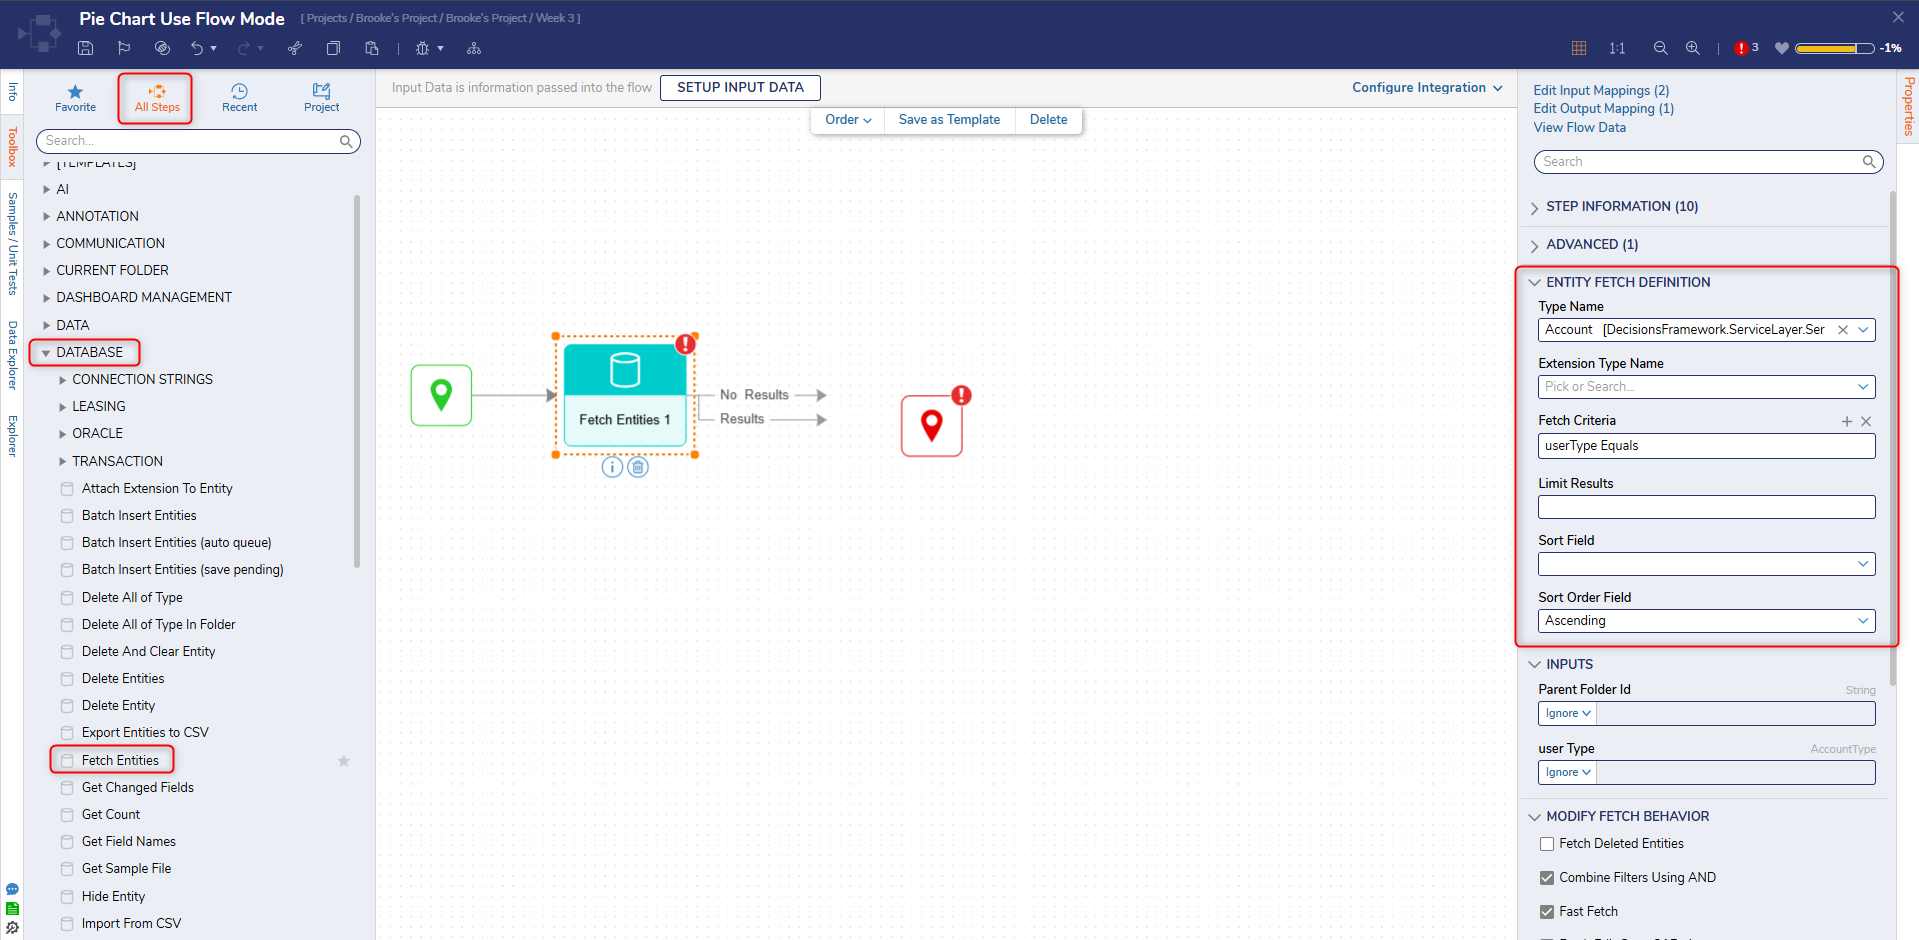
- In the Flow Designer, from the Toolbox > DATABASE section, connect a Fetch Entities step to the Start step.
- In the Properties panel > ENTITY FETCH DEFINITION > Type Name drop-down menu, search for Account using All/Search.
- Locate ENTITY FETCH DEFINITION > Fetch Criteria and click ADD.
- In the resulting window, find userType in the Field Name drop-down menu. Click OK.
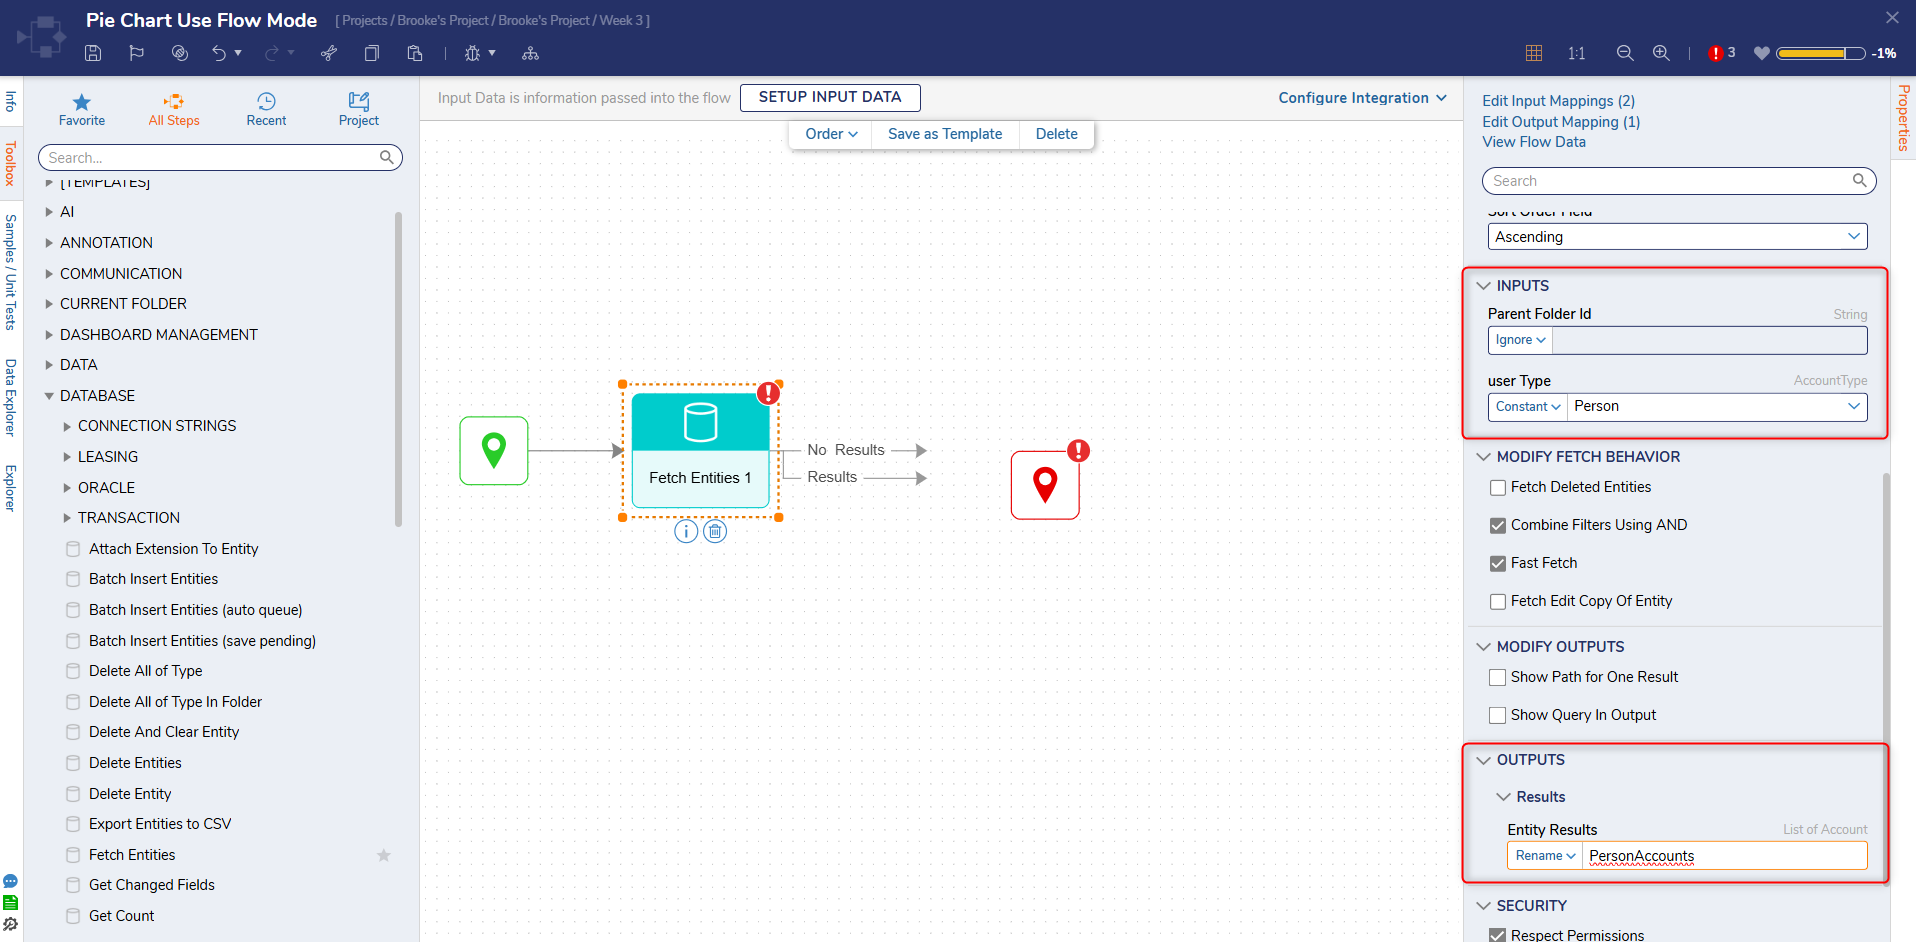
- Next, under INPUTS > user Type, change the input mapping to Constant. Select Person.For clarity and example purposes, the OUTPUTS > Results > Entity Results was renamed PersonAccounts.
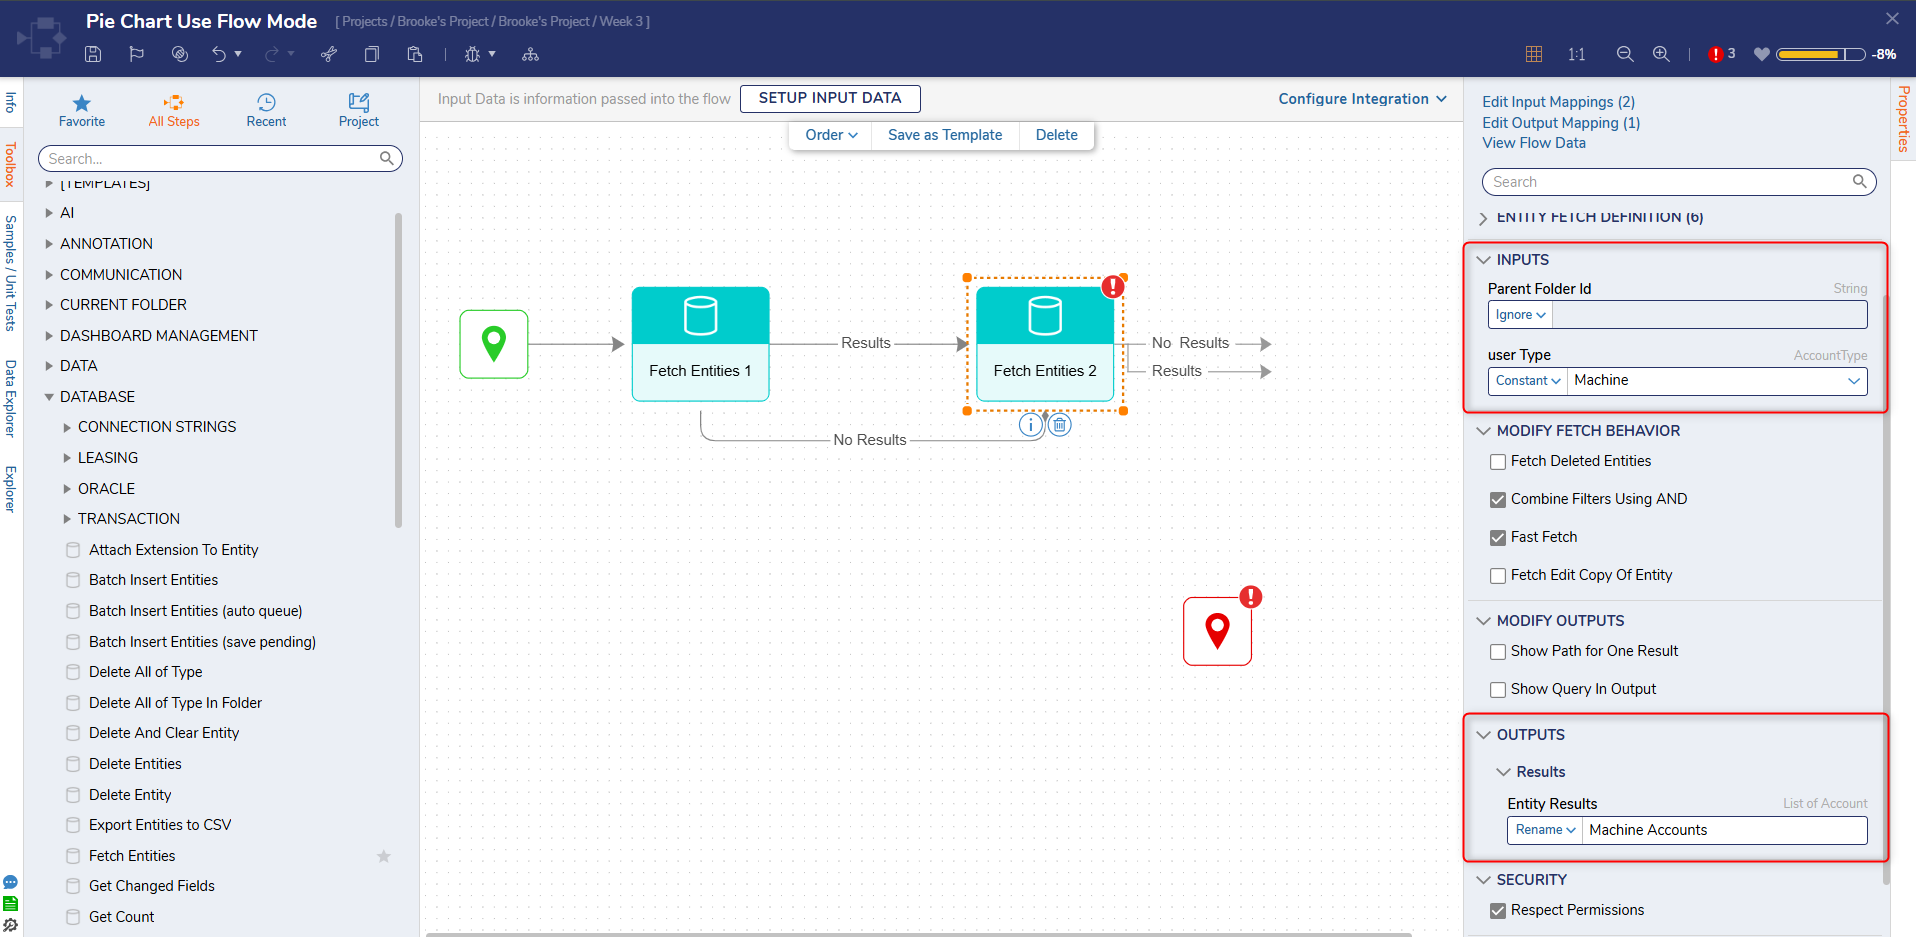
- Add another Fetch Entities step and connect it to the Results outcome of the first step.
- Connect the No Results outcome to the new Fetch Entities step.
- Repeat steps 11, 12, and 13 for the second Fetch Entities step.
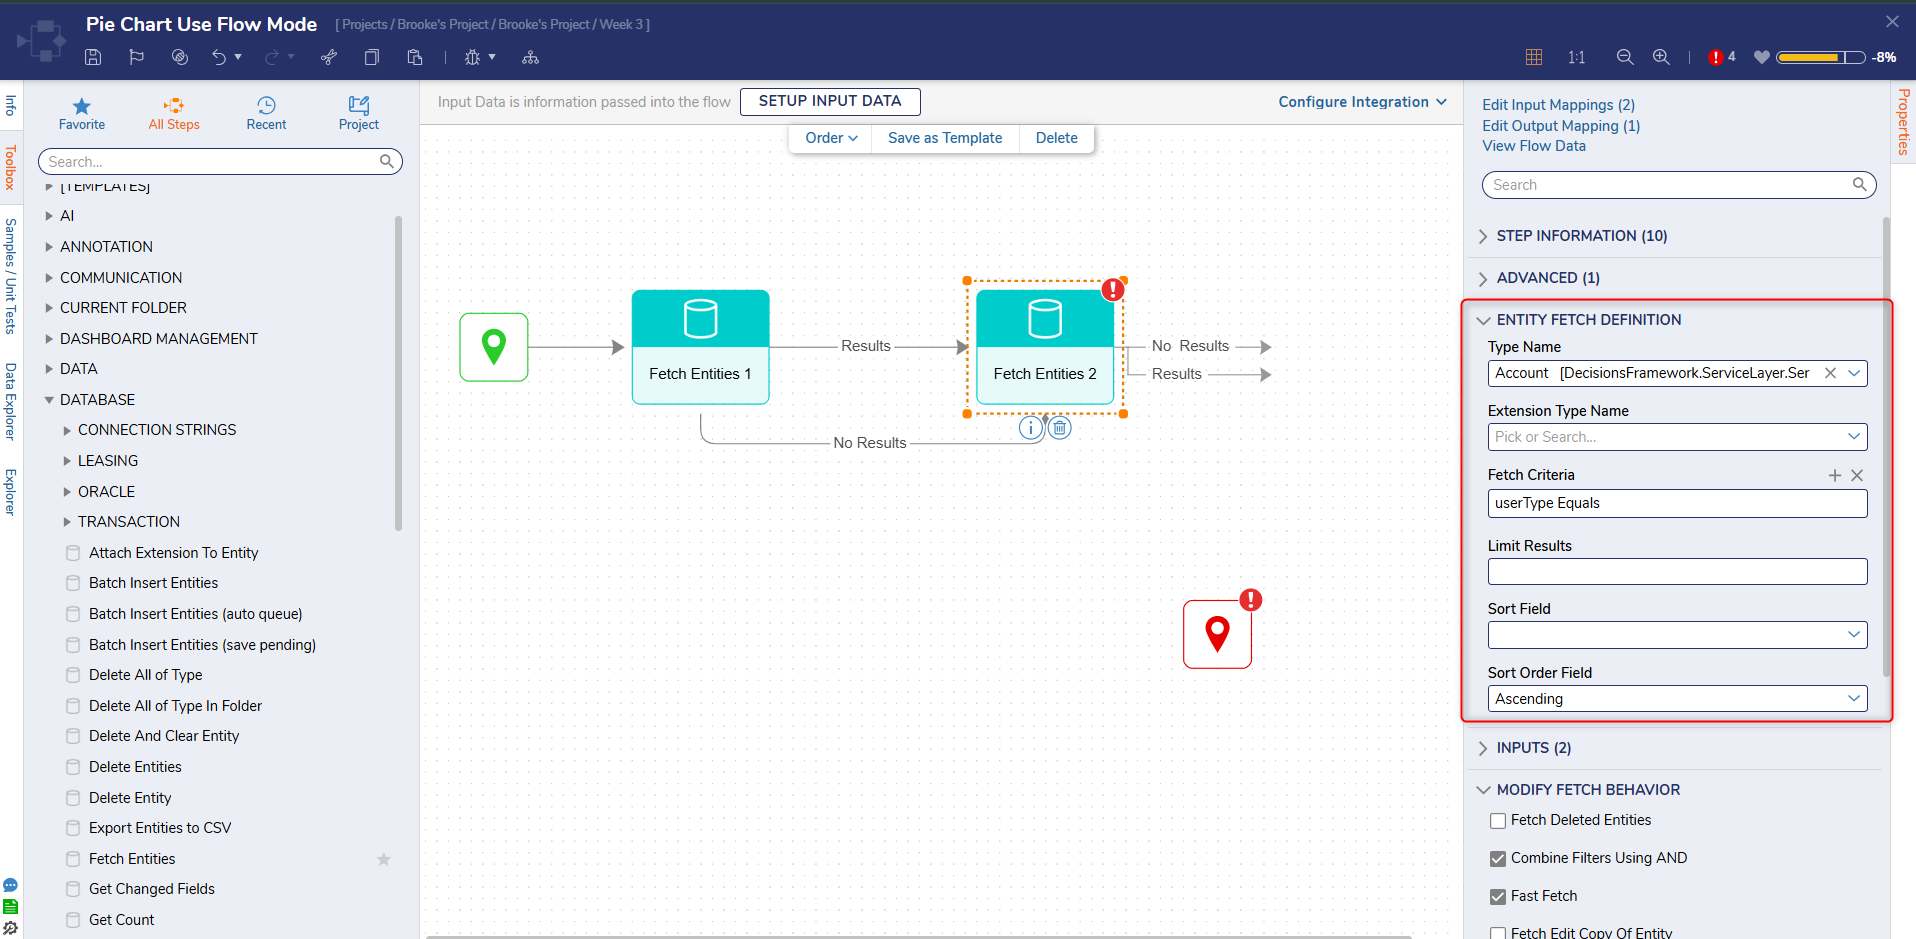
- Then, under INPUTS > user Type, change the input mapping to Constant. Select Machine.
- From the Toolbox > DESIGNER ENTITIES > FLOWS category, connect a [Pick or Create Flow] step to the Results outcome of the second Fetch Entities step.
- Connect the No Results outcome to the [Pick or Create Flow] step.
- In the Properties panel of the [Pick or Create Flow] step, click PICK OR CREATE FLOW. Click CREATE. Select and name the Default Flow.
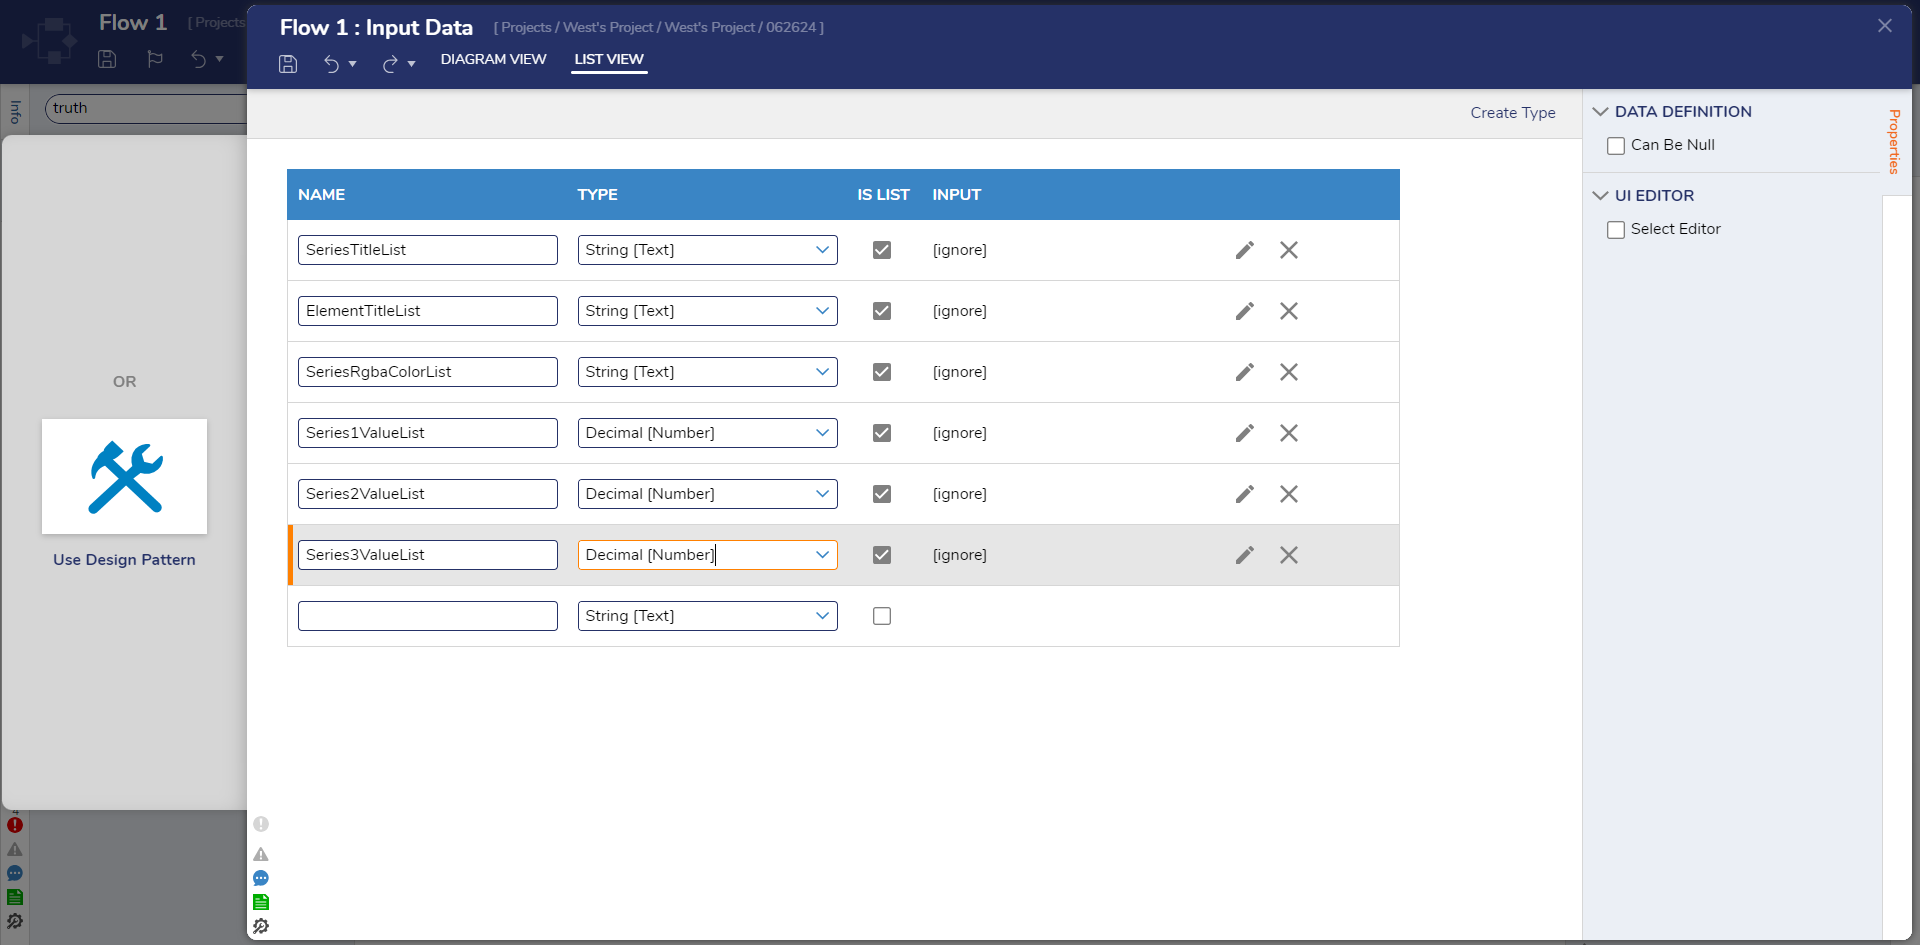
- In the Flow Designer, click SETUP INPUT DATA.
- In the resulting window, add the following data NAMES and TYPES: SeriesTitleList (String), ElementTitleList (String), SeriesRgbaColorList (String), Series1ValueList (Decimal), Series2ValueList (Decimal), Series3ValueList (Decimal). All data members will have IS LIST enabled.
- Click Save.
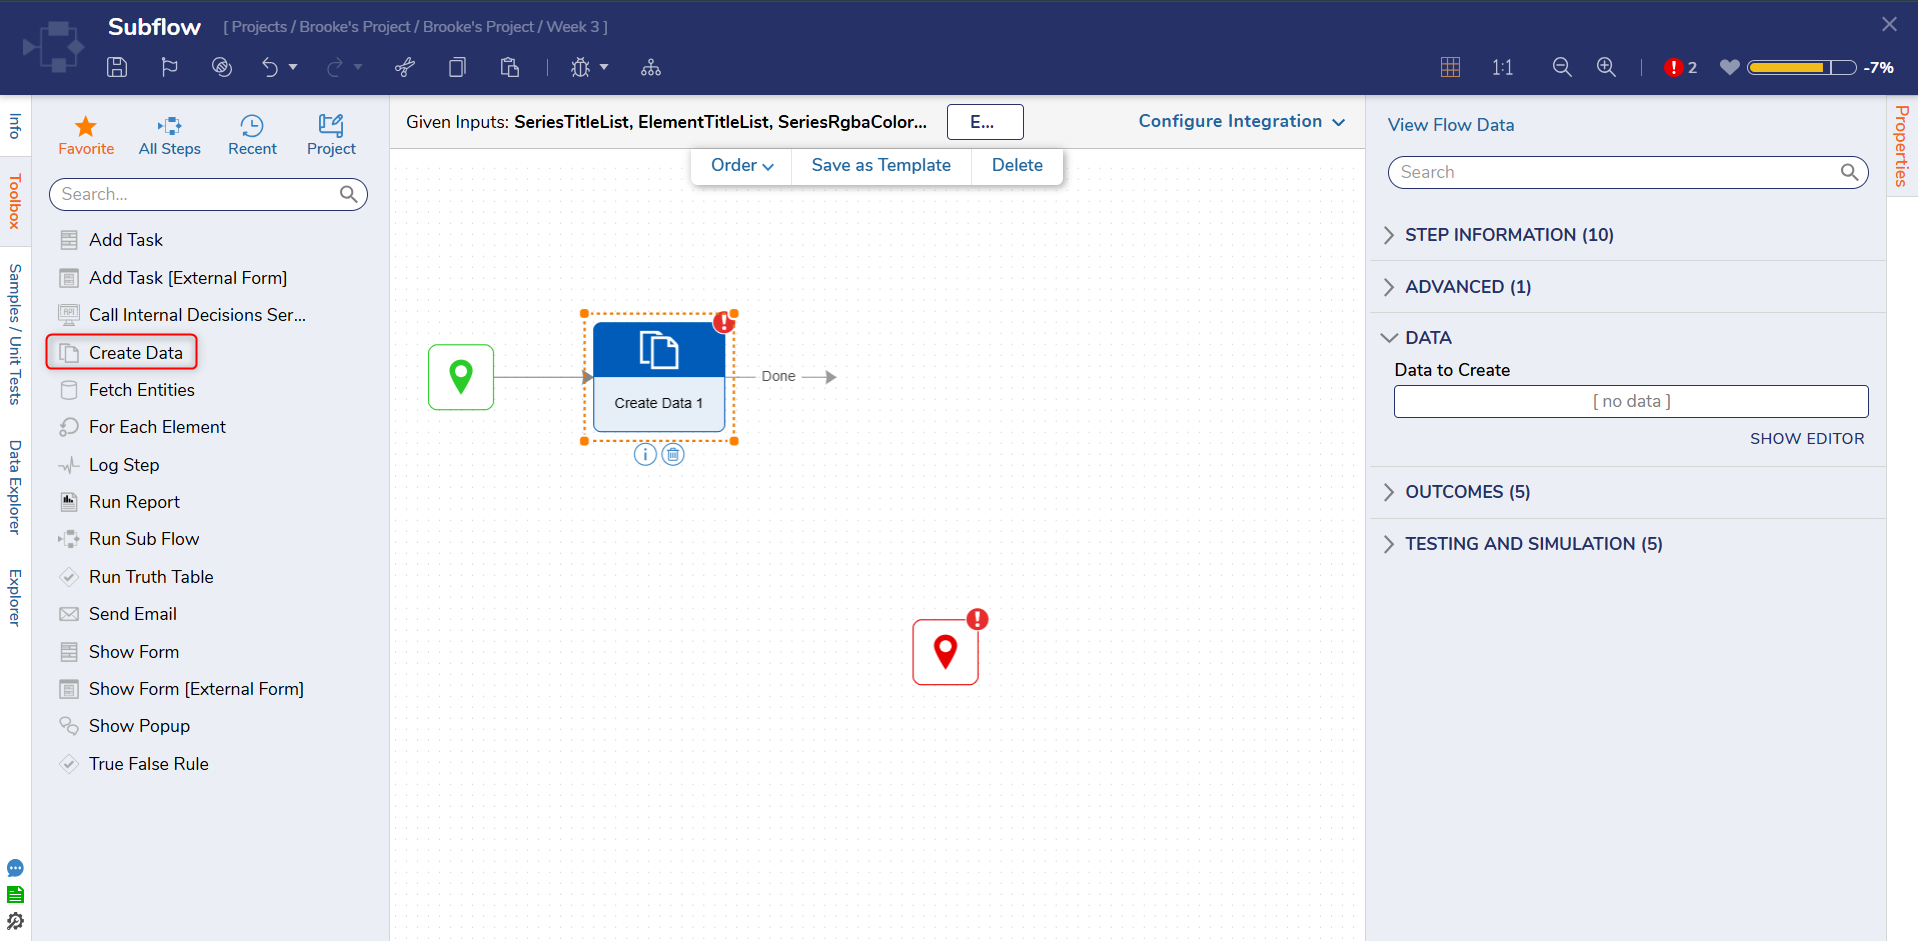
- From the Toolbox > FAVORITE STEPS section, add a Create Data step to the workspace.
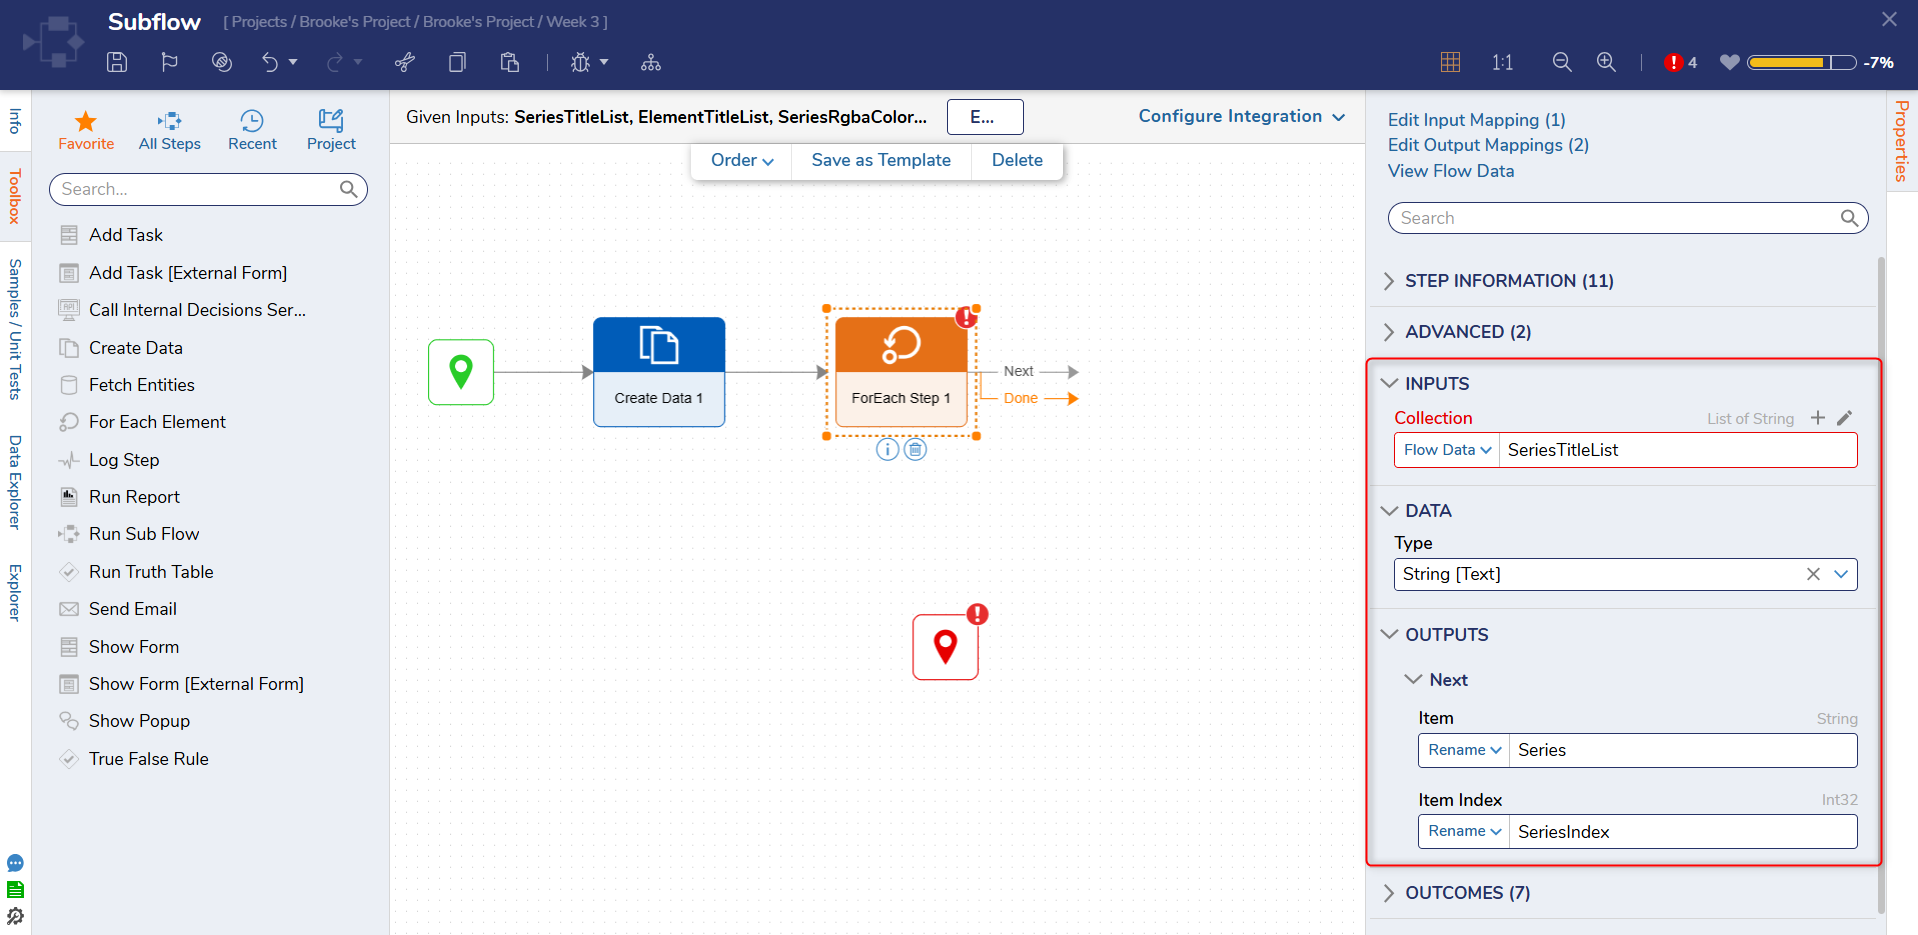
- Connect a ForEach step to the outcome of the Create Data step from the Toolbox > FLOW MANAGEMENT > ITERATION category.
- Under Properties panel > INPUTS > Collection, using the Select From Flow input mapping, select the SeriesTitleList input.
- Automatically, this will set the DATA > Type to String. The OUTPUTS have been renamed for clarity.
- Connect the Done outcome to the End step.
- Next, from the Toolbox > DESIGNER ENTITIES > RULES section, add a [Pick or Create Truth Table] step to the Next outcome of the ForEach step.
- In the Properties panel of the [Pick or Create Truth Table] step, click PICK OR CREATE TRUTHTABLE. Click CREATE.
- Select and name the Truth Table. Click CREATE.
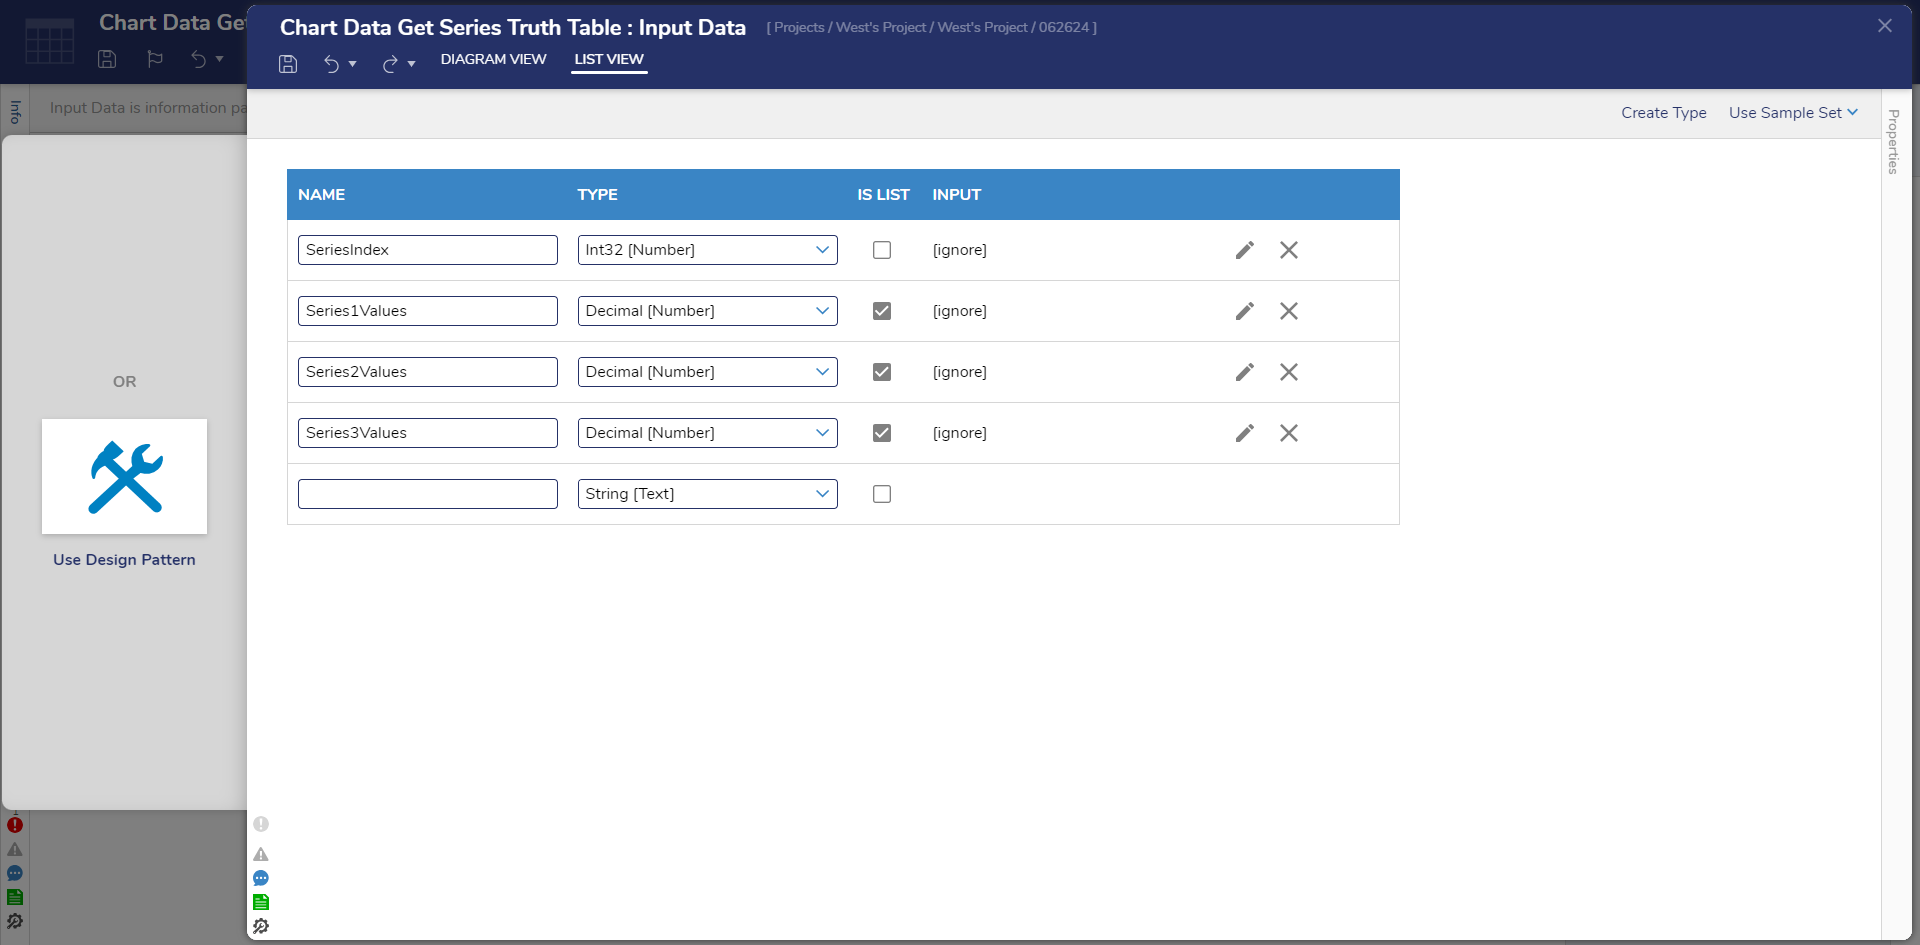
- In the Rule Designer, click SETUP INPUT DATA.
- In the resulting window, add the following data NAMES and TYPES: SeriesIndex (Int32), Series1Values (Decimal), Series2Values (Decimal), Series3Values (Decimal). Series 1, 2, and 3 Values have IS LIST enabled.
- Click Save and exit.
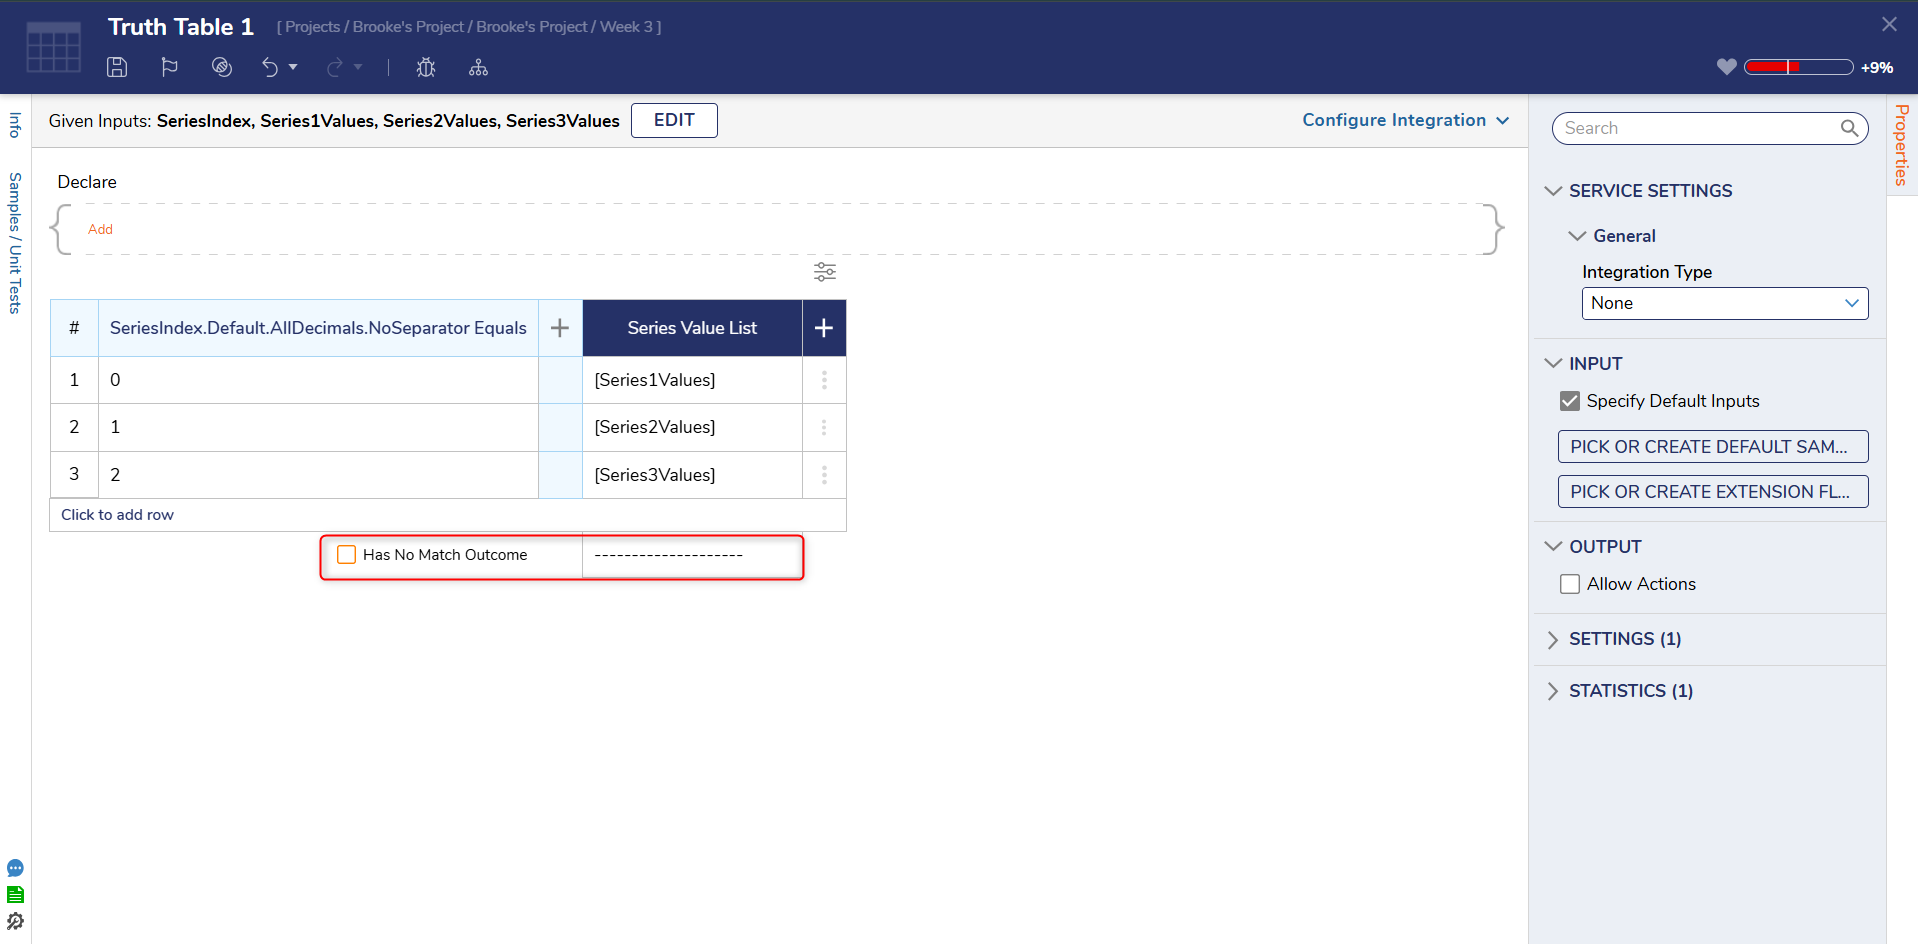
- Click [Select Data Element] and choose SeriesIndex or the value from the ForEach step's OUTPUTS > Item Index.
- Then, under Number Rules select Equals for the Verb.
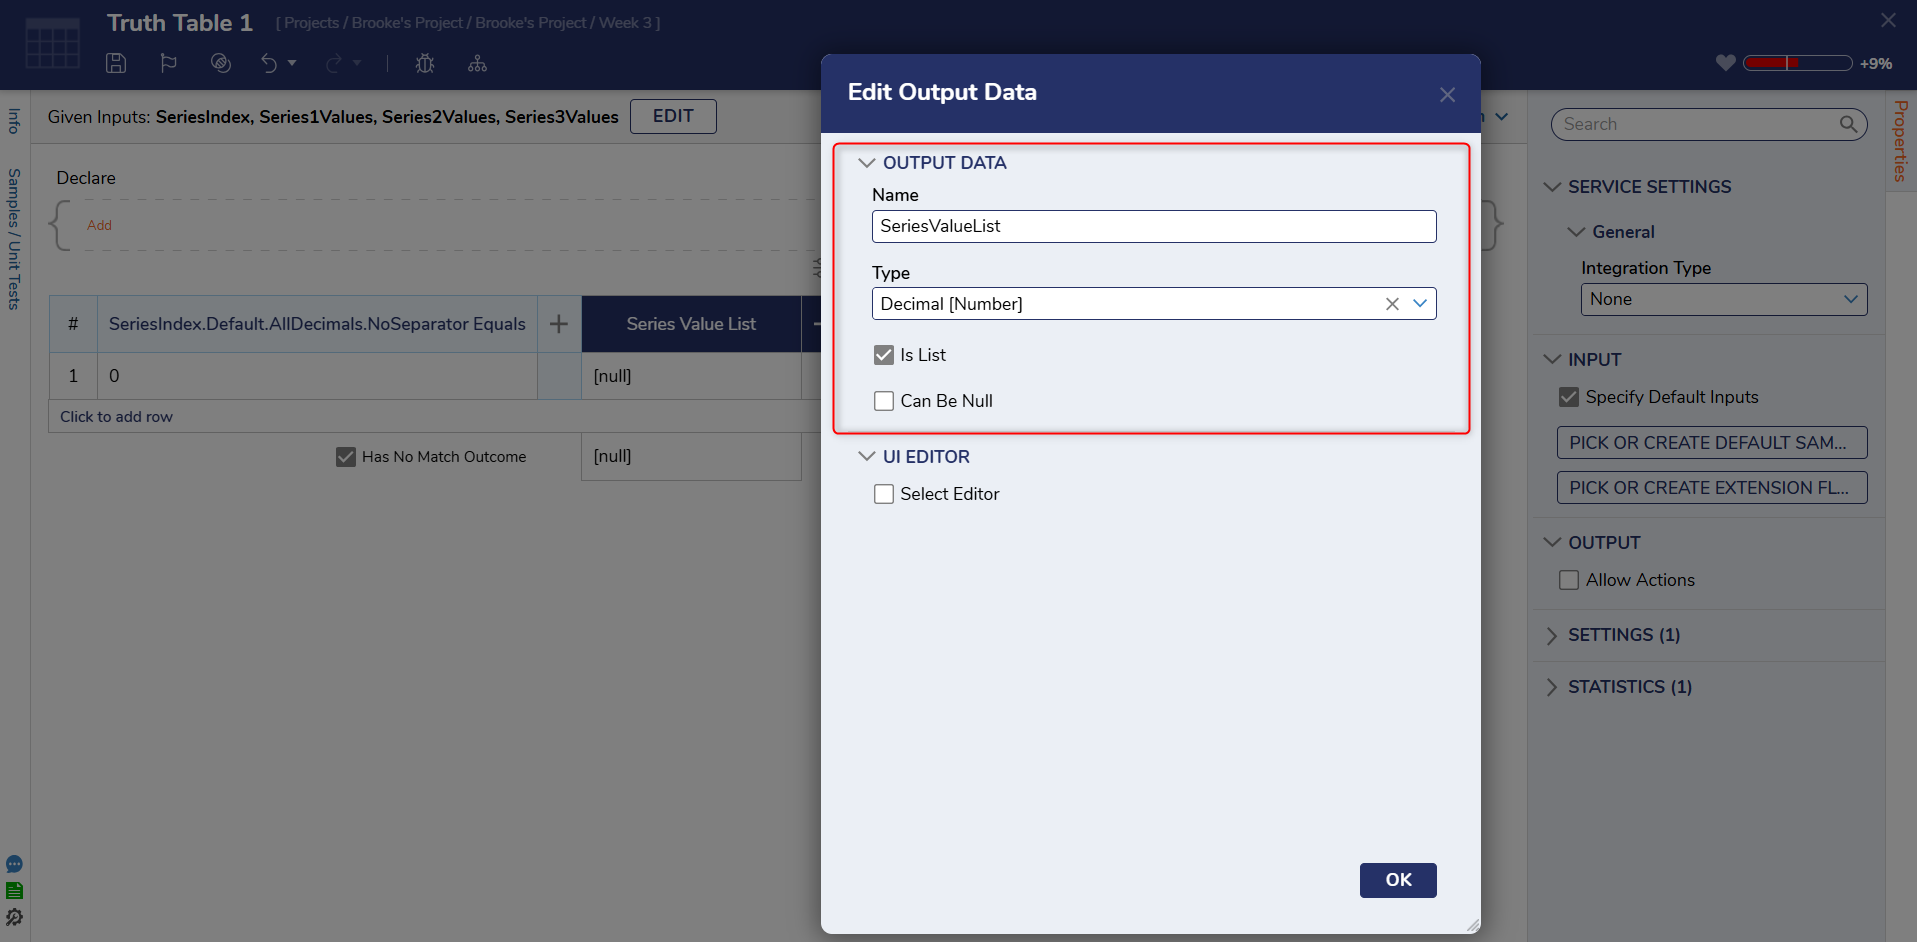
- Edit the Default Output Data column header by hovering and clicking the pencil icon.
- In the resulting window, add SeriesValueList as the INPUT DATA > Name.
- Change the Type to Decimal. Enable Is List.
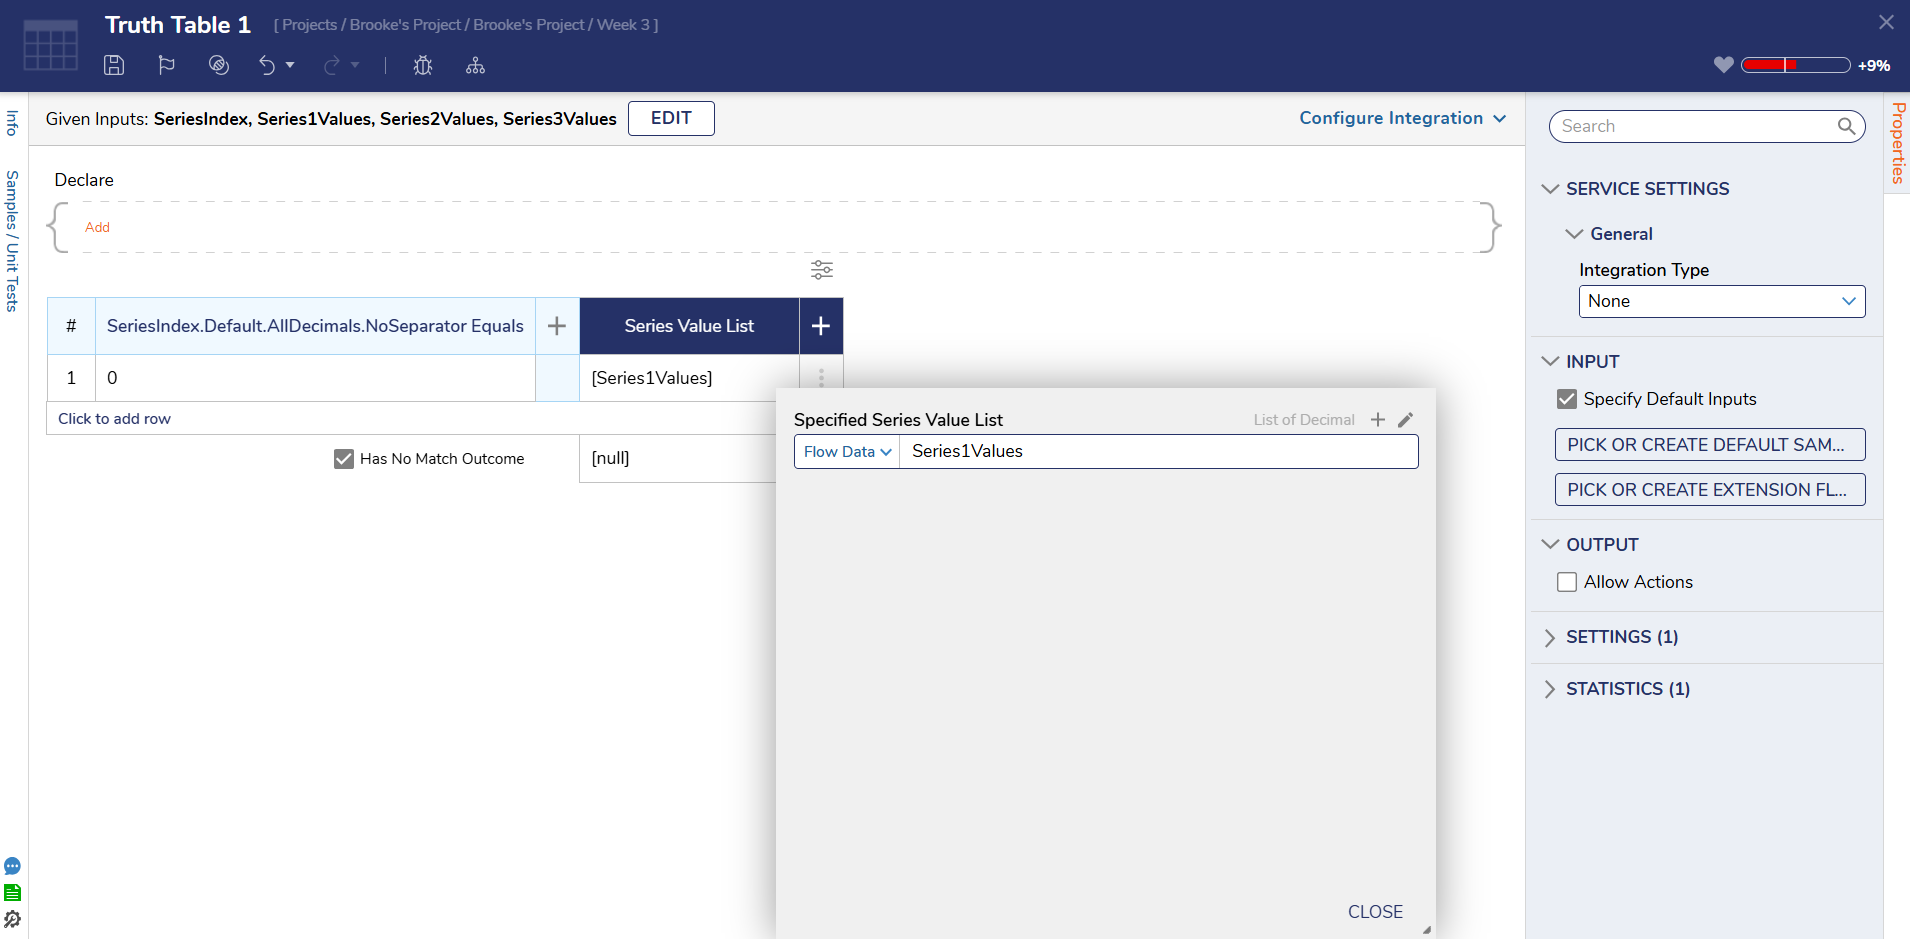
- Under the Series Value List, click the pencil beside [null].
- In the resulting window, change the input mapping to Select From Flow and select Series1Values.
- Add a new row. Under SeriesIndex Equals, add 1 for INPUTS > value2.
- Then, in the same row, add Series2Values under Series Value List as shown earlier.
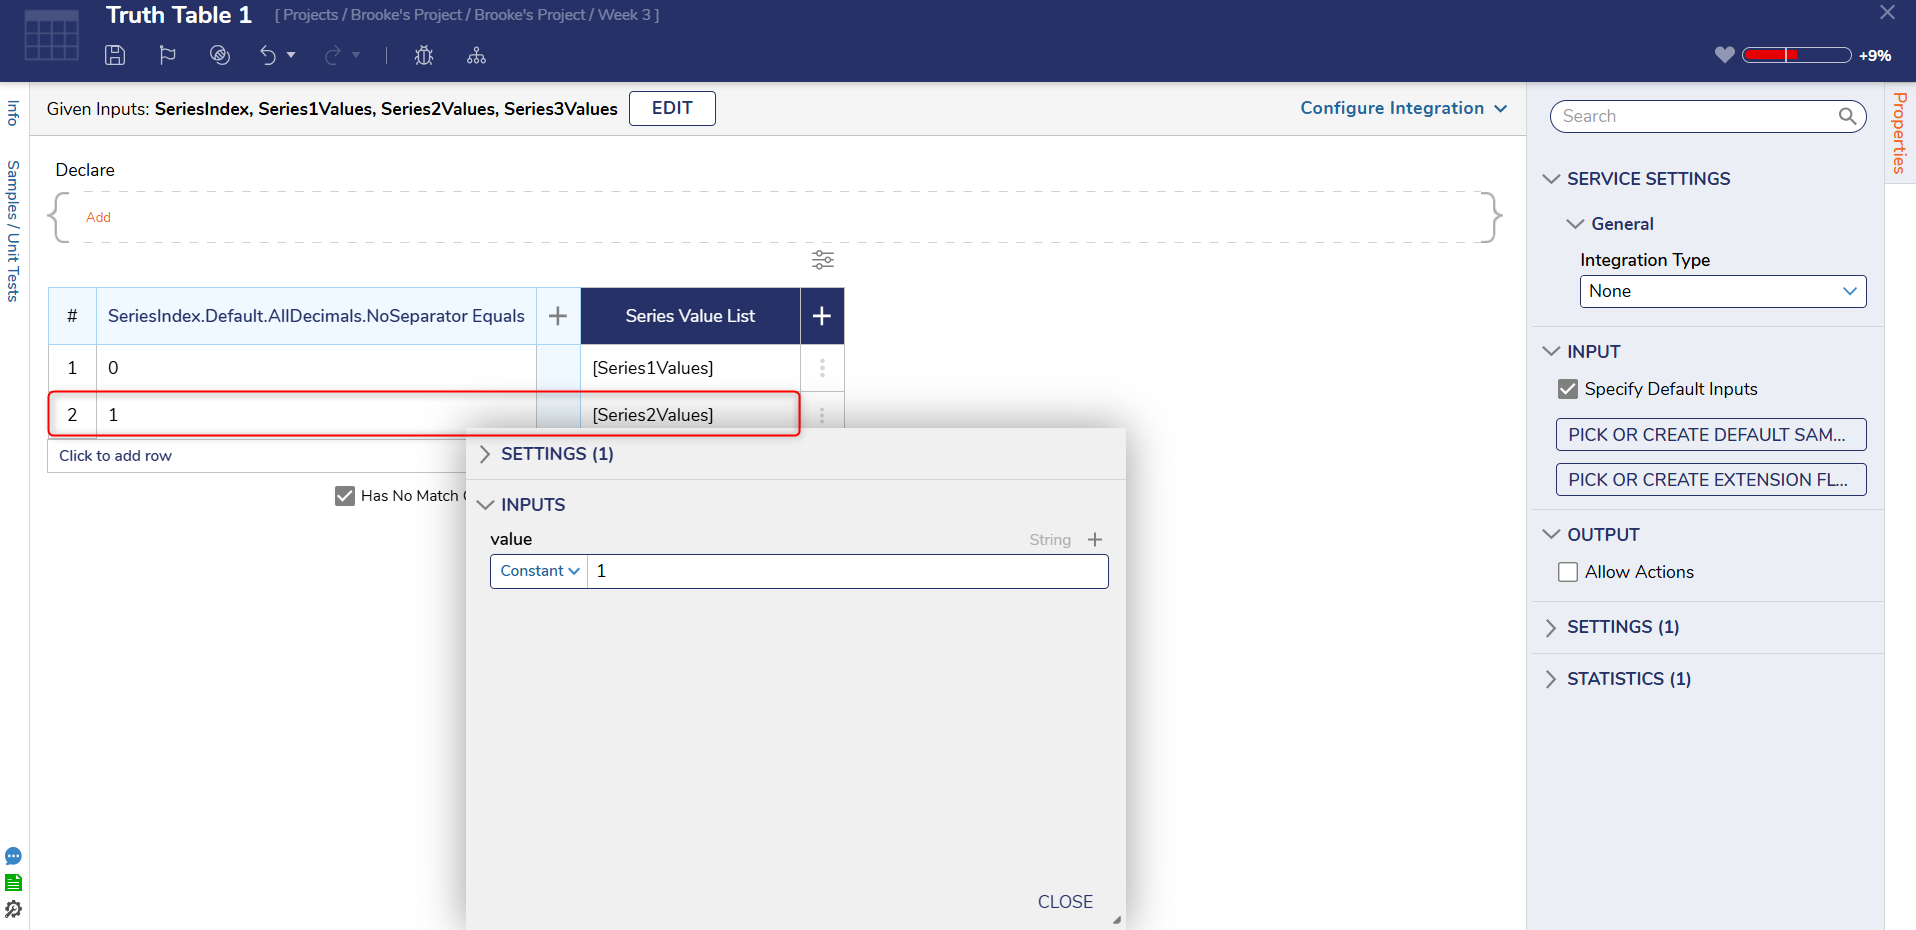
- Add another row. Under SeriesIndex Equals add 2 for INPUTS > value2. Add Series3Values under Series Value List.
- Disable the Has No Match Outcome boolean.
- Save and exit the Rule Designer.
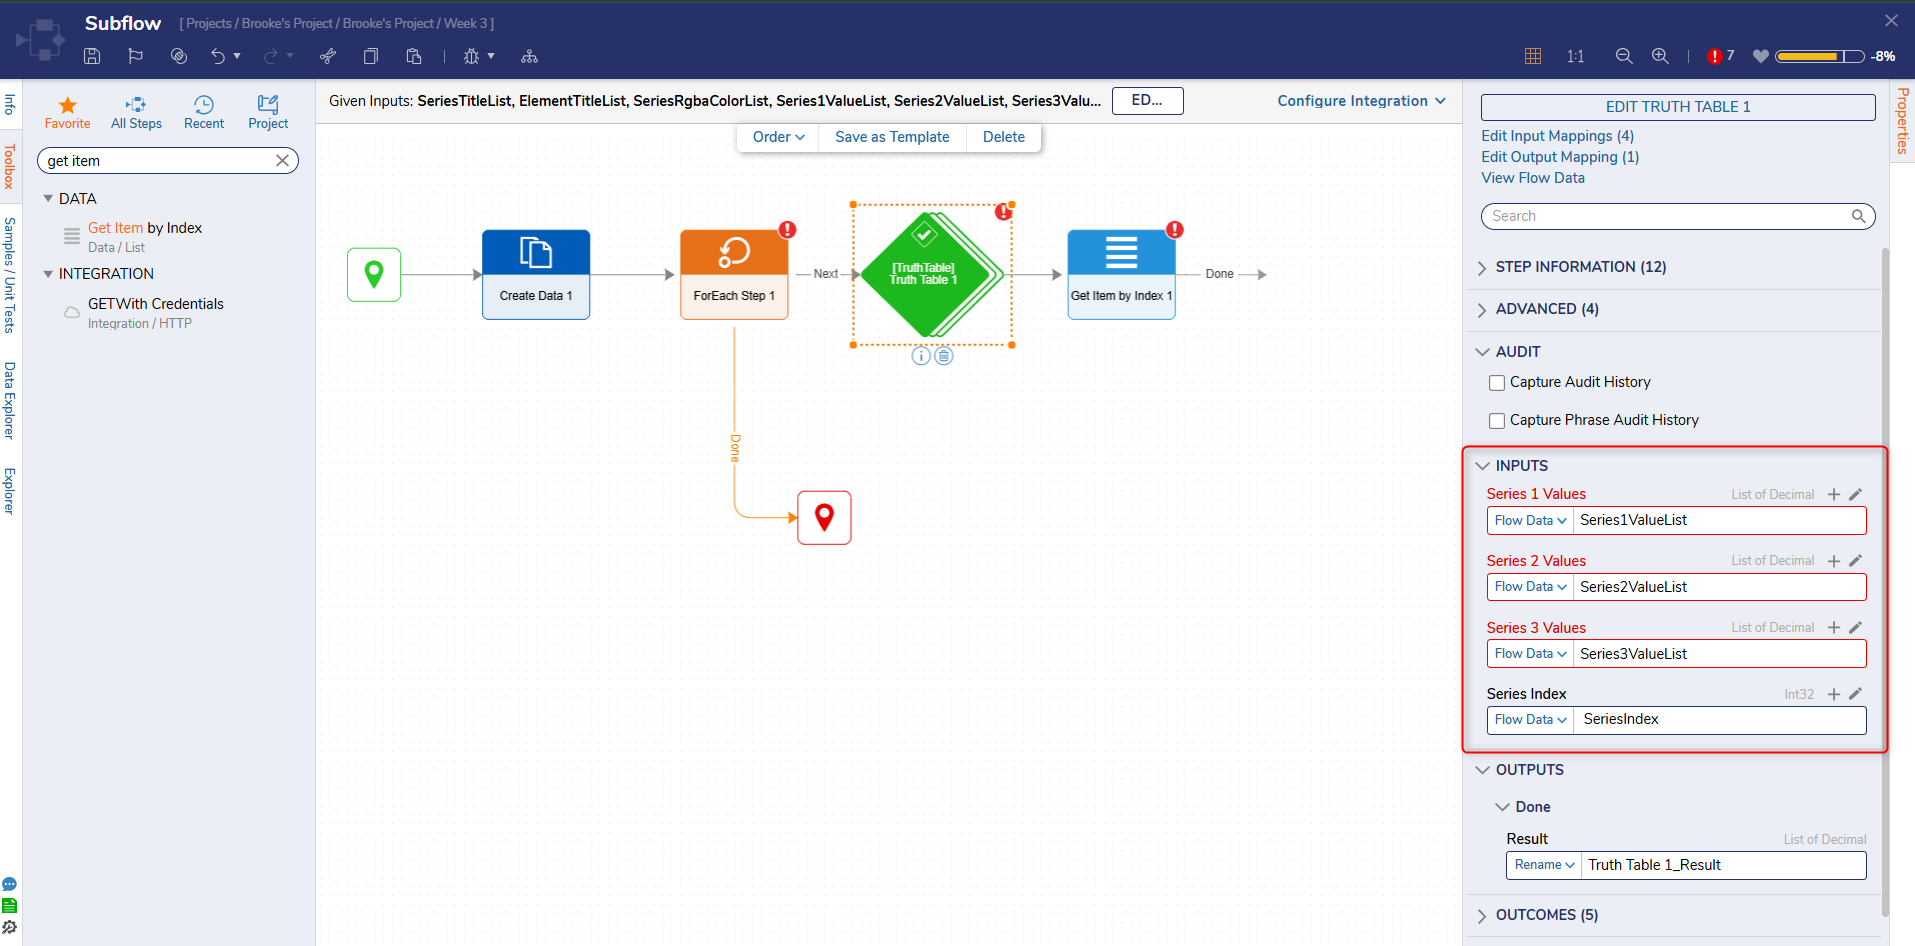
- Back in the Flow Designer, in the Properties panel > INPUTS section, match each input with its corresponding value using a Select From Flow mapping.
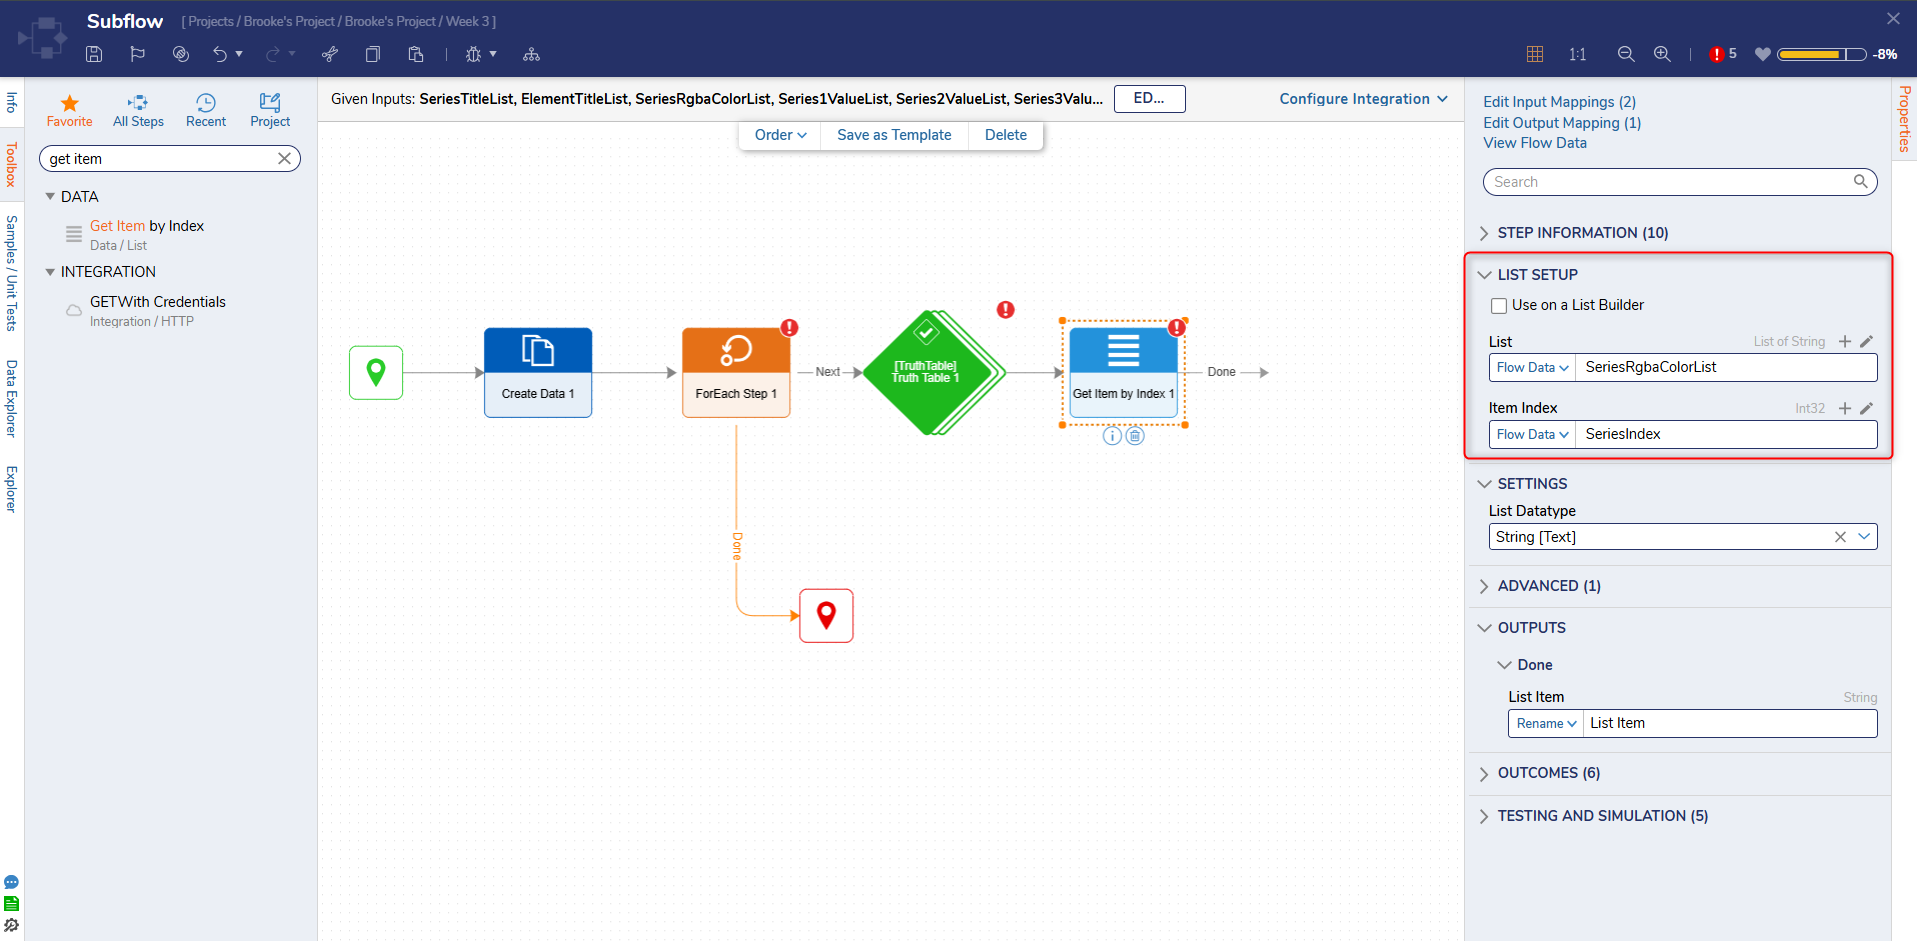
- From the Toolbox > DATA > LIST category, drag and connect a Get Item by Index step to the Truth Table outcome.
- With the Get Item by Index step selected, navigate to the Properties panel > INPUTS > Item Index and choose a Select From Flow input mapping. Select SeriesIndex.
- For the List input, choose a Select From Flow input mapping and choose SeriesRgbaColorList.
- From the Toolbox > FAVORITE STEPS section, drag and connect a Create Data step to the outcome of the Get Item by Index step.
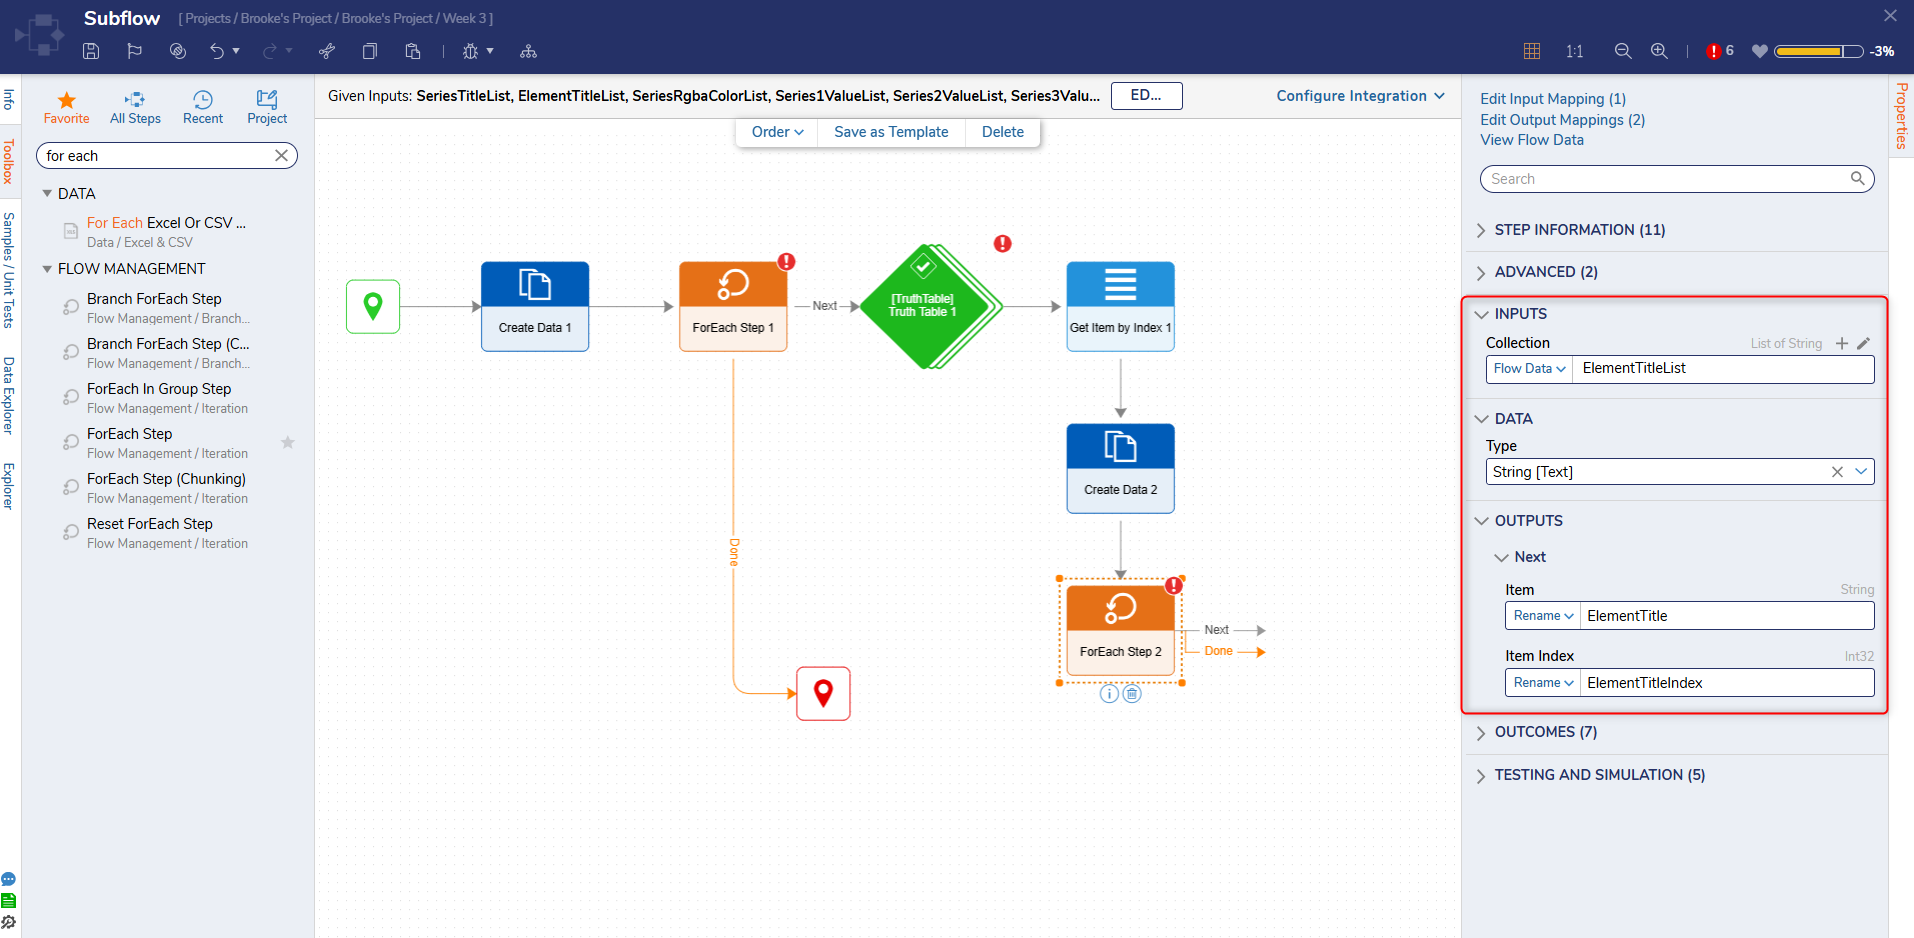
- Then, connect a ForEach step to the outcome of the Create Data step from the Toolbox > FLOW MANAGEMENT > ITERATION category.
- Navigate to the Properties panel > INPUTS > Collection and change the input mapping to Select From Flow. Select ElementTitleList.
- The data will automatically populate the required fields, the OUTPUTS > Next items have been renamed for example clarity.
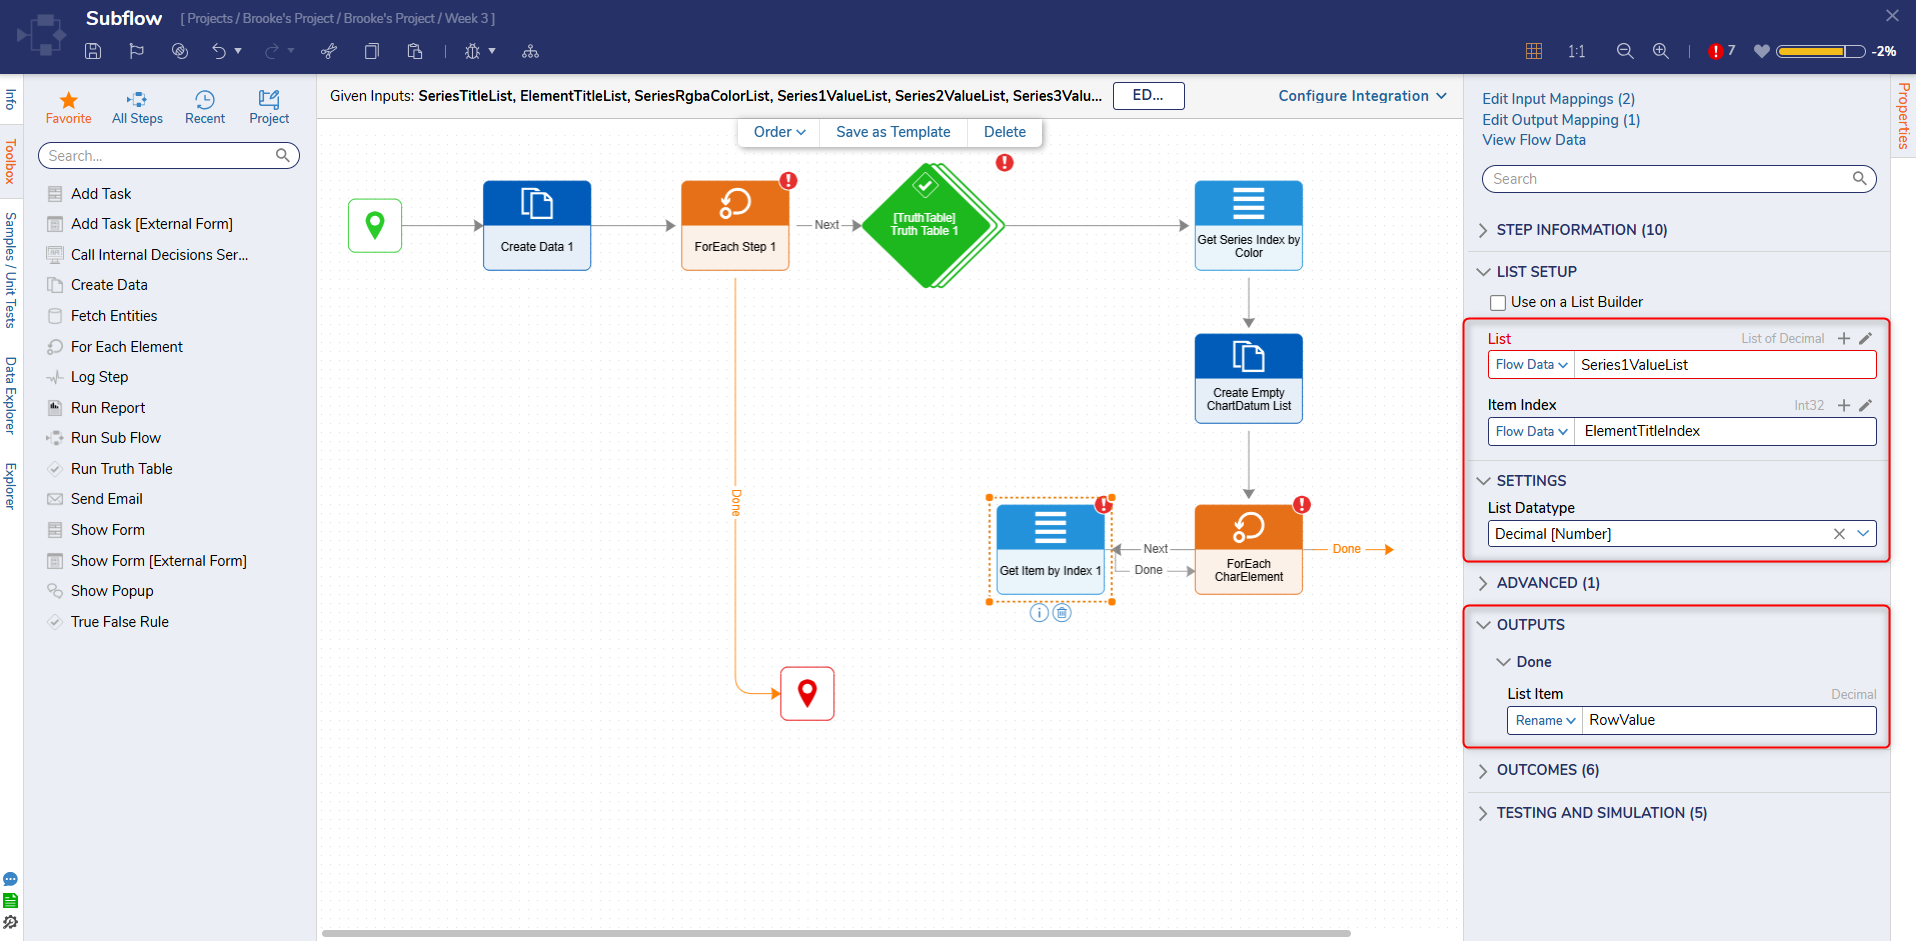
- On the Next outcome of the ForEach step, connect another Get Item by Index step.
- Under INPUTS > ItemIndex, change the input mapping to Select From Flow and choose ElementTitleIndex.
- For the List input, choose SeriesValueList using a Select From Flow mapping.
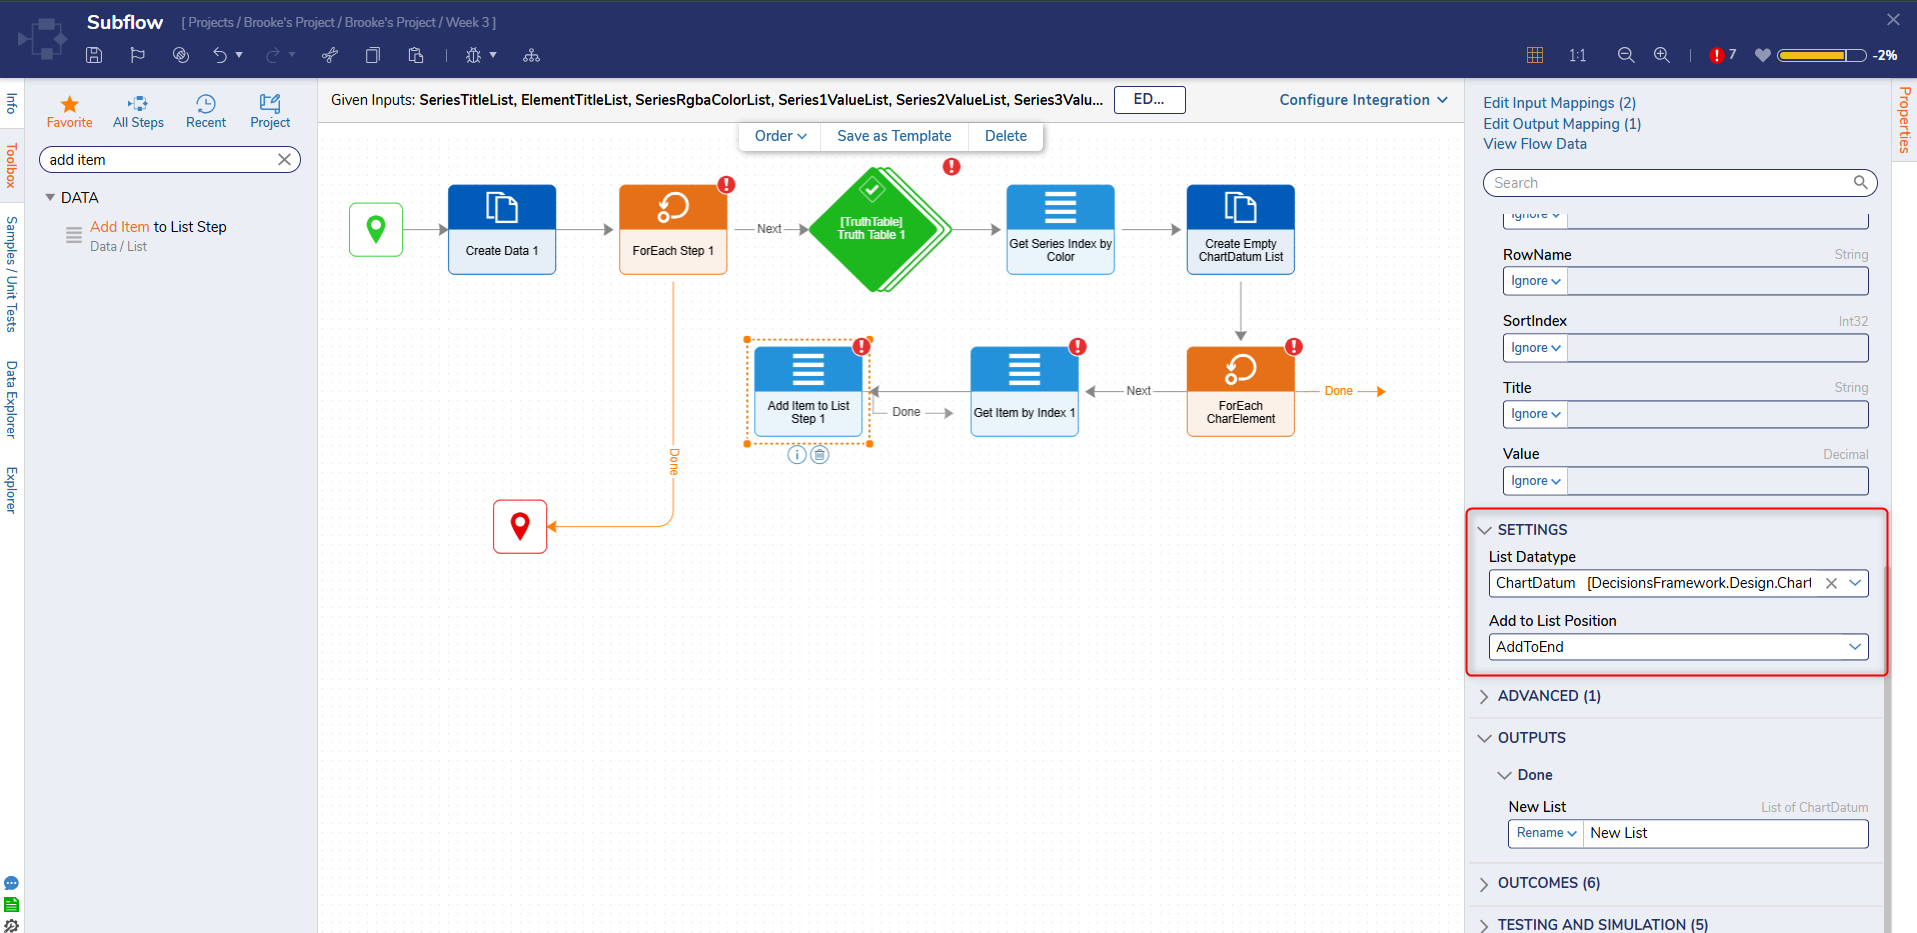
- From the Toolbox > DATA > LIST category, drag and connect an Add Item To List step to the outcome of the Get Item by Index step.
- With the Add Item to List step selected, change the DATA > ListType to ChartDatum using All/Search.
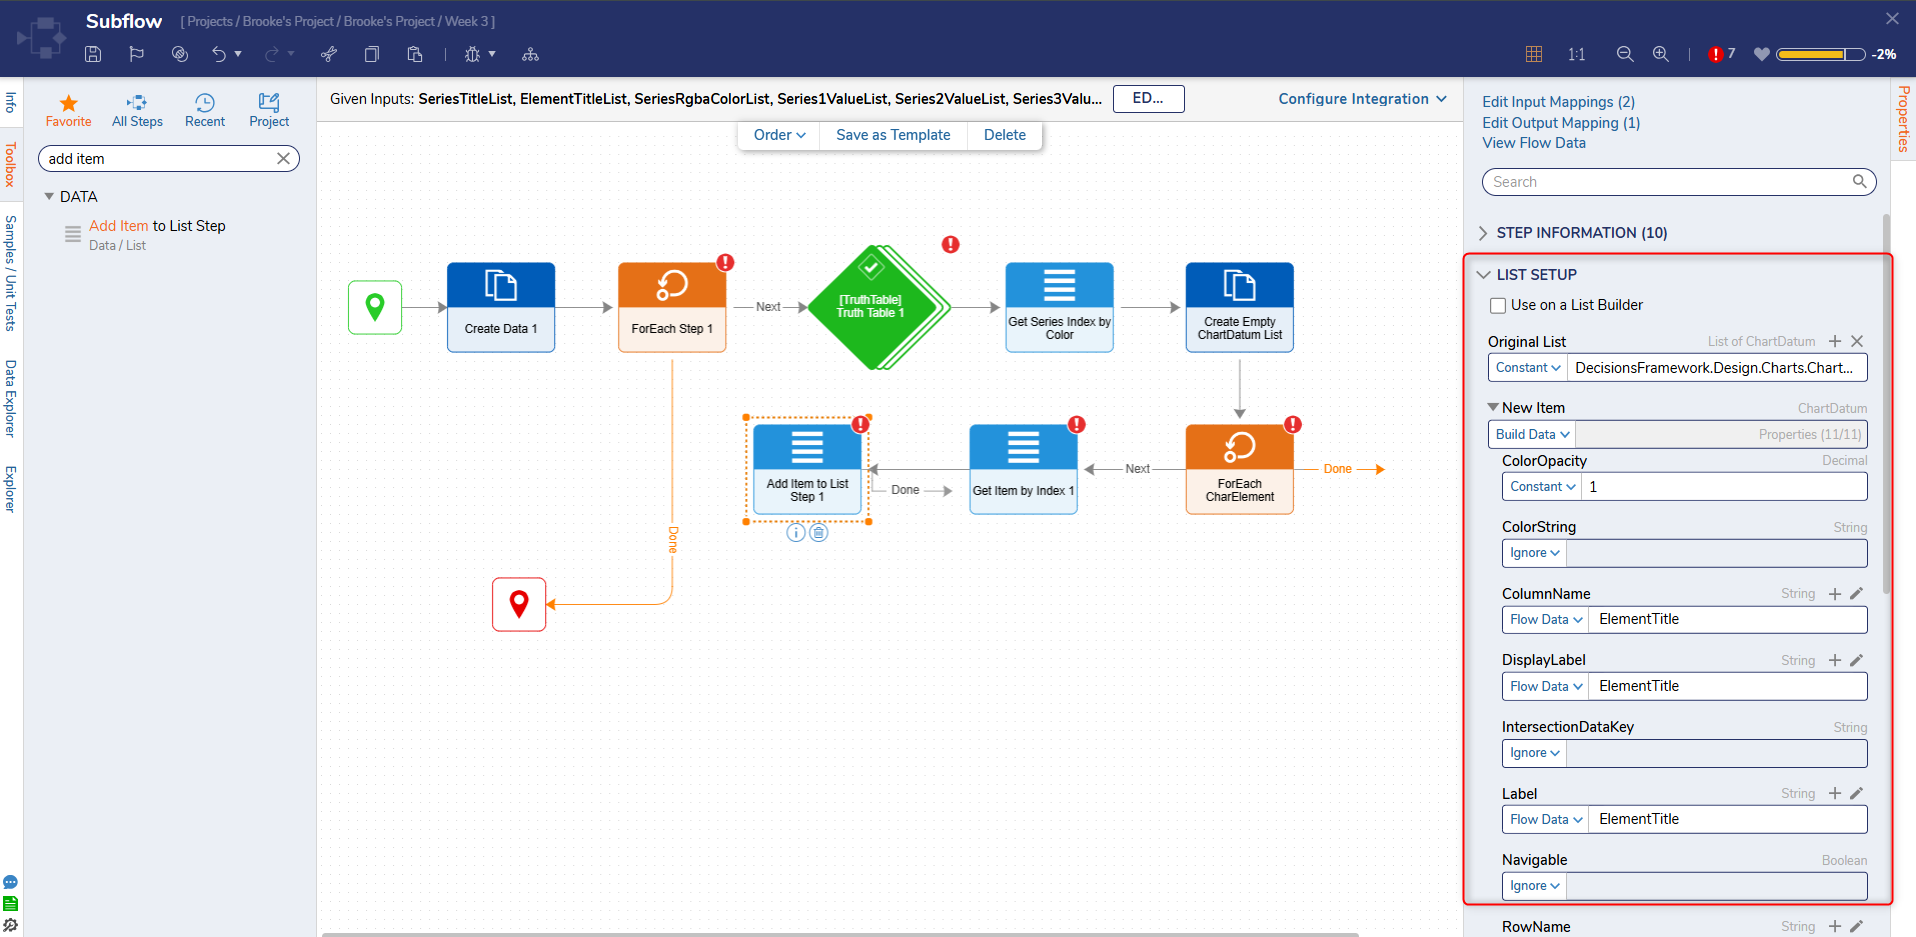
- Then, under INPUTS > New Item, change the input mapping to Build Data.
- Change the input mapping of the INPUTS > ColorOpacity to Constant and add 1.
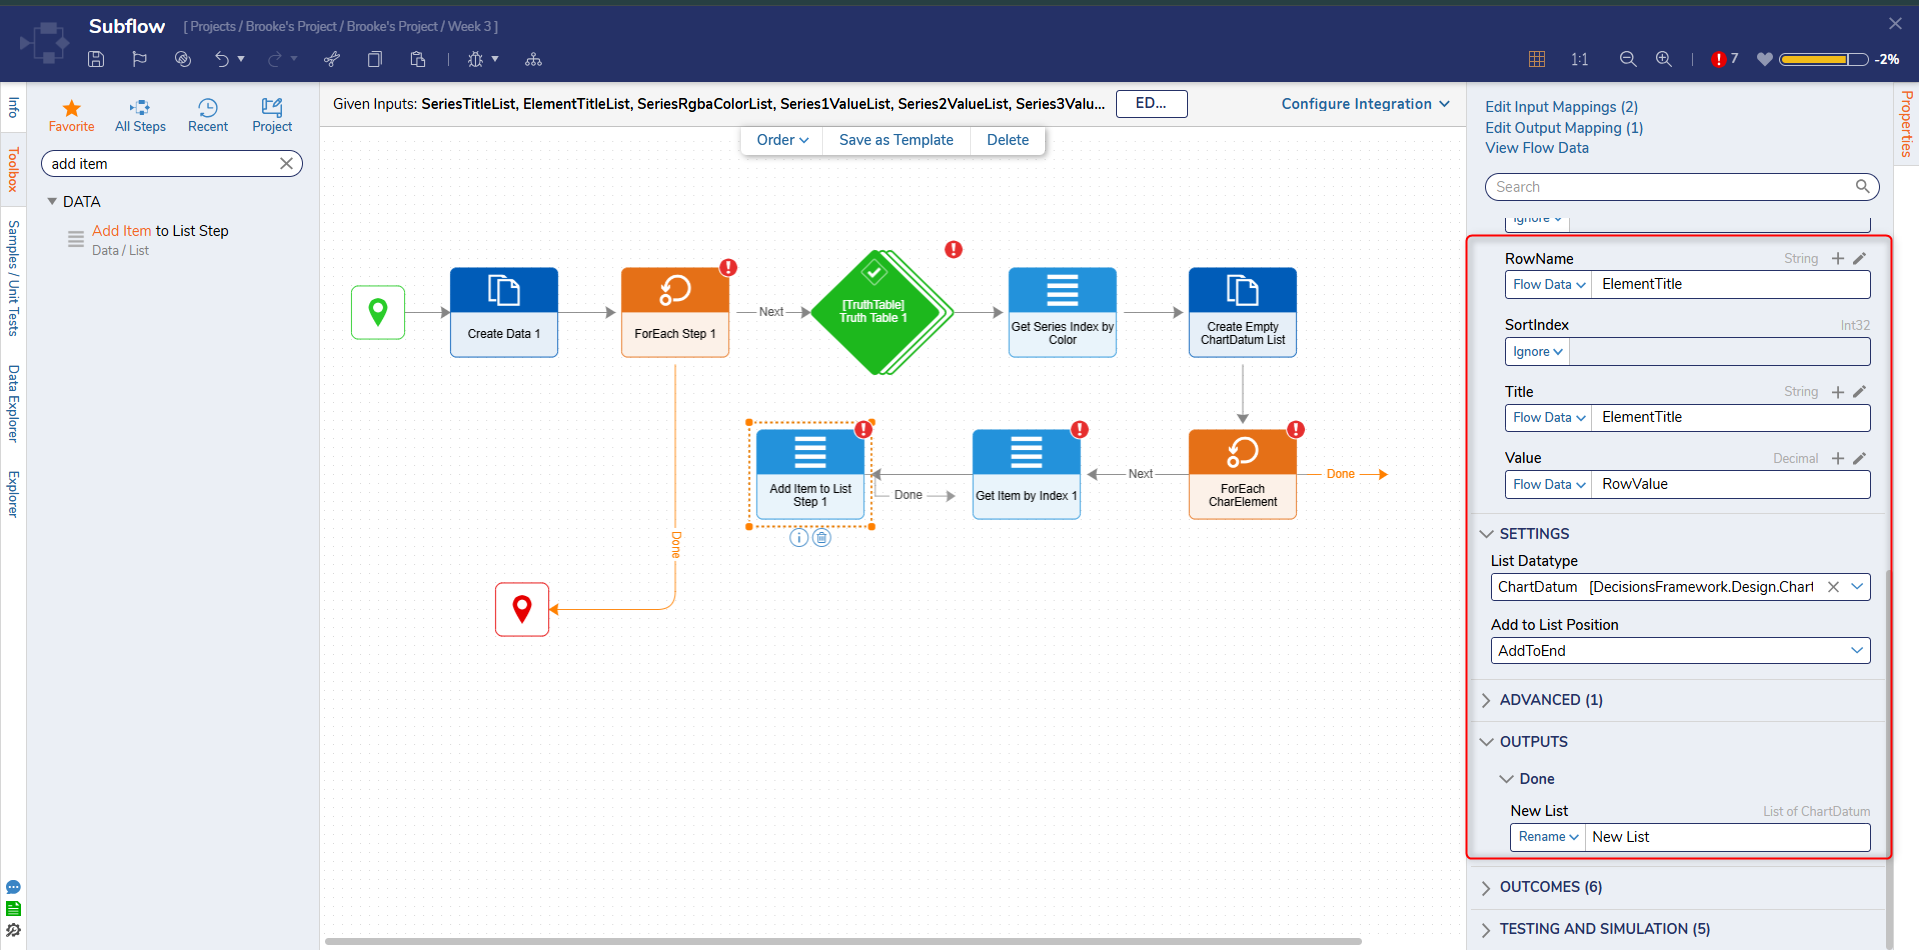
- The INPUTS > ColumnName, DisplayLabel, Label,RowName, and Title will all have a Select From Flow mapping with ElementTitle as the value.
- Set INPUTS > Value to a Select From Flow mapping and select RowValue or the output from the previous Get Item by Index step.
- Next, set the INPUTS > Original List to a Select From Flow mapping and choose ChartElementList.
- Locate OUTPUTS > Done > New List and set the input mapping to Change Value. Choose ChartElementList.
- Connect the outcome of the Add Item to List step to the last ForEach step.
- Connect the Done outcome of the last ForEach step to a second Add Item to List step.
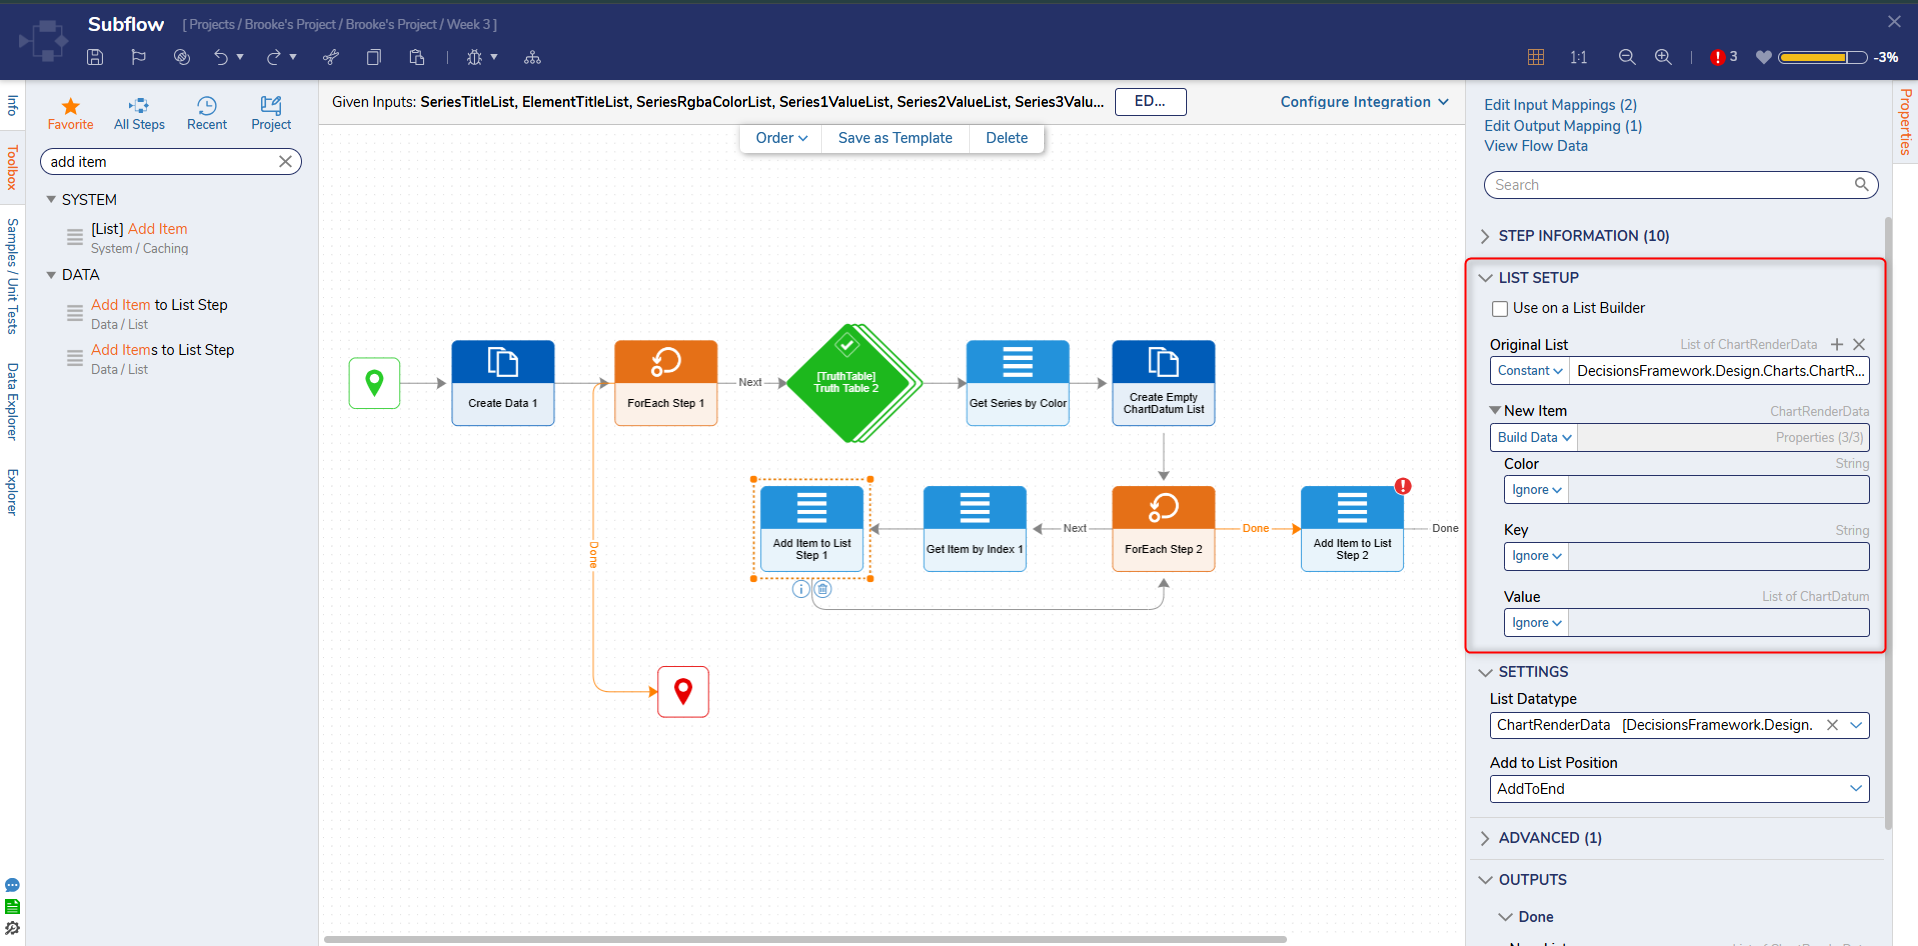
- Next, in the Properties panel of the second Add Item to List step, navigate to the Properties panel > DATA > ListType and choose ChartRenderData using All/Search.
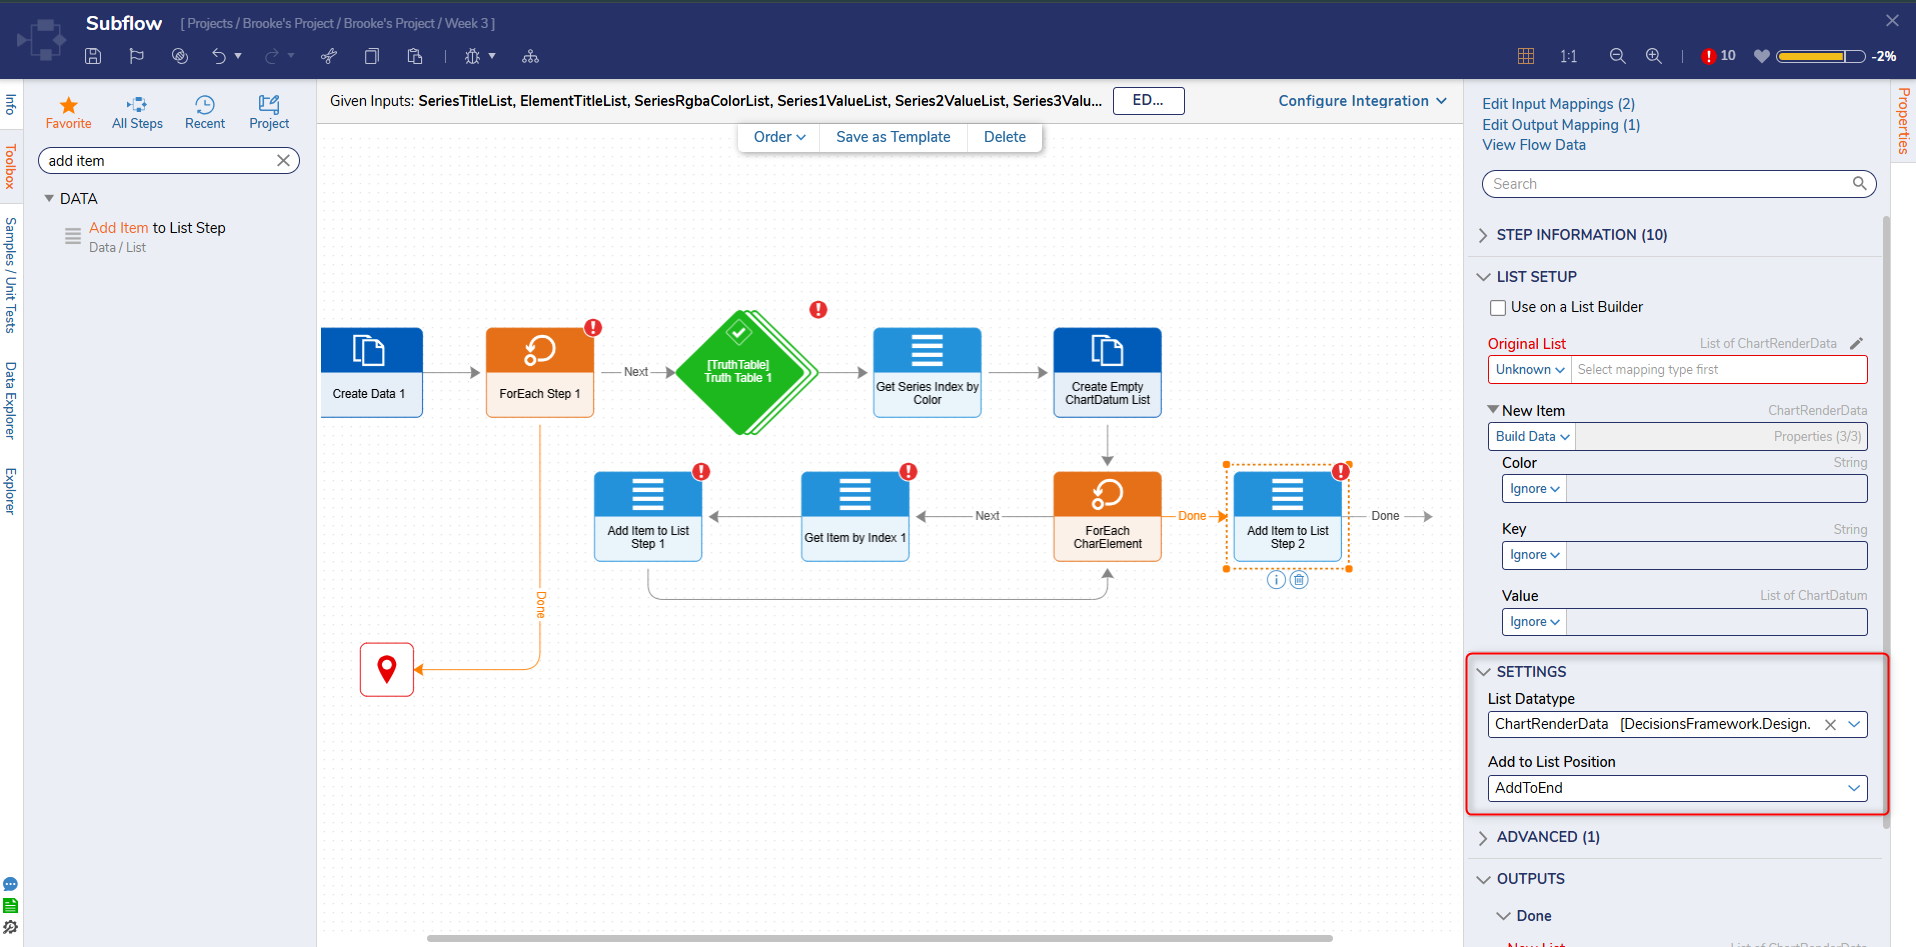
- Under INPUTS > New Item choose the Build Data input mapping.
- Change the input mapping for INPUTS > Color to Select From Flow and choose SeriesColor.
- The INPUTS > Key will have a Select From Flow input mapping with Series selected.
- INPUTS > Value will also have a Select From Flow input mapping with ChartElementList selected.
- The INPUTS > Original List will have a Select From Flow input mapping of ChartRenderData.
- Navigate to OUTPUTS > Done > New List and set the mapping to Change Value and select ChartRenderData.
- Connect the outcome of the Add Item Item to List step to the first ForEach step in the Flow.
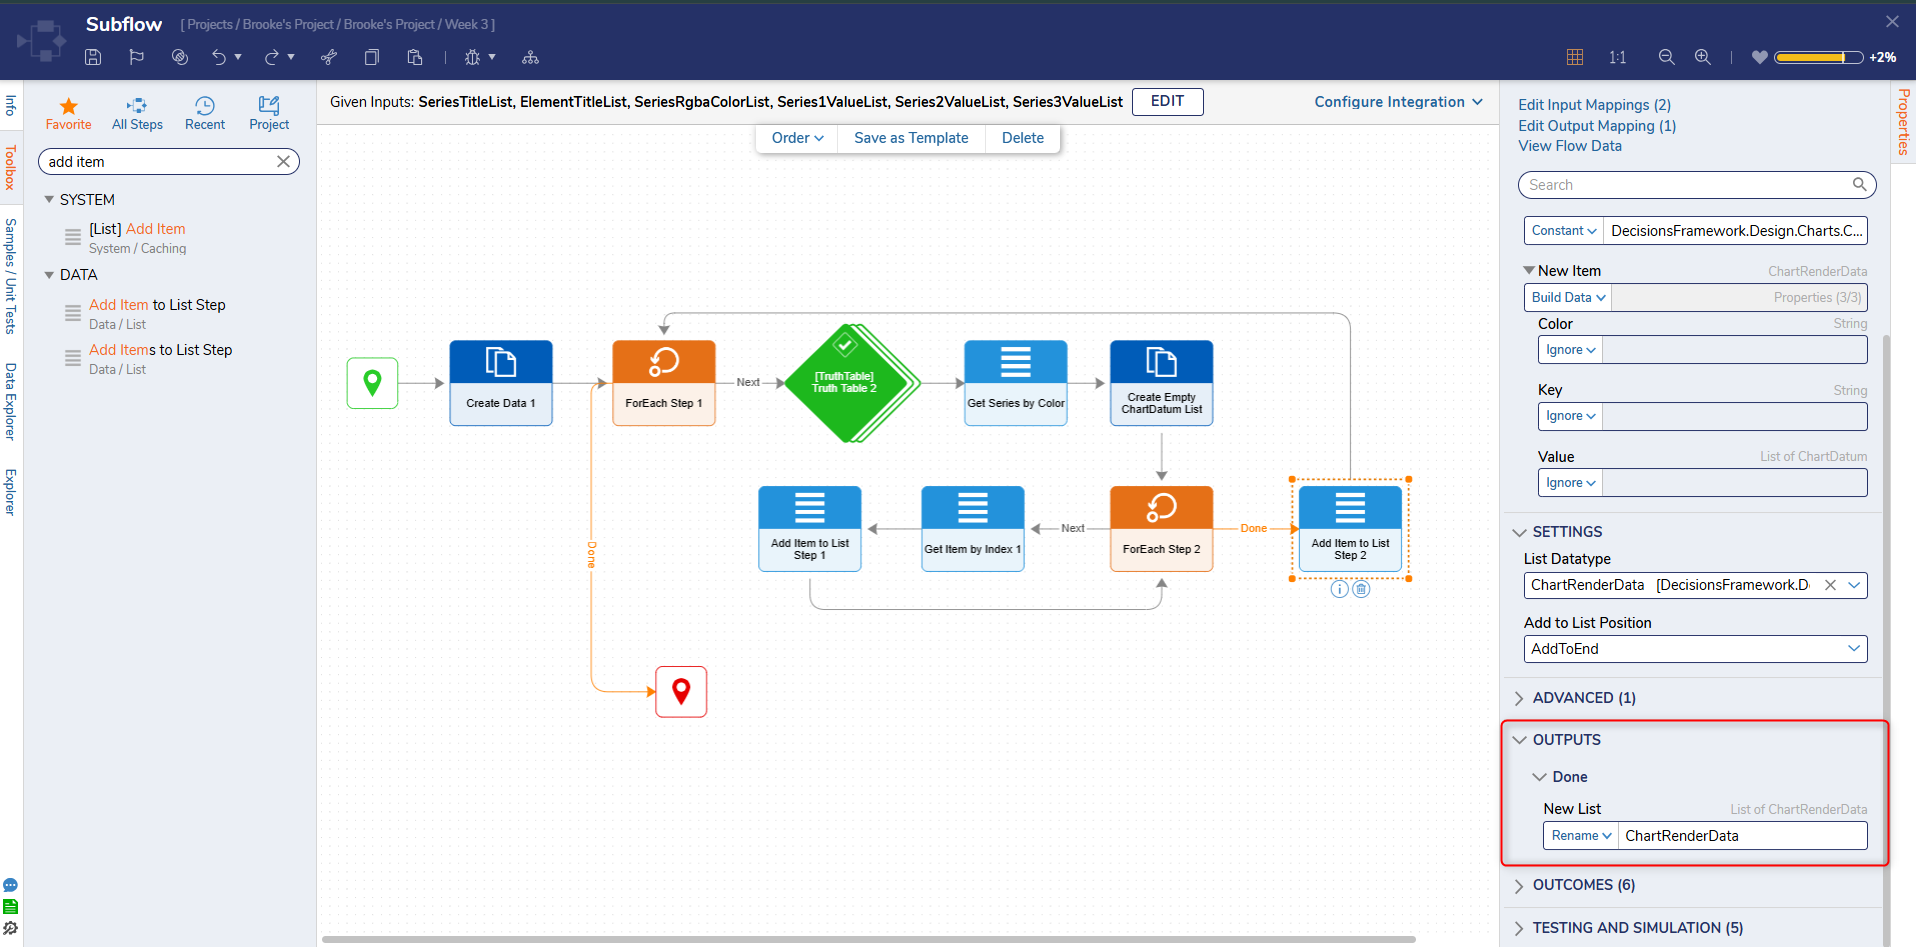
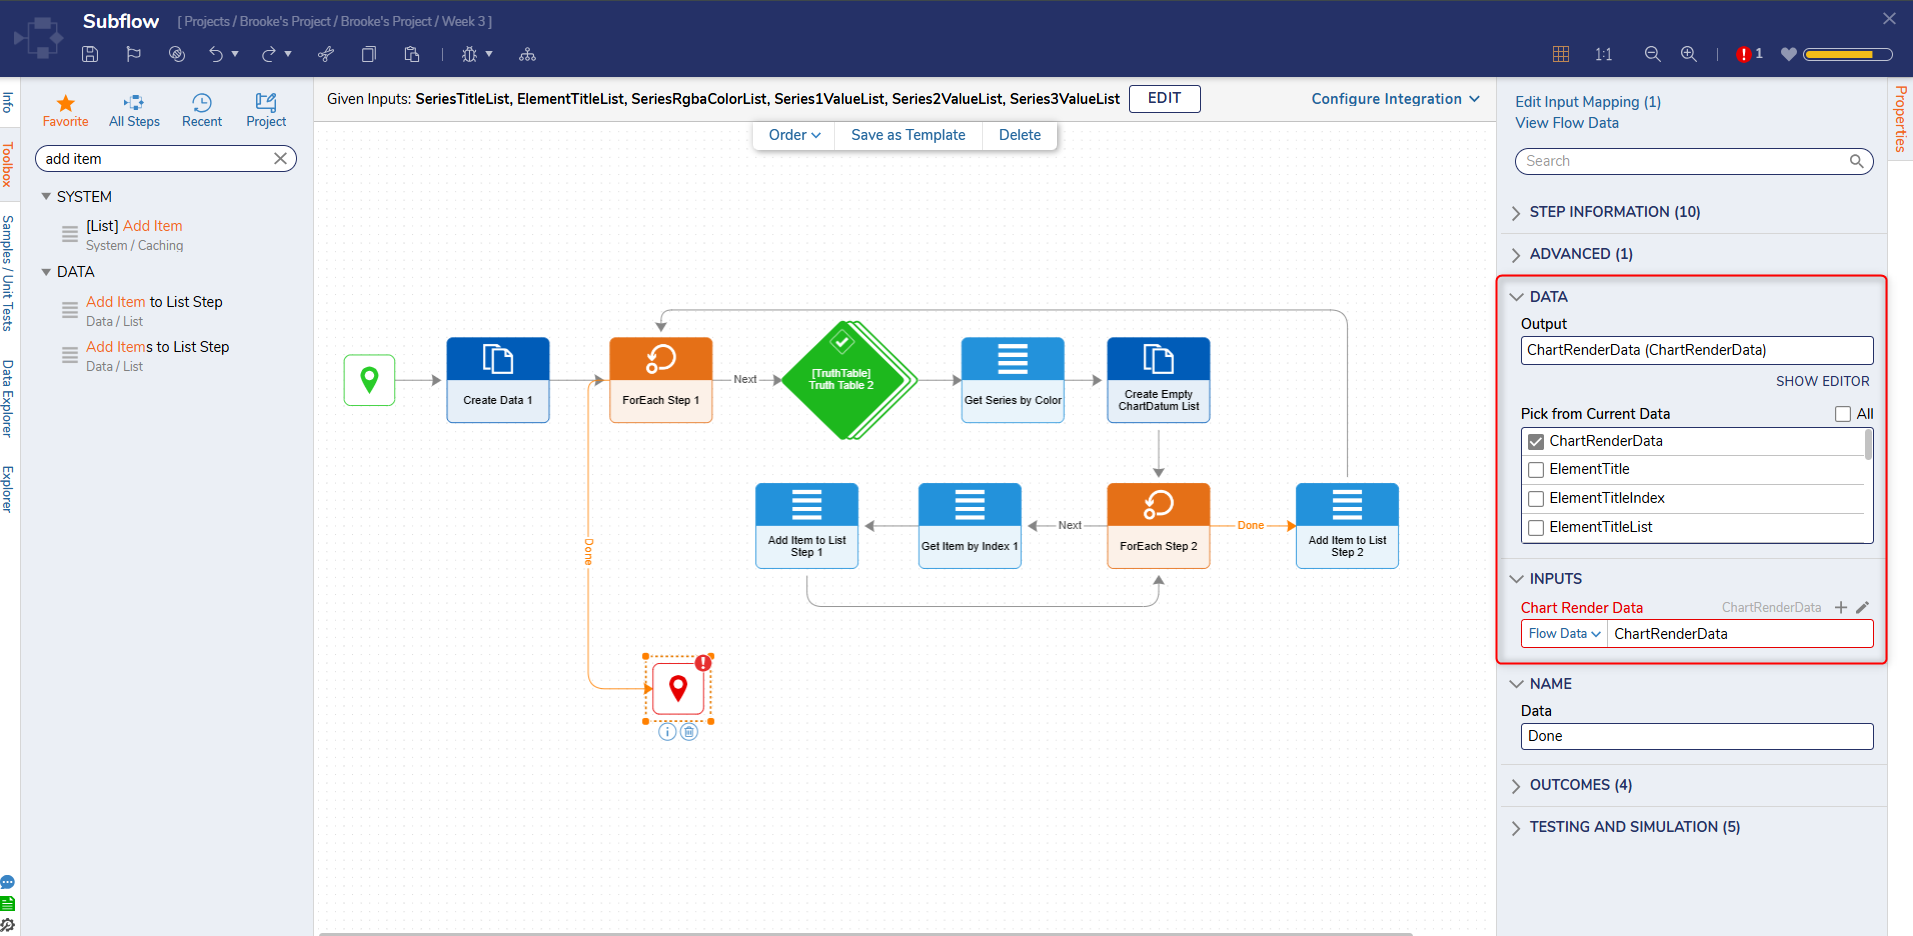
- Make sure the End step passes out the ChartRenderData output.
- Save and exit the Flow Designer.
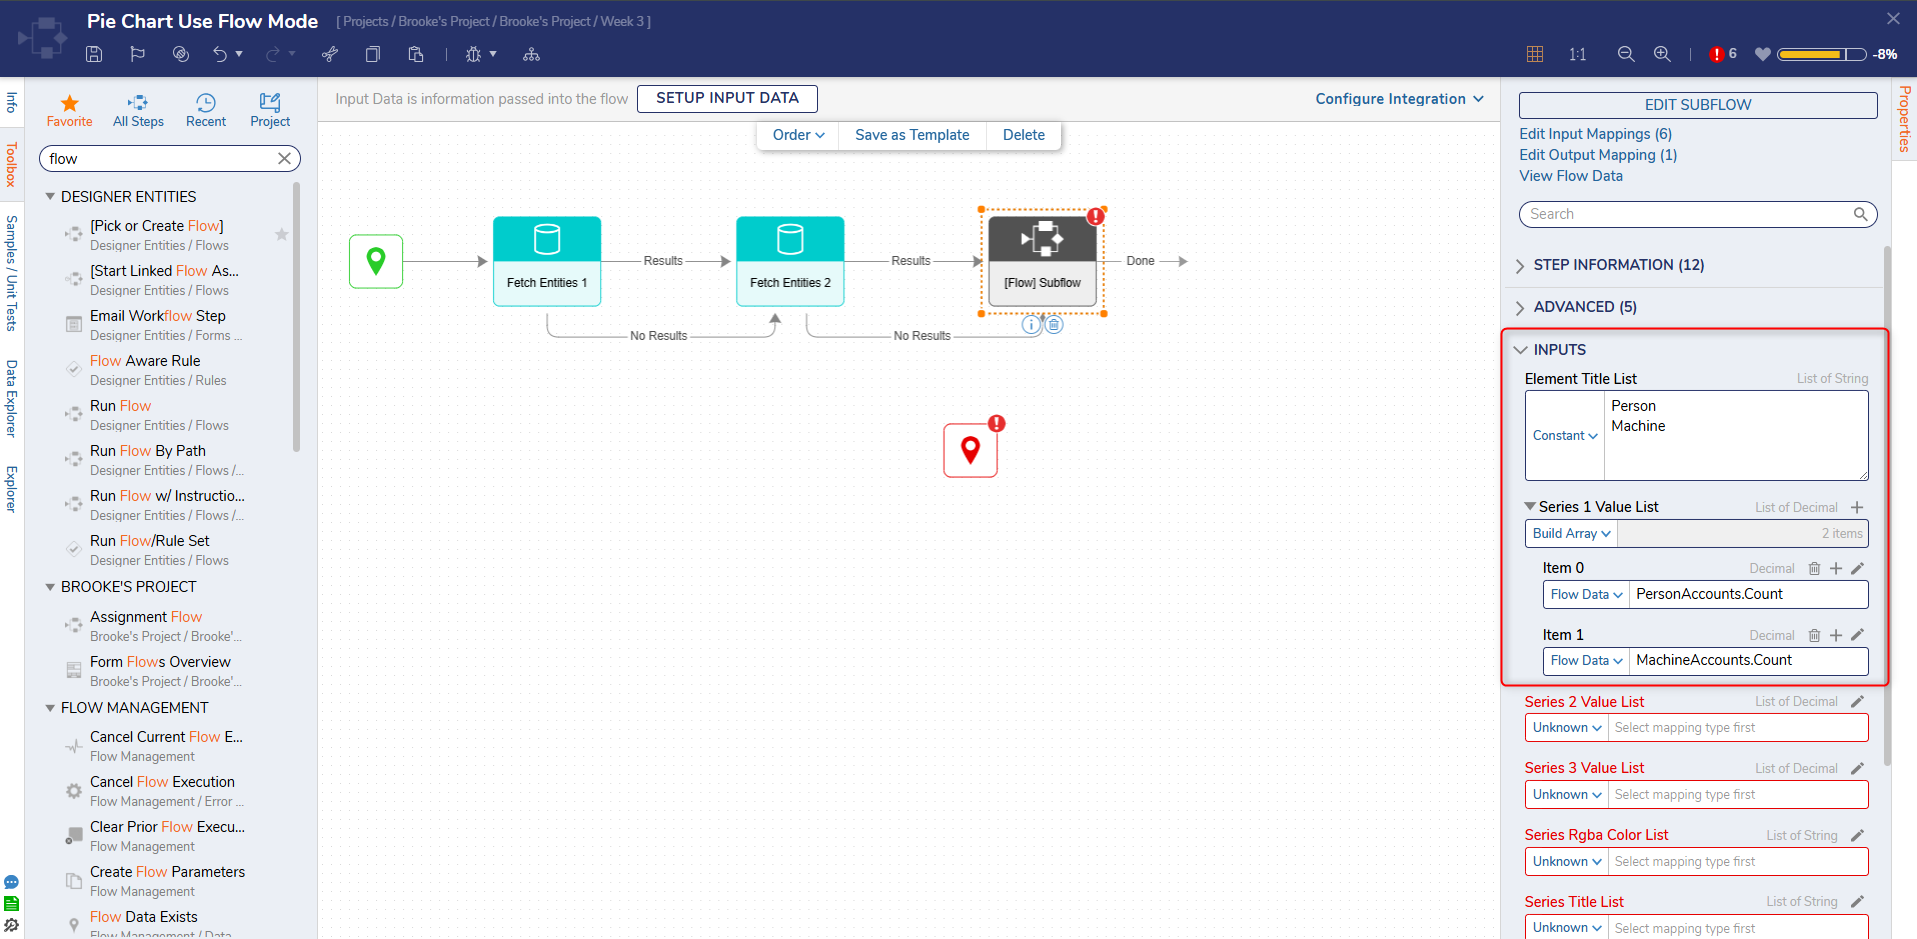
- In the main Flow Designer, navigate to the Properties panel > INPUTS of the Sub Flow.
- The Element Title List will have a Constant input mapping. Add Person and Machine.
- Change the input mapping on the Series 1 Value List to Build Array. Add another item; all items have a Select From Flowinput mapping.
- In the Data Input window for Item 0, select Person Accounts and drill down to Count. Click Done.
- In the Data Input window for Item 1, select Machine Accounts and drill down to Count. Click Done.
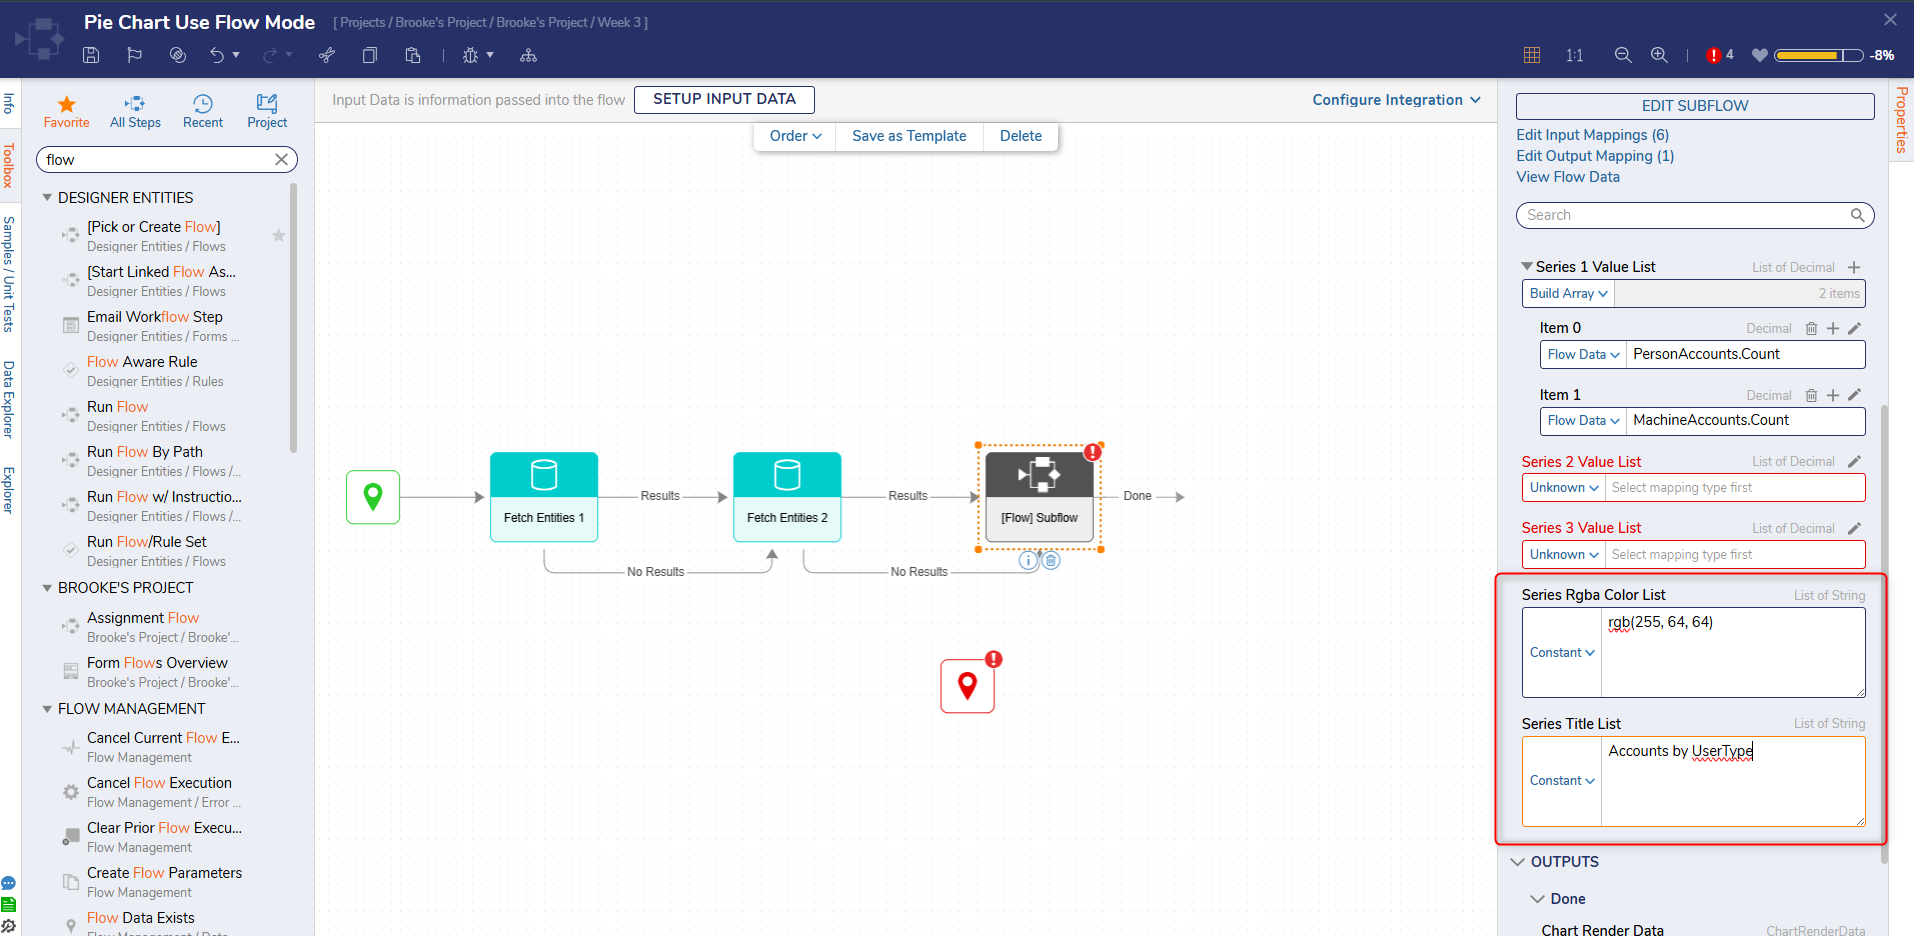
- Next, Series Rgba Color List and Series Title List will both have Constant input mappings.
- For Series Rgba Color List add rgb(255, 64, 64).
- For Series Title List add Accounts By Usertype.
- Then, save and close the Flow.
- In the Page Designer, the Pie Chart automatically populates with the types of accounts.
- Save and Close the Page Designer when complete.
Feature Changes
| Description | Version | Release | Developer Task |
|---|---|---|---|
| Chart Flows are now Page Aware | 9.8 | March 2025 | [DT-043315] |
| Chart Flows are now Folder aware. | 9.5 | November 2024 | [DT-042016] |