Overview
Decisions comes with a built in system to support Users at a moment's notice. Users can pull up a chat window to get insight into the platform and how to proceed with any challenge. This document will discuss how the Dart works and how Users can get the most out of it.
Dart
In the bottom left corner, look for the chat bubble icon.png) in the Help Center.
in the Help Center.
This window will begin a conversation with Dart, Decisions' AI assistant.
Dart went live in February 2025 and is available to every Decisions User, no matter what version they are on. In v9.7 and higher Dart has additional UI changes and functionality. Dart will be happy to answer your questions with response times
Dart has been trained on this documentation site, specifically the Version 9, Step Library, Projects, and Release Notes sections. This does mean that for earlier versions it may give incorrect information.
Dart is context aware and will provide suggestion prompts depending on what designer you are in. 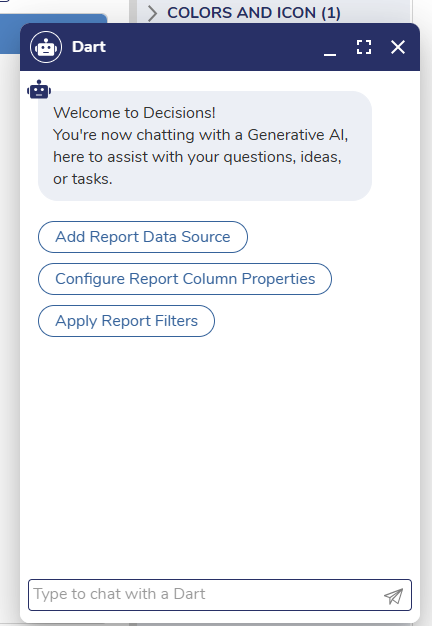
Dart is going to be continually updated with new features, so please keep an eye out on new releases.
Support
Our expertly trained Support team is also always available if Dart cannot provide the help you need. Ask for 'Support' in the chat window and you will be connected to a human representative.
Commands
There are commands that can be run through the chat by a member of the support team in order to execute specified commands. After the support team runs a command, the User must accept the command via a prompt from Dart in order for the action to be completed. See the chart below for available commands.
| Command Name | Description |
|---|---|
| \logs | Downloads log file and places directly into support chat thread in product help channel. |
| \sql | Runs a query through the query editor and returns results in an excel file in the support channel. |
Feature Changes
| Description | Version | Release | Developer Task |
|---|---|---|---|
| Introduced Dart to the platform. | 9.7 | February 2025 | [DT-043394] |