Overview
The Root-Cause Analyzer of the Diagnoser visualizes the root-cause of the selected attribute to identify underlying issues and where they originate. This process is enhanced with built-in Machine Learning capabilities, allowing Users to detect root-causes more quickly. The resulting information then aids Users to create potential solutions.
Nodes and Edges
The Root-Cause Analyzer diagram is comprised of a Root Node, several intermediate Leaf Nodes, and Edges.
Nodes
The Root Node represents all cases within the Event Log. From here, edges connect it to its leaf nodes.
Leaf nodes represent a group of similar cases and display the following information:
- The average value of the target parameter for the root-cause analysis, e.g., duration.
- The number of cases within the group, i.e., node
- The accuracy of the root-cause analysis for the given node
The number of cases affects the color of the node: darker colors denote a larger group in the node and vice versa.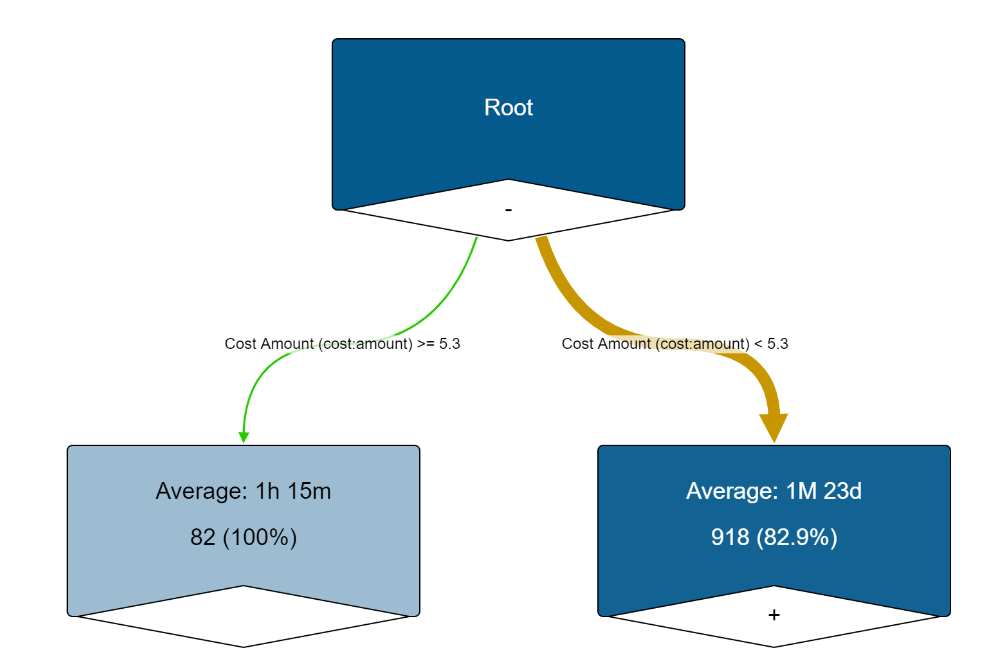
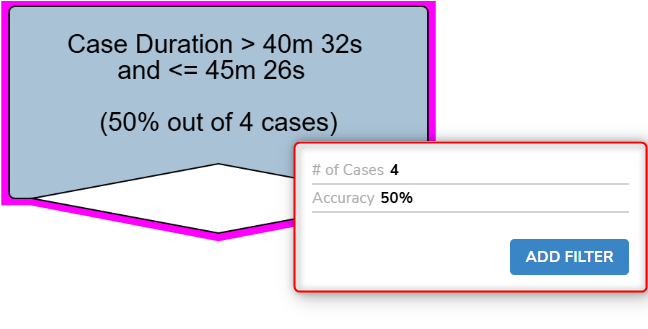
Double-clicking on a node opens additional information, such as the number of cases and root-cause analysis accuracy. Nodes with plus icons contain further leaf nodes.
Users may filter the Event Log to retain only the cases included by the sequence of root causes leading to the specified node.
Edges
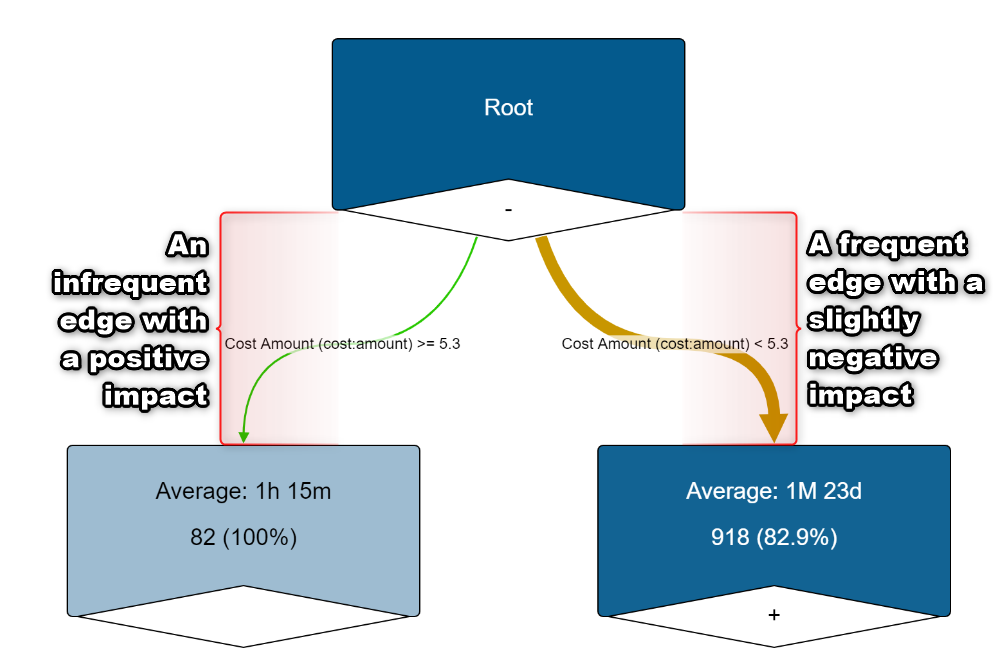
An Edge represents a root-cause leading to a specific value for the target parameter and displays the following information:
- The root-cause.
- The impact of the root-cause.
- The number of cases influenced by the root-cause.
The impact changes the color of the edge between gradient of green to red. Green details a positive impact, while red details a negative impact. Impacts in between are represented with different shades of yellow depending on the level of neutrality of the node.
The number of cases affects the thickness of the edge: thicker edges denote a higher number of cases and vice versa.
Example
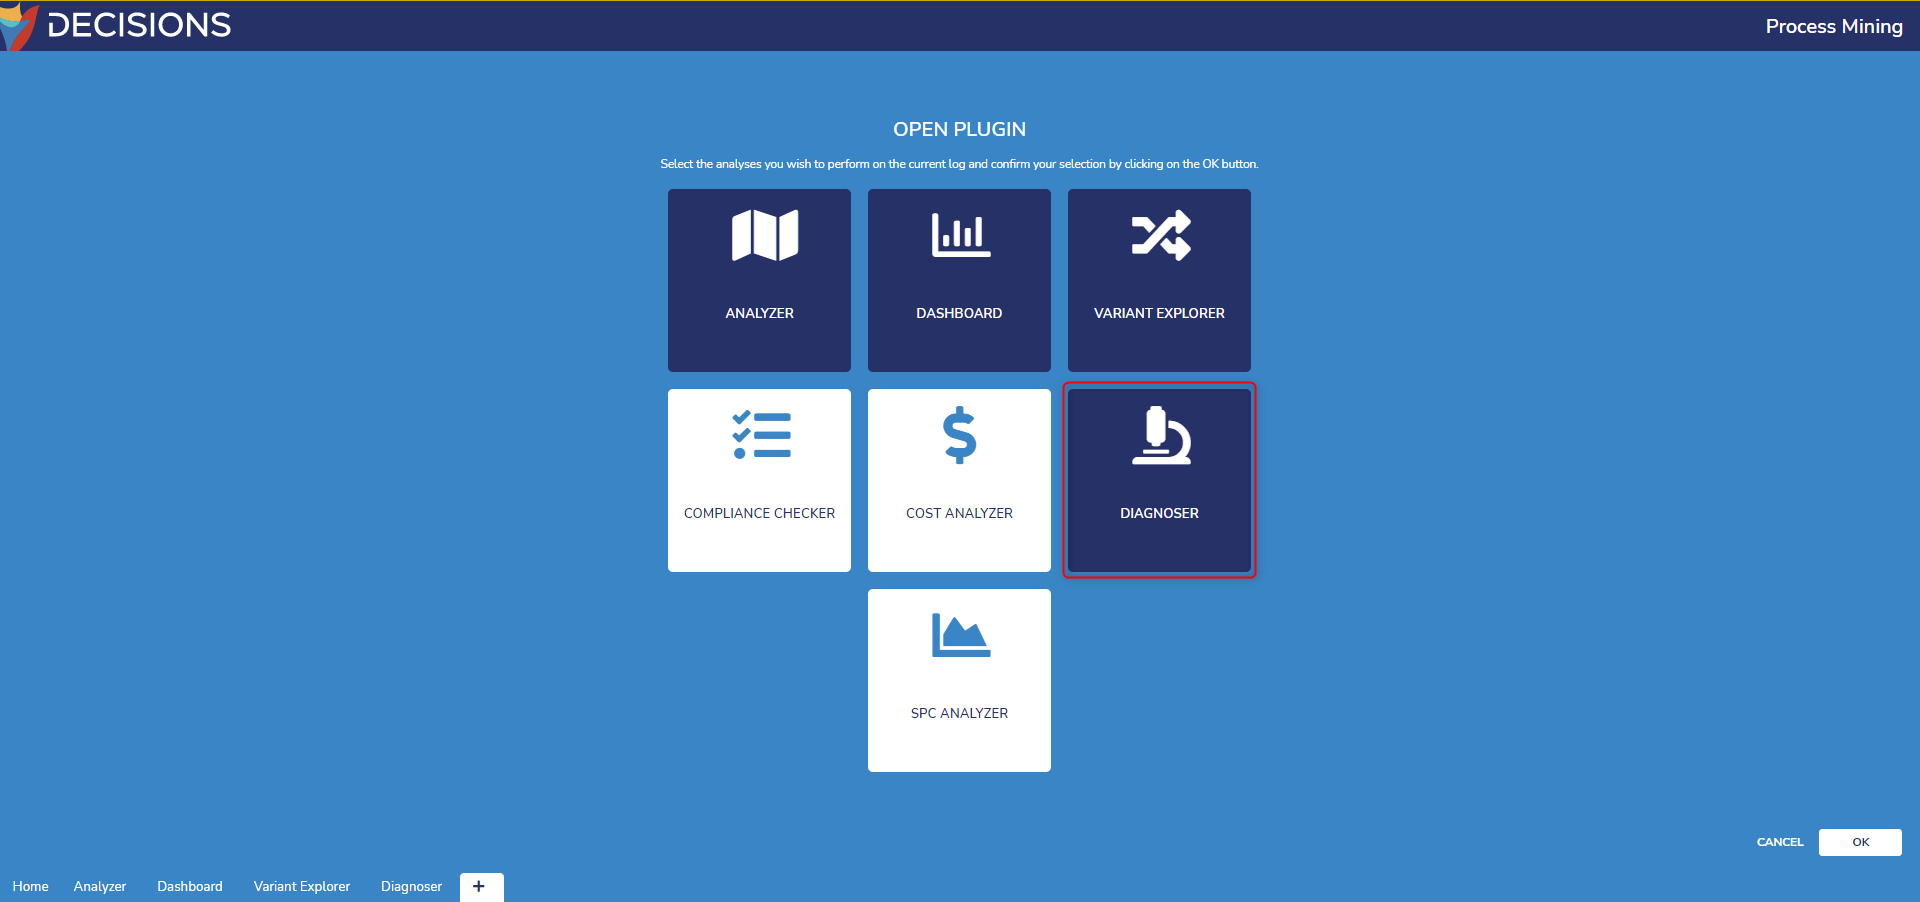
- Open an Event Log and select the plus icon at the bottom of the window. Select Diagnoser, then OK to create a Diagnoser tab.
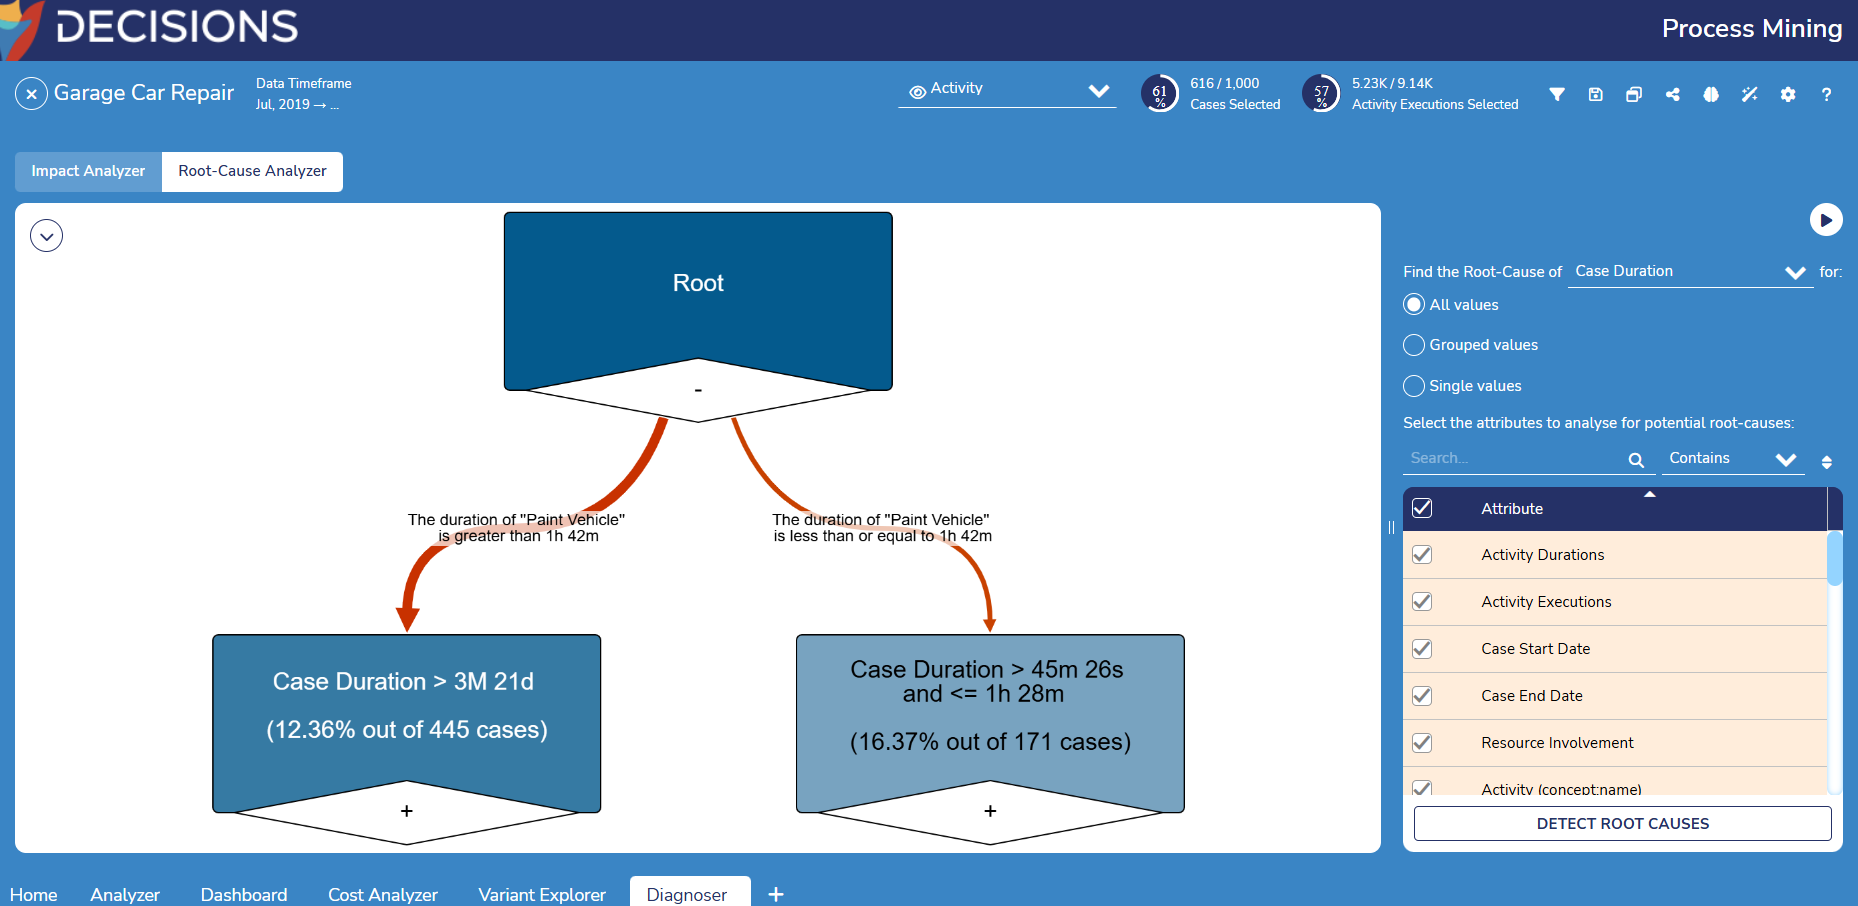
- Open the Diagnoser tab and change it from the default Impact Analyzer page to the Root-Cause Analyzer page by selecting its button above the center diagram.
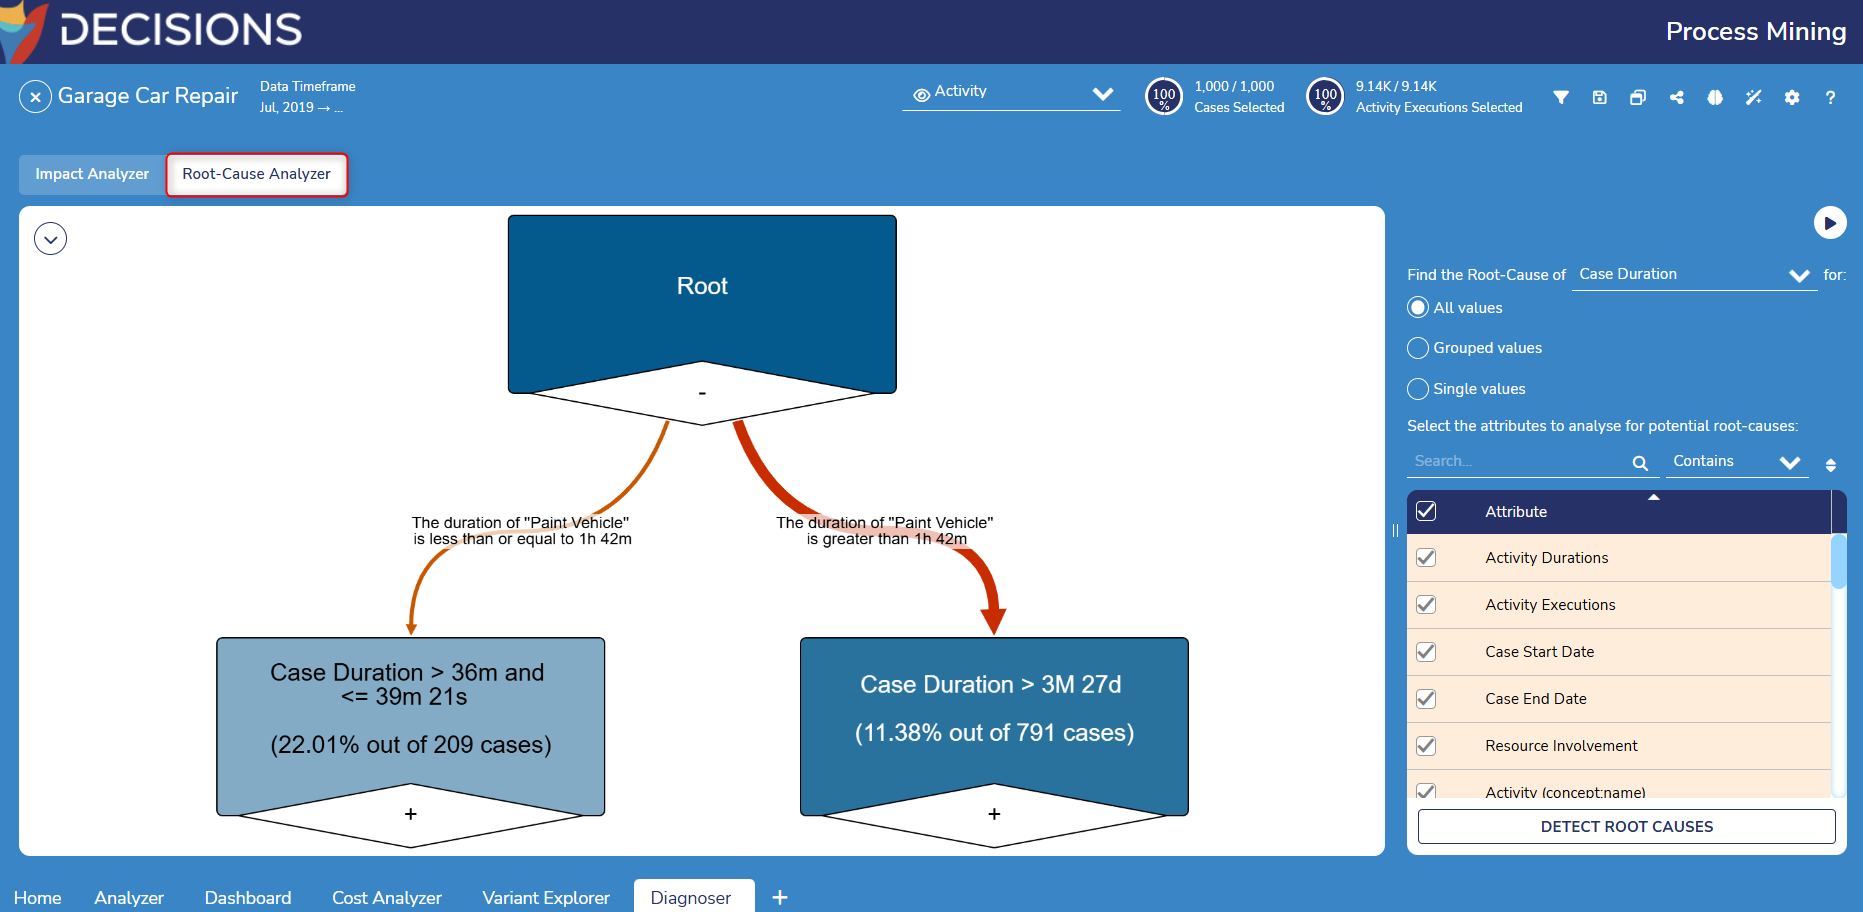
- In the Root-Cause Analyzer, navigate to the settings on the right of the diagram. For Find the Root-Cause of, select a parameter to investigate. This example examines Case Duration.
- Underneath the prior setting, select the following attributes to analyze. This example selects all attributes representing Case Duration. Cost Amount and Cost Currency attributes are automatically selected.
- Users can also limit the analysis based on the following selected options:
- All Values: This option discovers root causes for all possible values of the attribute without grouping.
- Grouped: This option groups selected values under the Desired Outcome group, and groups remaining values under the Undesired Outcome group.
- Single Values: This option keeps the selected values as they are and groups the remaining values under the Undesired Outcome group.
.png) After selecting all desired attributes to examine, select Detect Root Causes to construct the diagram with the new settings.
After selecting all desired attributes to examine, select Detect Root Causes to construct the diagram with the new settings..png)
- Users can also limit the analysis based on the following selected options:
- Notice the root node now contains two edges splitting the log's cases between the default root-cause and the root-cause.
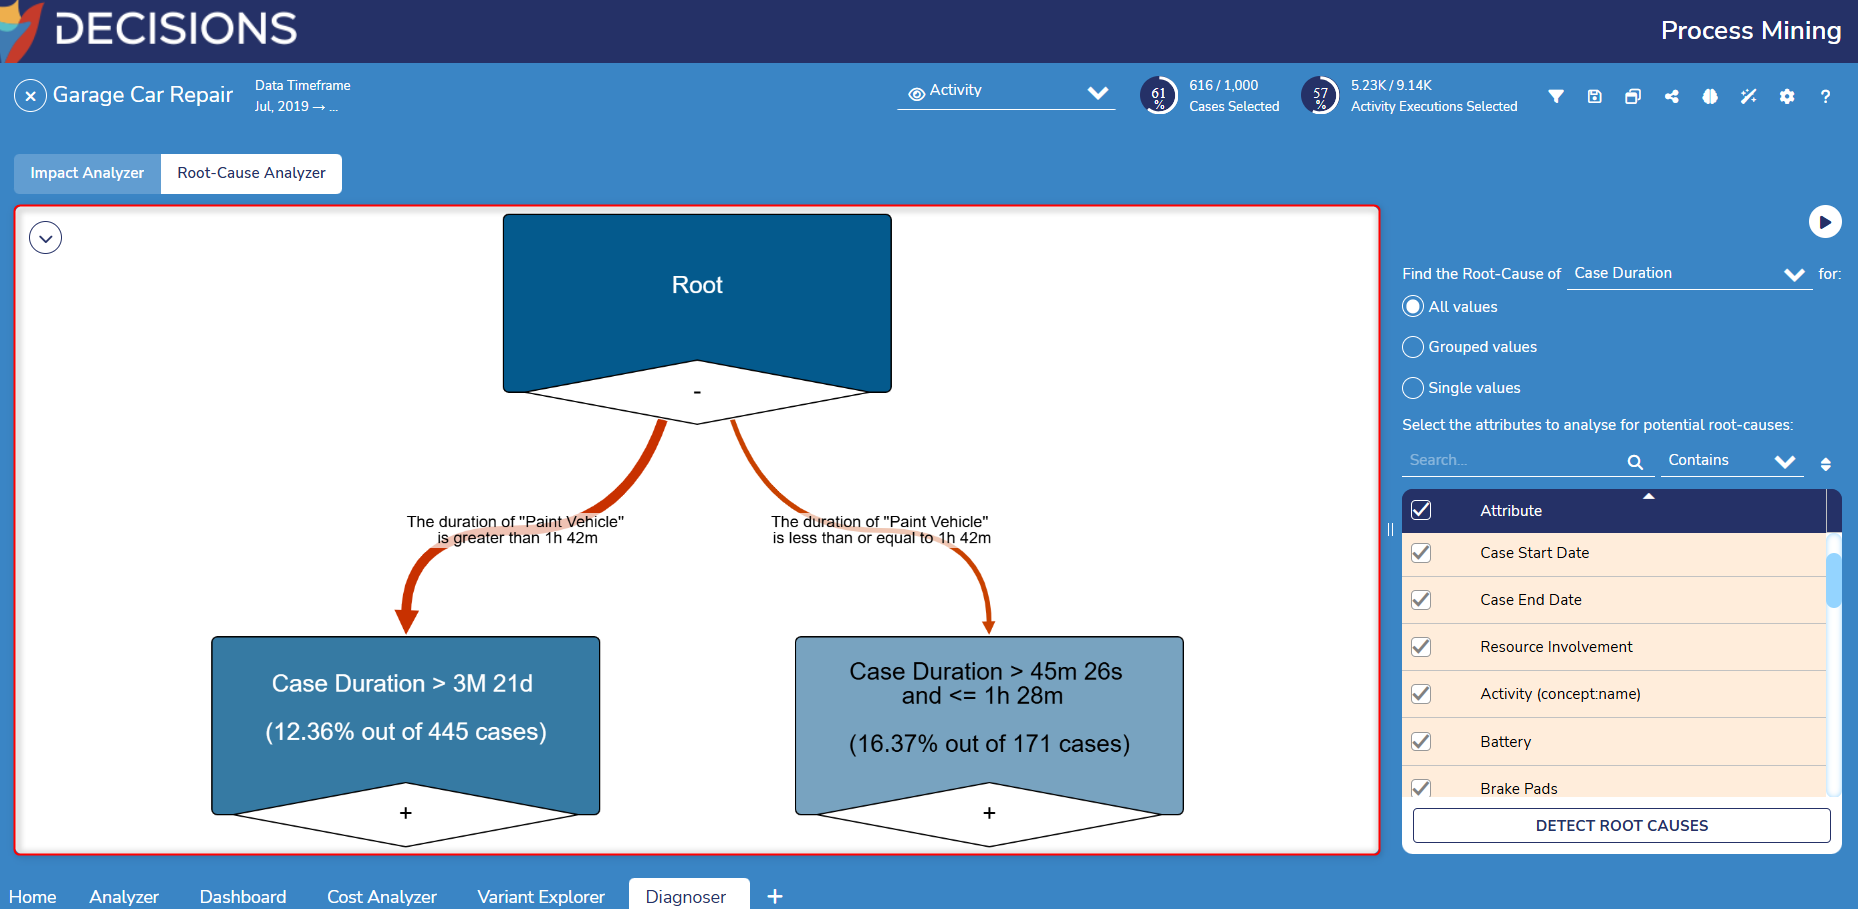
- To further examine the leaf nodes, double-click on leaf nodes with the plus icon to expand and view their nested branches.
.gif)
Filtering the Root-Cause Analyzer
Upon clicking on a node to view further details, Users may select Add Filter to automatically Create a Filter that retains only cases influenced by the sequence of root causes leading to the selected node.
Nested leaf nodes generate a filter for each layer to capture this sequence. For example, a leaf node two layers down from the root node will generate two filters.
After selecting this button, the filter may be edited, disabled, or deleted by navigating to the filter window to the top right of the window..gif)
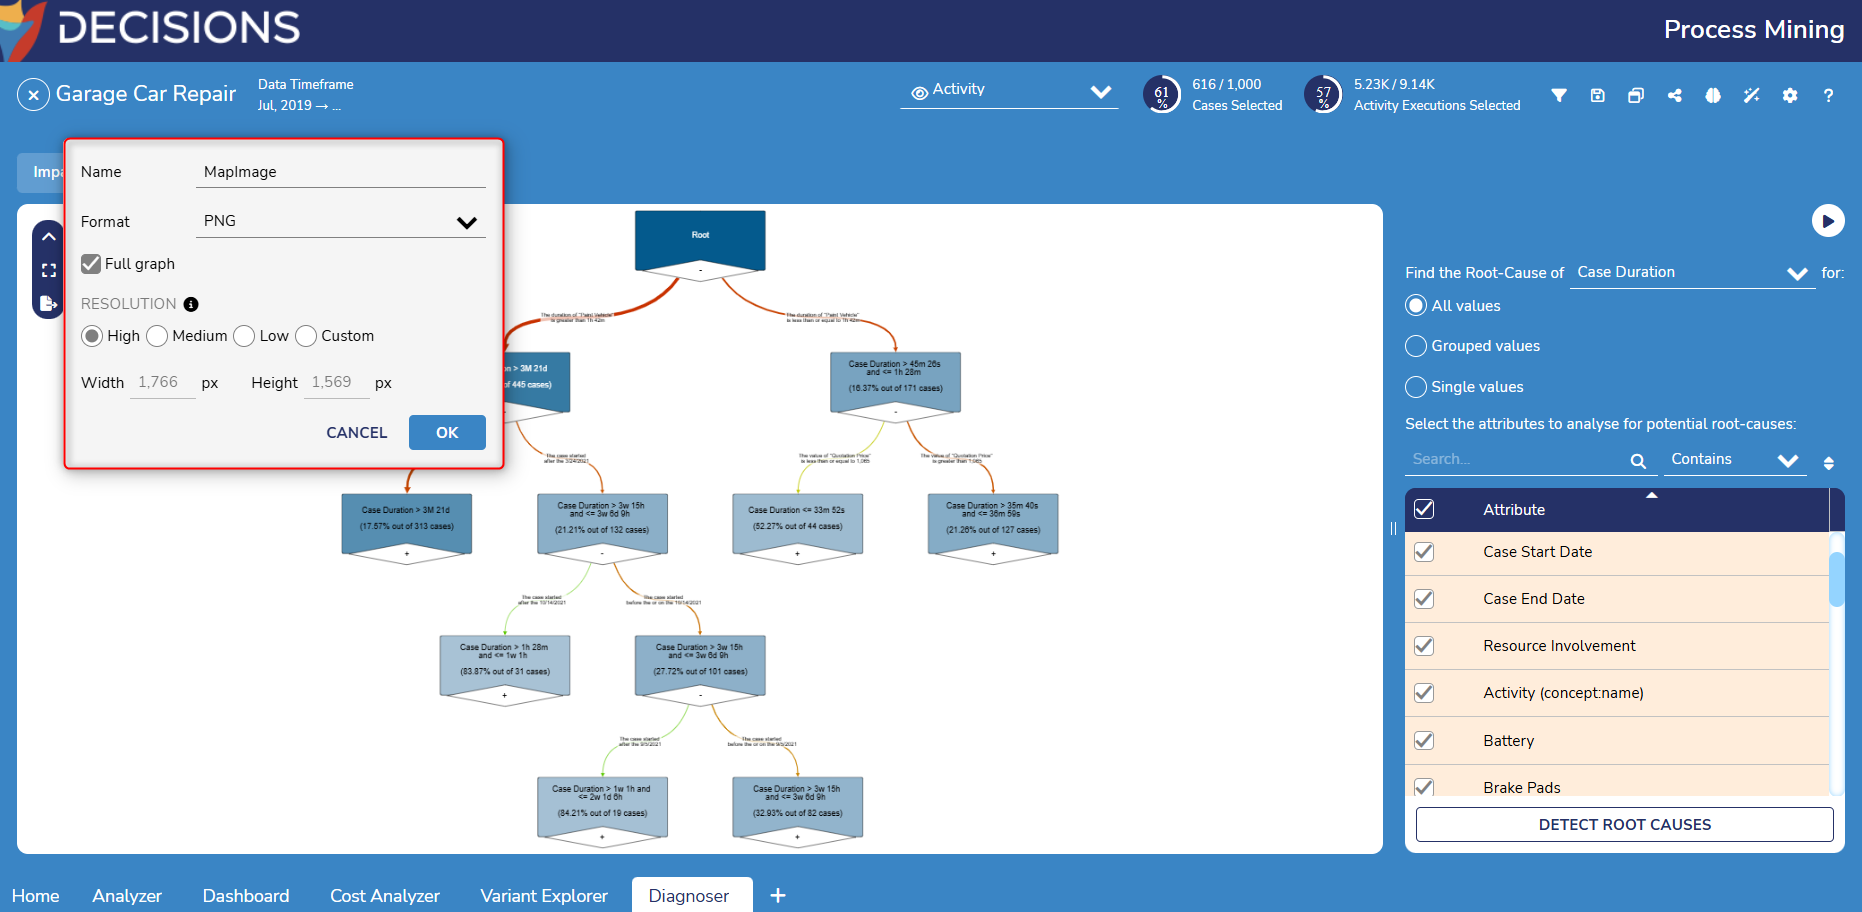
Downloading the Root-Cause Diagram
At the top left of the diagram window, expanding the selection menu offers Users the option to download the root-cause analysis diagram as either a PNG or JPG image file, similar to a Process Map.
Feature Changes
| Description | Version | Release Date | Developer Task |
|---|---|---|---|
| The Root Cause Analyzer can now limit the analysis based on selected options: All, Grouped, or Single Values. | 3.0 | April 2024 | [DT-039610] |