Overview
The Cost Analyzer allows Users to view process costs, how they are distributed across each activity, and which resources are more or less costly.
Resources are automatically populated based on the event log. A common use case involves entering the names of team members to analyze efficiencies and inefficiencies as a whole and individually.
Cost Analyzer Layout
| Section Number | Section Name | Function |
|---|---|---|
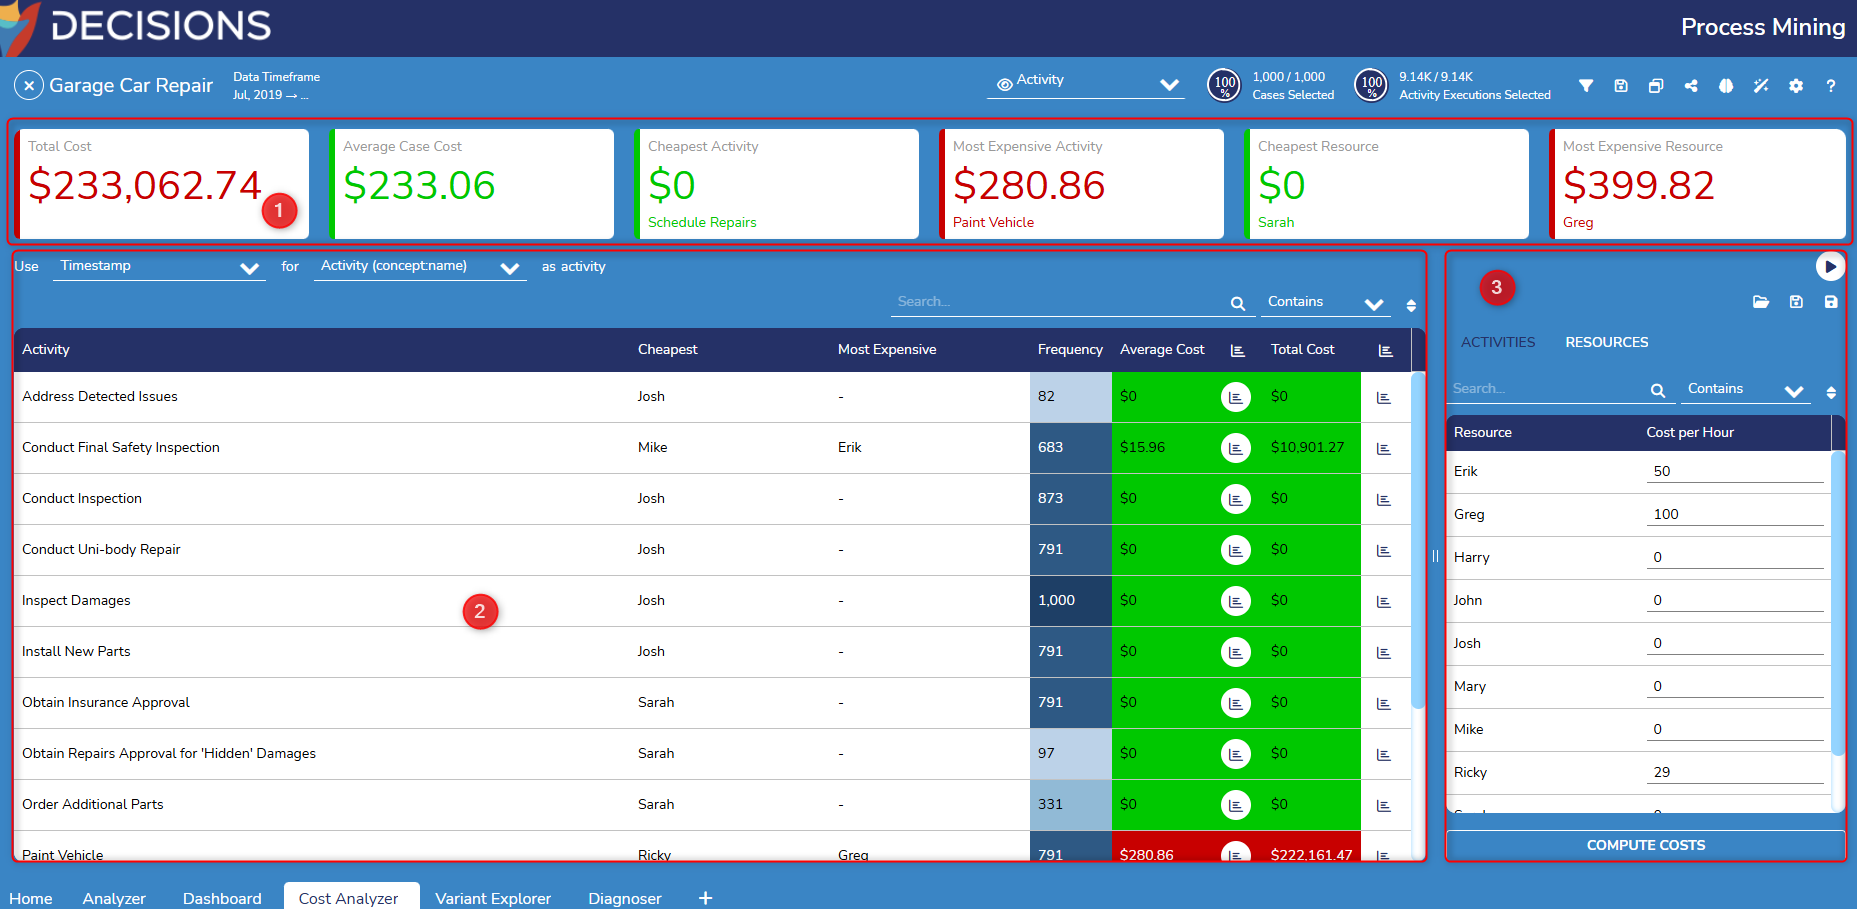
| 1 | Cost KPI Bar | Displays KPIs such as total cost, average Case cost, cheapest and most expensive activity, and cheapest and most expensive resource as tiles of varying color gradient between green and red. A green tile denotes values at or below the average cost, while red denotes costs remarkably above the average cost. Colors such as yellow and orange signify higher-than-average costs, but not the highest. For activity and resource KPIs, the specific activity/resource's name is listed below the value. |
| 2 | Activity Table | Lists every activity present across all executions in the event log. Displays columns such as the activity's cheapest and most expensive resource, its frequency, average, and total cost. Frequency, Average Cost, and Total Cost columns are color-coded. The Average Cost and Total Cost columns adopt the same coloring meaning as the Cost KPI Bar. Regarding Frequency, the darker blues represent higher frequency. Clicking on a column header allows the user to sort the Table by that column's value in either ascending or descending order. |
| 3 | Resources/Activities Table | Displays every activity or resource found in the event log, depending on which tab is selected. Users can provide an amount in the Fix Costs (for Activities only) and Cost per Hour number boxes before selecting Compute Costs. Fixed Cost for Activity refers to costs that are constant regardless of the number of instances or cases of the activity being executed. These costs do not change with the volume of work completed but instead incur each time the activity is performed. Entered costs may be saved and loaded into a different Cost Analyzer by using the save and load icons above Resources/Activities. |
Computing Costs
The following example configures and examines the costs of each employee within the pre-built Garage Car Repair event log included after installation.
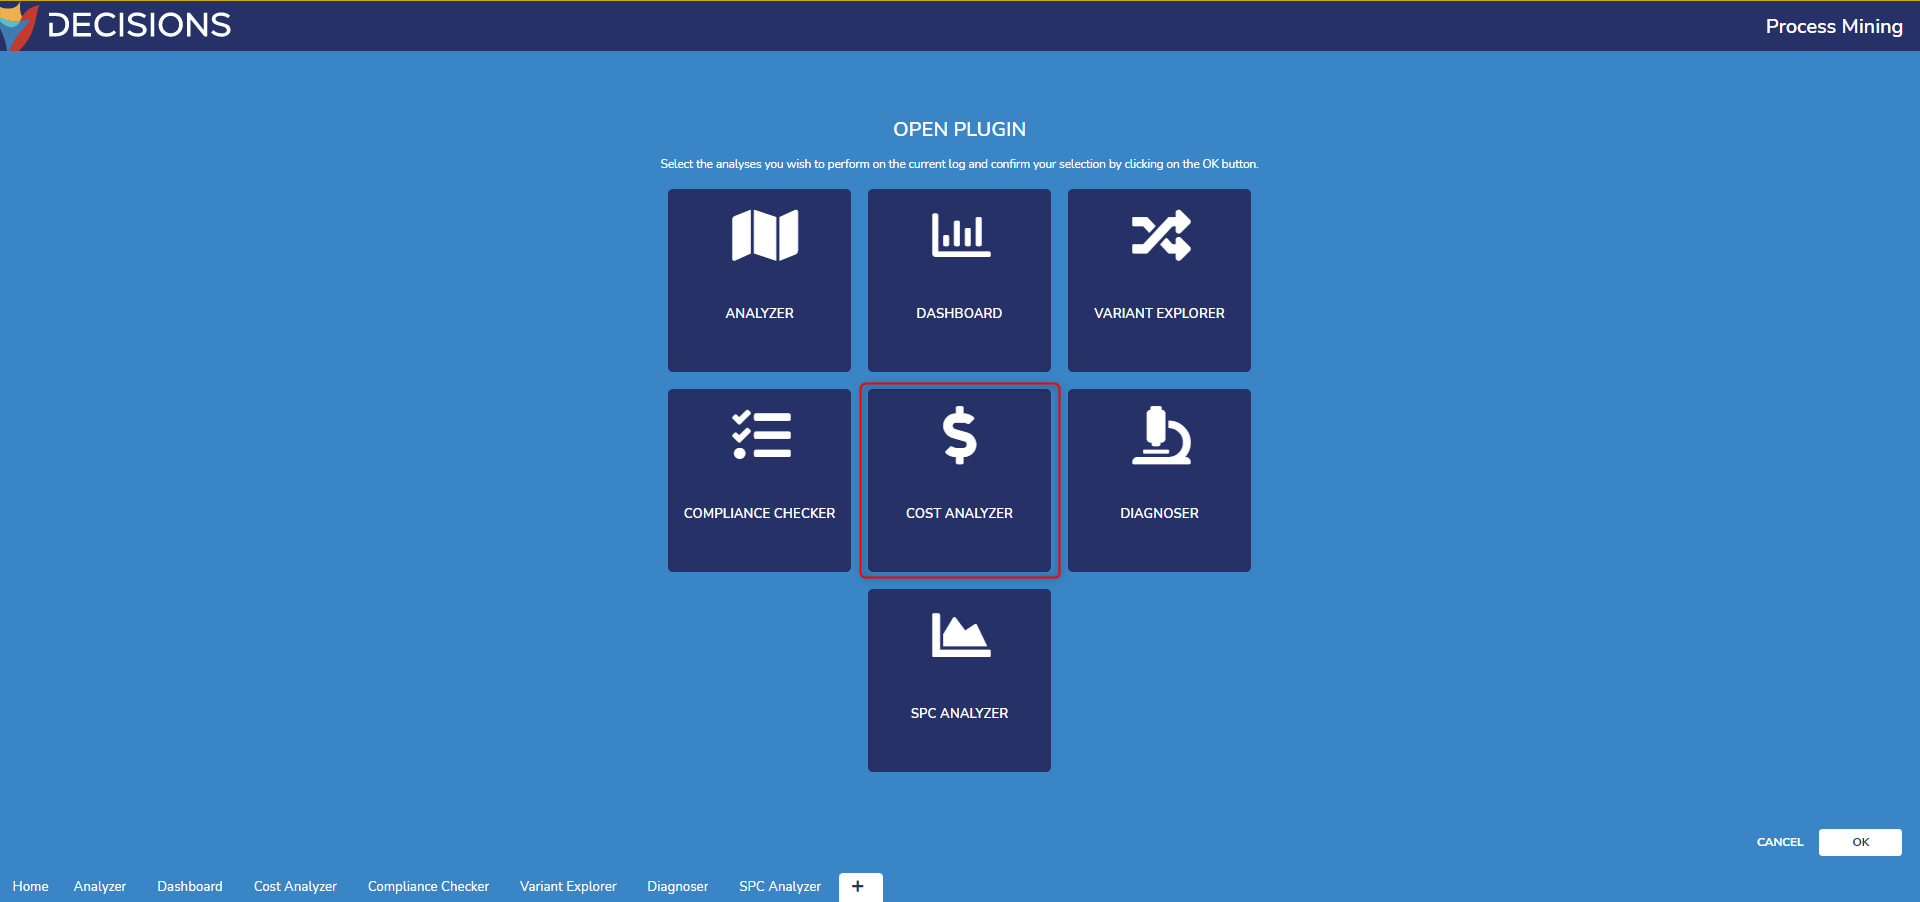
- To access the Cost Analyzer, open the Garage Car Repair event log. Create a new page by selecting the plus icon at the bottom of the screen. From there, select the Cost Analyzer.
- In the Cost Analyzer, view the Activities/Resources Table on the right. Provide example Costs per Hour for each of the names in the left column.
Once complete, select Compute Costs to regenerate the Cost Analyzer with new values.
Notice the Activity Table and the Cost KPI bar change. Each activity listed now displays its cheapest and most expensive resource as well as its average and total cost.(1).gif)
Users can also compute costs for Fix Costs associated with activities in the Event log by clicking on Activities next to Resources.
From here, input values into the Fix Costs fields. Users can also input values into the Cost per Hour column.
After the values have been added, select Compute Costs. The Activity Table and Cost KPI bar will reflect the new changes.
For the Prepare Estimates activity, select the graph icon to the right of the average value to view the average execution cost of the activity for each resource.
Each bar in the graph denotes a resource (in this case, an employee) who performed the activity, the count of how many times this activity was performed by that resource, and the average duration of that activity when performed by that resource.- Select the X icon on the top right to close the window.
- For the same Paint Vehicle activity, select the graph icon to the right of the Total Cost column to view a similar bar chart instead of accounting for all activity executions rather than the average.
- Select the X icon at the top right to close the window.

Configuring Activities
Users can select different attributes for an activity and set the duration.
To select an attribute for an activity:
- Click the Filter icon to open the Filter Log, then select Add Filter and select Attribute.
- From here, use the Drop-down menu to edit the following fields:
- Retain Only or Remove All
- Cases or Events
- For Which or In Which
- Type of Attribute
- Users can also choose which values to select for the chosen attribute using the checkboxes.
- Once the desired values are selected, click Apply to set the new attribute.
.gif)
- Once the desired values are selected, click Apply to set the new attribute.
- From here, use the Drop-down menu to edit the following fields:
- Users can set the duration of the activity by using the Dropdown menu next to duration.

Feature Changes
| Description | Version | Release Date | Developer Task |
|---|---|---|---|
| The Cost Analyzer has the ability to select different attributes for the activity, as well as the duration of the activity. | 3.1 | July 2024 | [DT-040977] |
| The Cost Analyzer now supports fixed and hourly costs for activities within a process. | 3.4 | January 2025 | [DT-042644] |