Overview
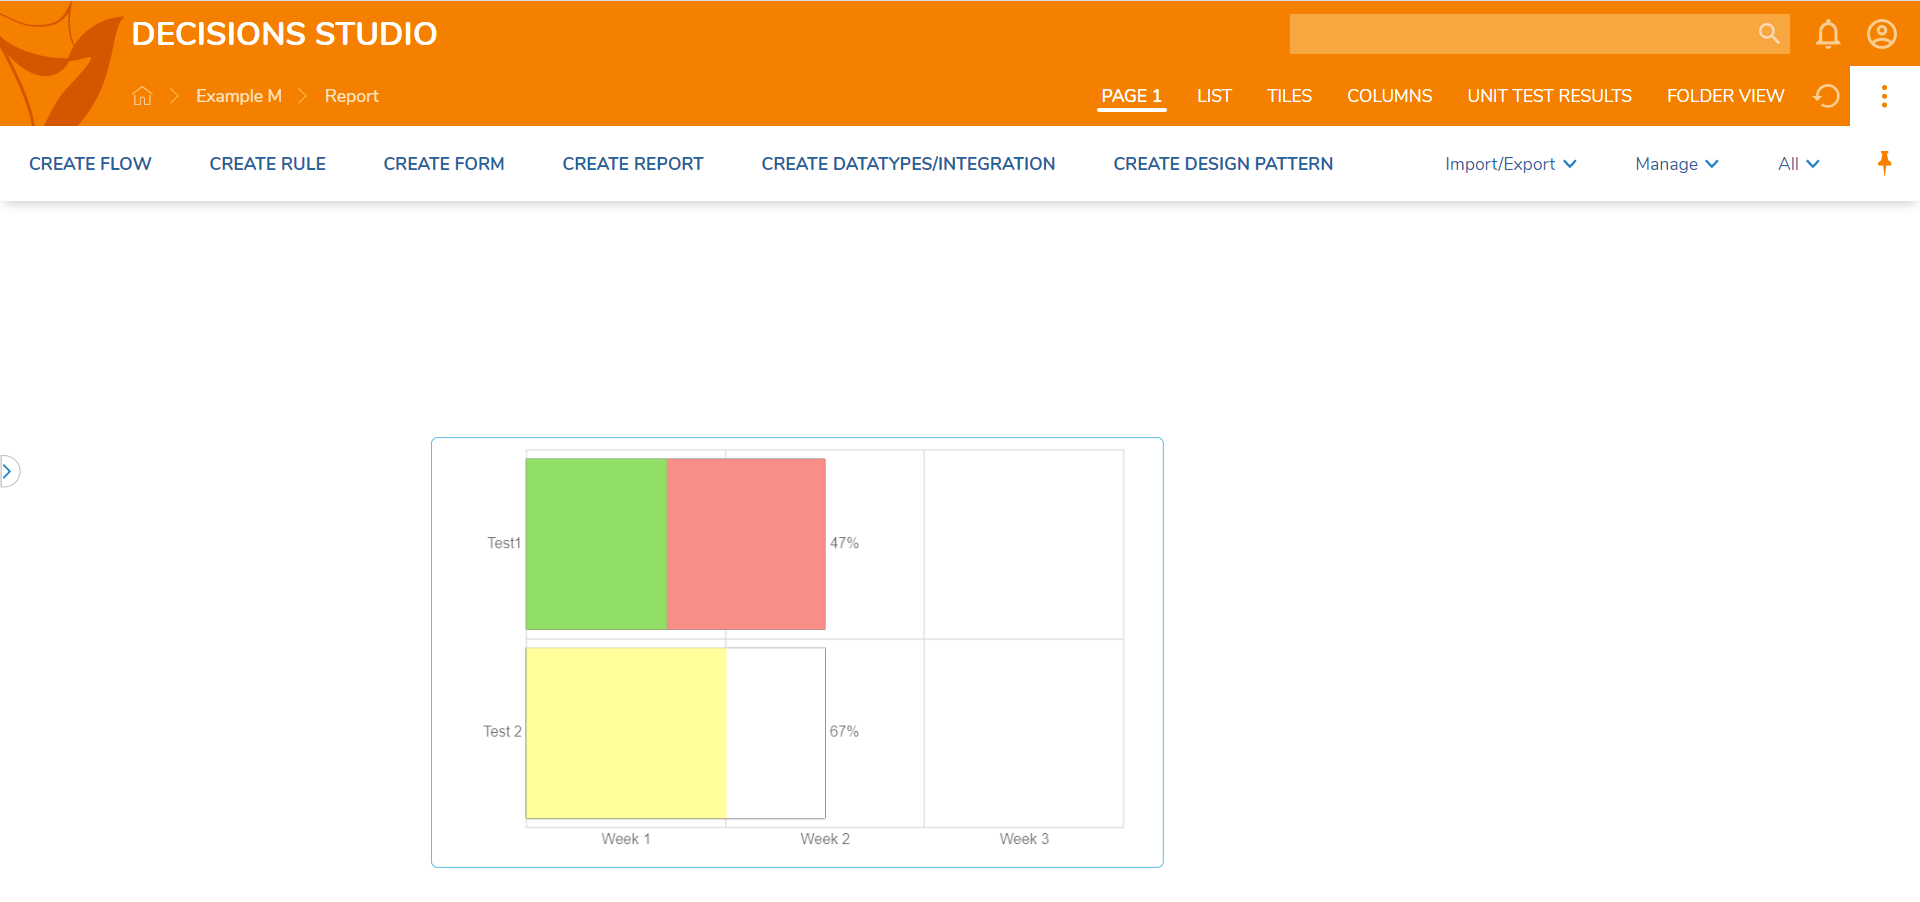
Gantt Charts are a type of horizontal bar graph used in managing projects, keeping track of time spent completing parts of a project, and the progress on each part. These charts can be easily implemented and configured as Diagram Tiles in Decisions to show customized data from the project on a Page or Dashboard.
Example
This example demonstrates how to create a Gantt Chart that can be viewed from a Page.
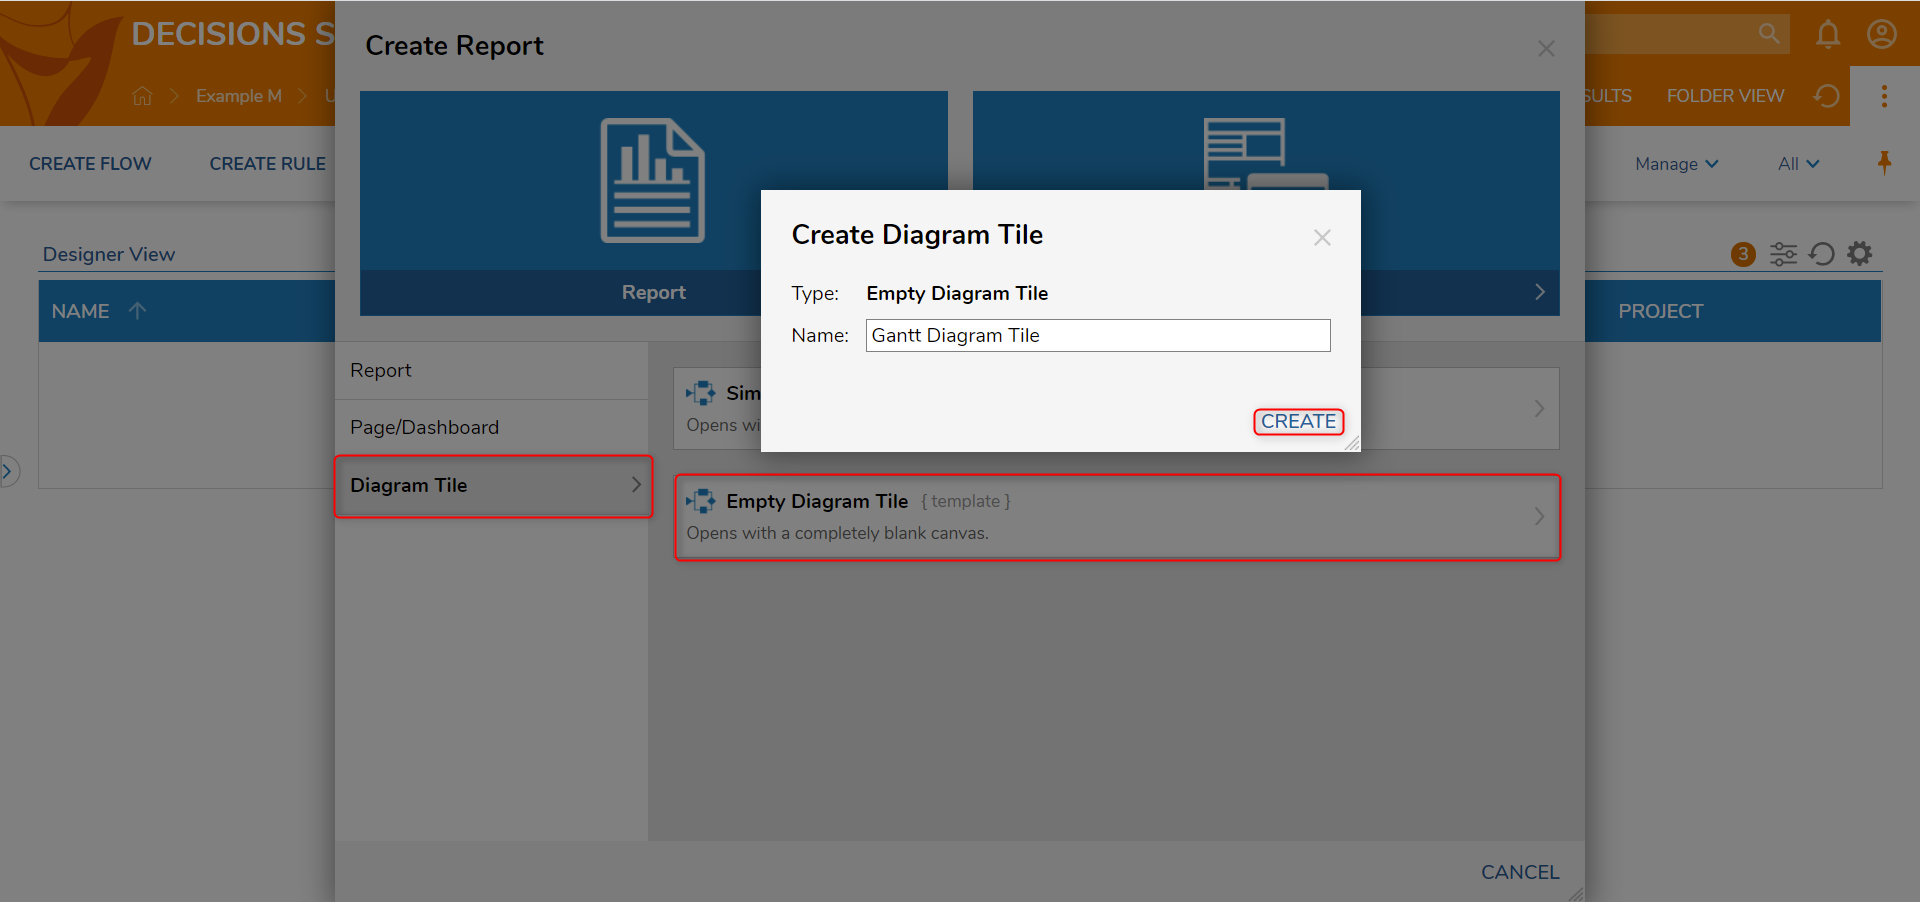
- In the Designer Project, click CREATE REPORT on the Global Action Bar and Diagram Tile. Select Empty Diagram Tile, name the Diagram Tile (Gantt Diagram Tile), and click CREATE.
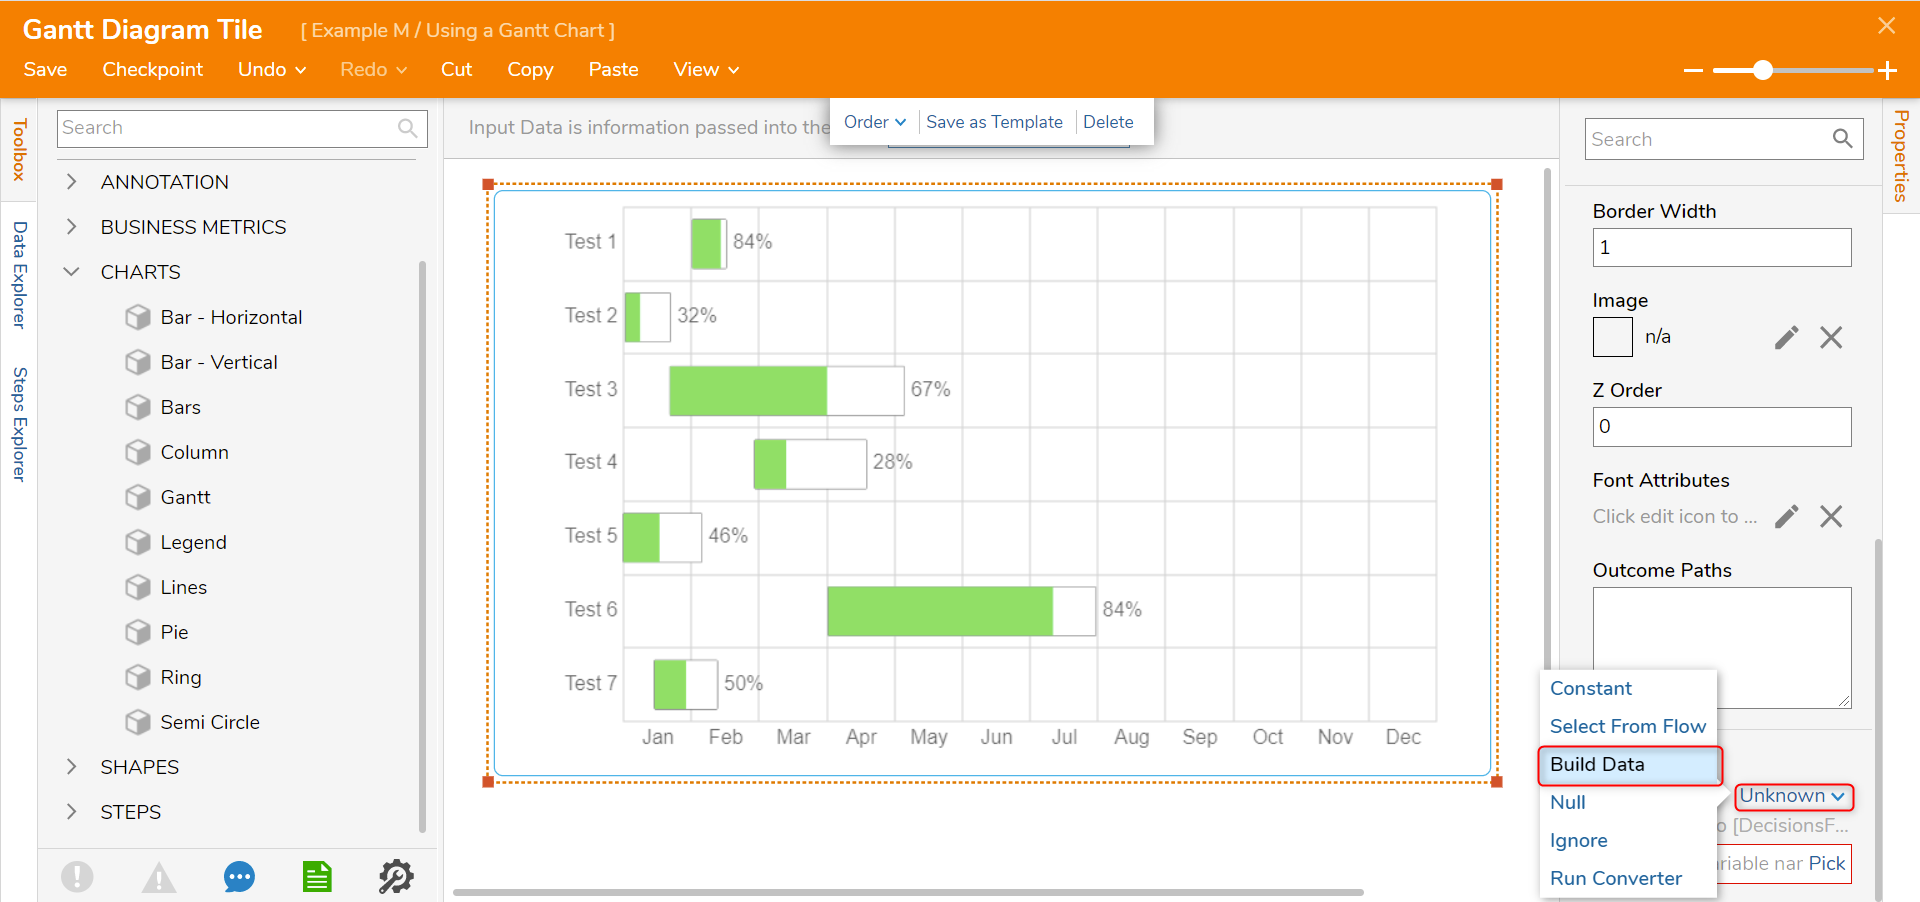
- In the Toolbox panel, drag the Gantt chart to the workspace under the CHARTS category. Then, expand the size.

- Given that Gantt Data is a composite data type, under the INPUTS category, select Unknown and click Build Data. These elements allow the user to set the various parameters visible in the chart.
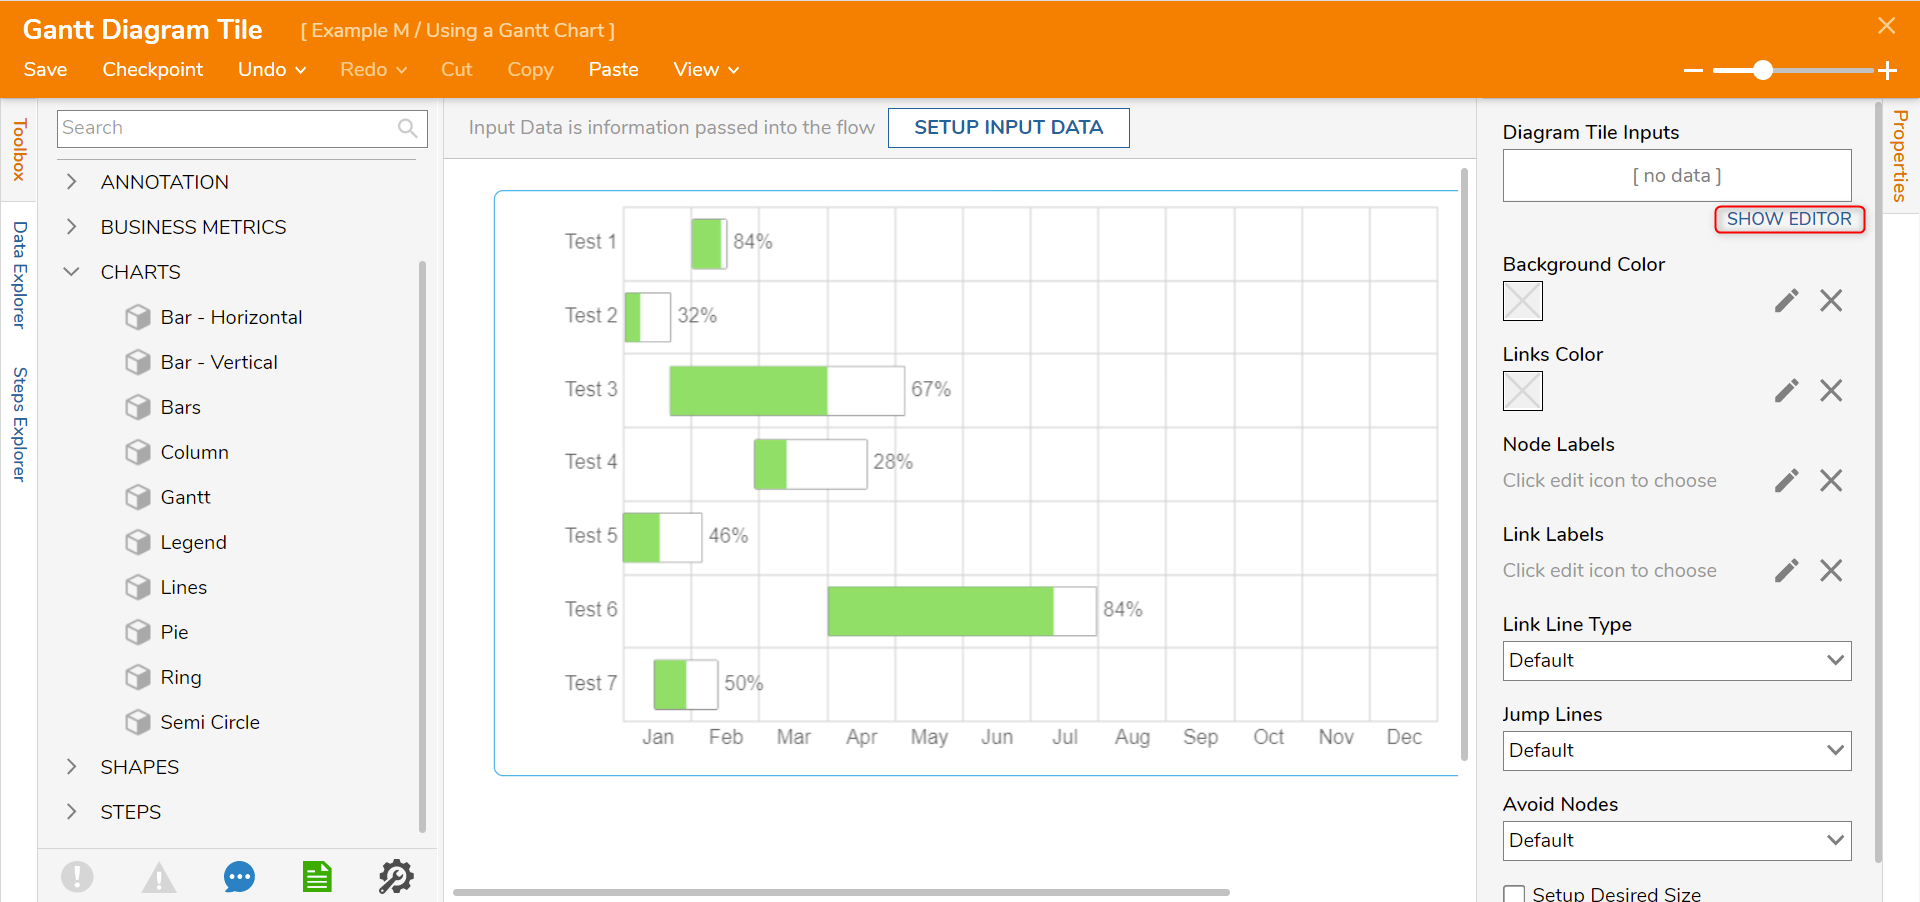
- Click the whitespace around the Gantt Chart and select the Diagram Tile Properties tab. Under Diagram Tile Inputs select SHOW EDITOR.
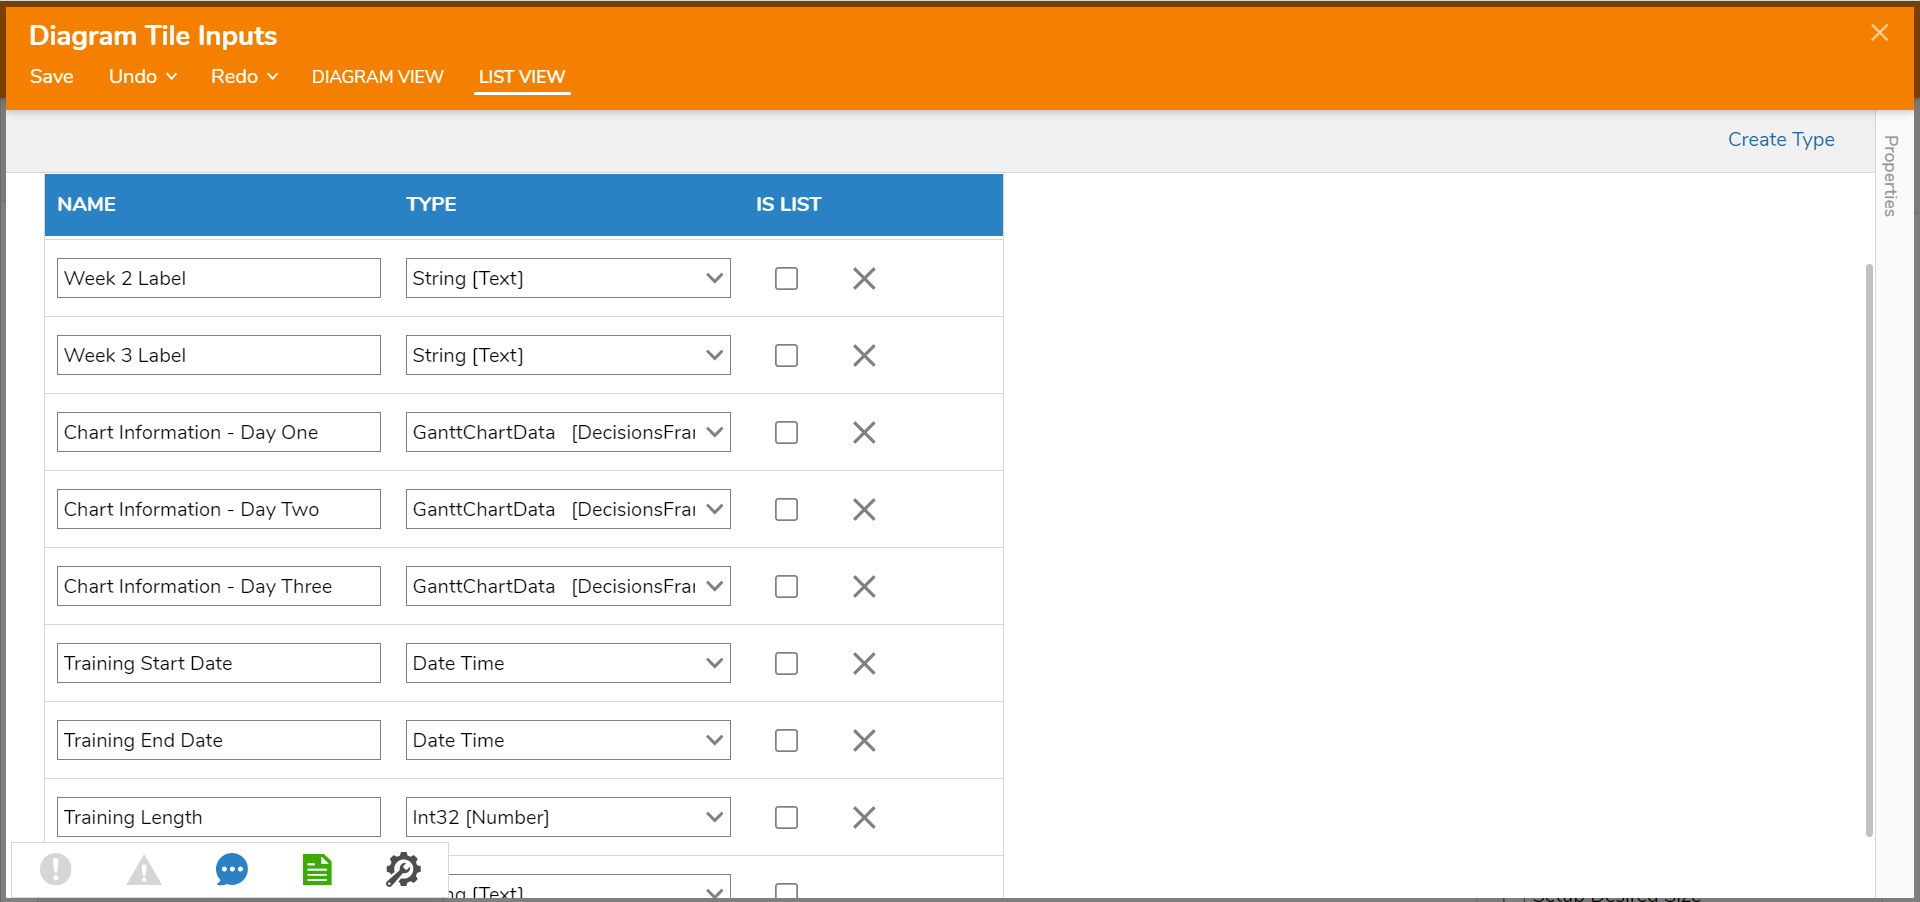
- Create three String [Text] inputs (Week 1 Label, Week 2 Label, Week 3 Label) that will denote the chart's time frame. Then, create three GanttChartData type inputs (Chart Information - Day One, Chart Information- Day Two, Chart Information - Day Three) for each training day. Create two Date Time fields (Training Start Date, Training End Date) and an Int32 [Number] field (Training Length). Then, click Save and close the Inputs Dialog window.
- Select the Gantt Chart. Under the INPUTS category, select Ignore next to Chart Data and click Build Array. Then, select Build Data for Item 0 field.

- Add the inputs to represent each test and Build Data for each one. Then, Constant map data relating to each value of the Chart Data, beginning with Duration.
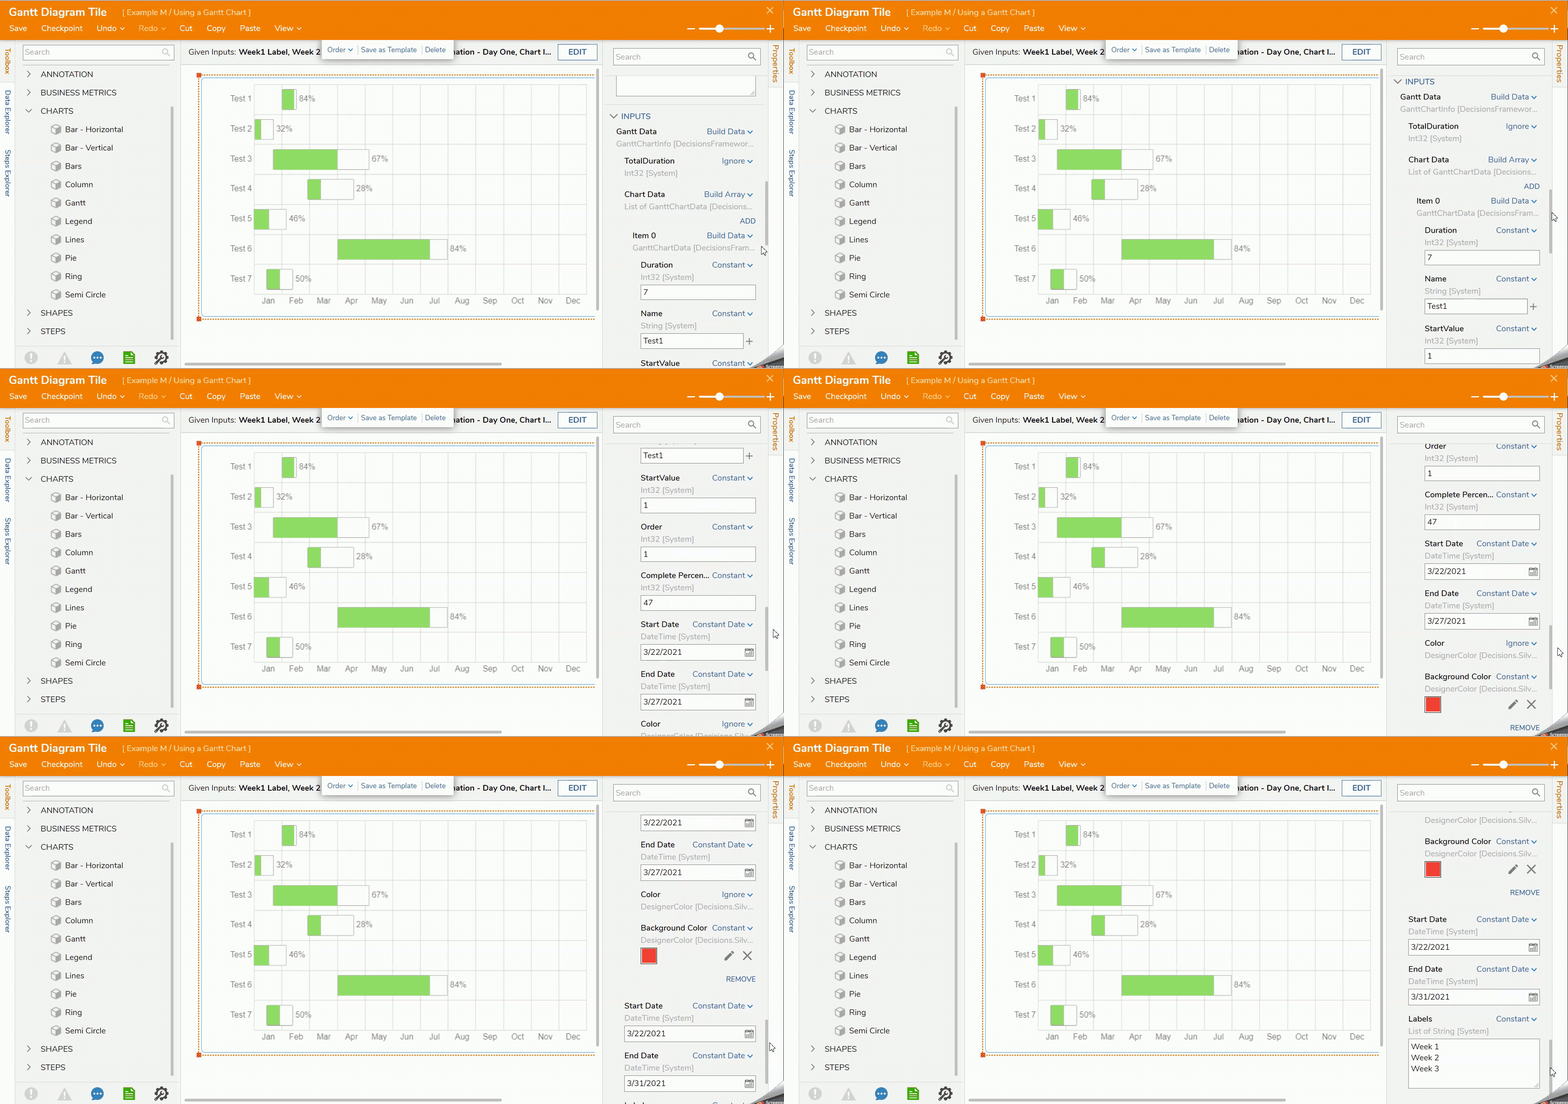
- After mapping the values, input constant dates to represent the beginning and end values of the chart.
- Click Save on the top action bar and close the Designer.
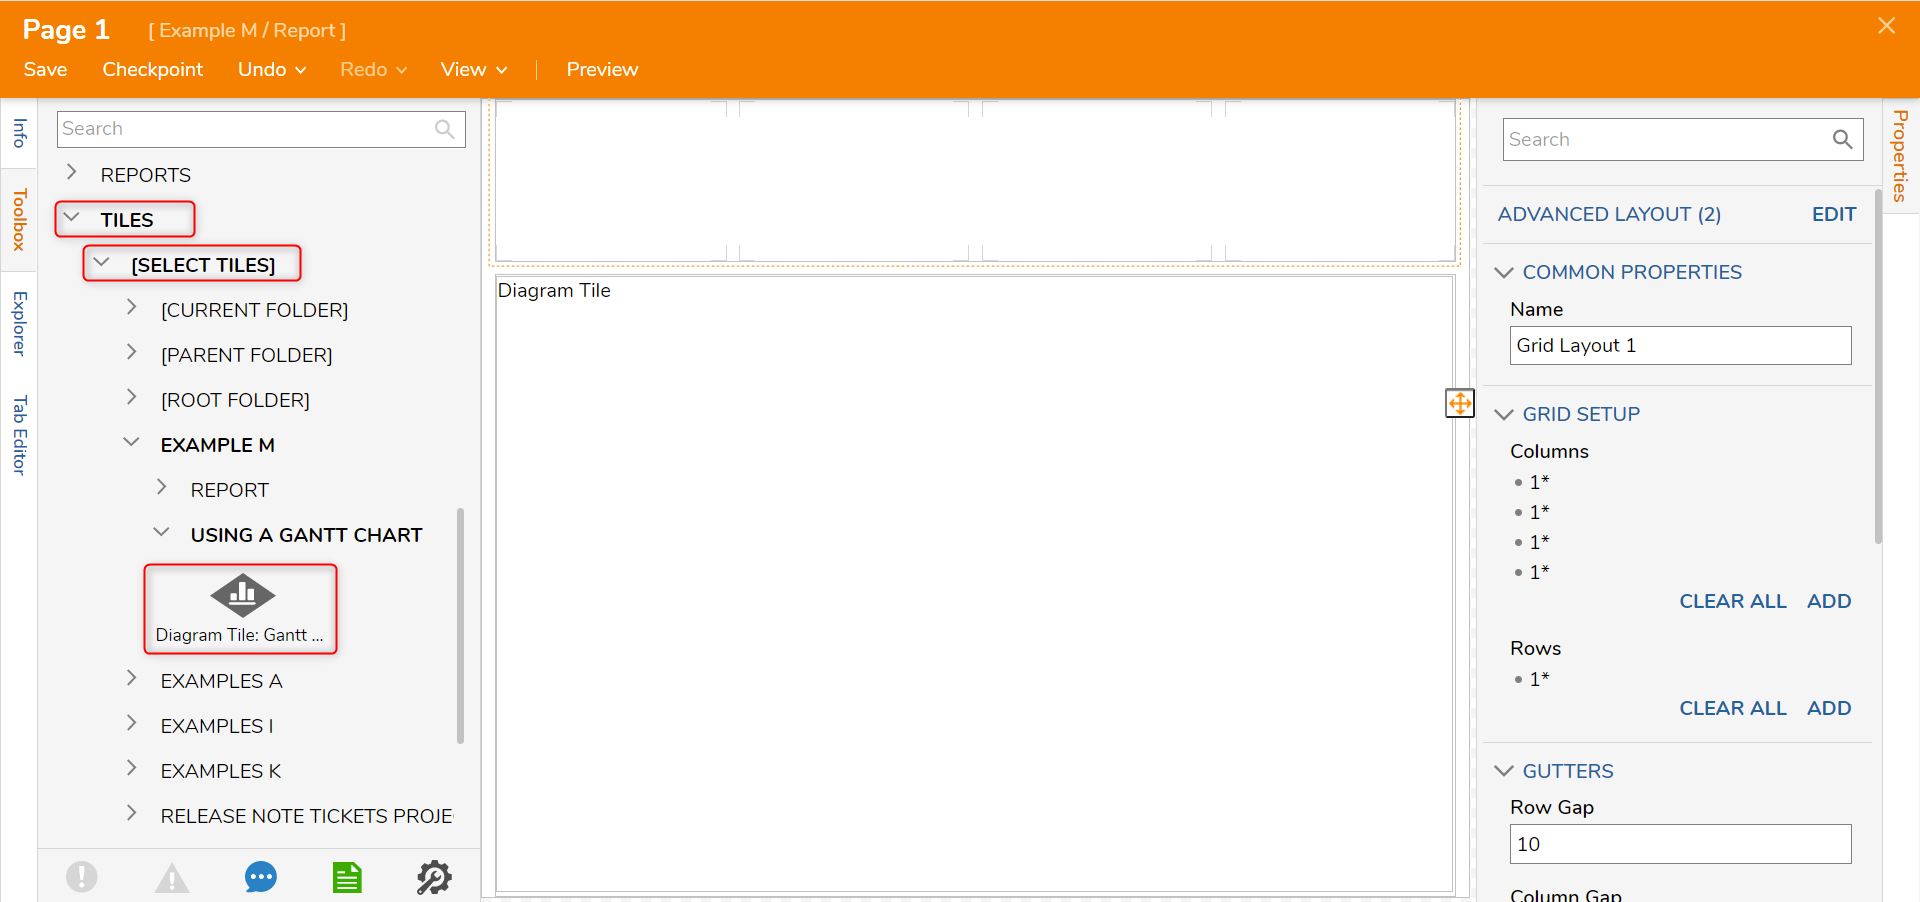
- Navigate to a Page to display the Gantt Chart. Navigate to Tiles > [SELECT TILES] > [Name of Designer Folder]. Then, drag and drop the step.
Debug
The Tile will display the Gantt Chart with the newly configured static data values on the Page.
A Gantt Chart can be dynamically populated with values using an input Flow.
