Overview
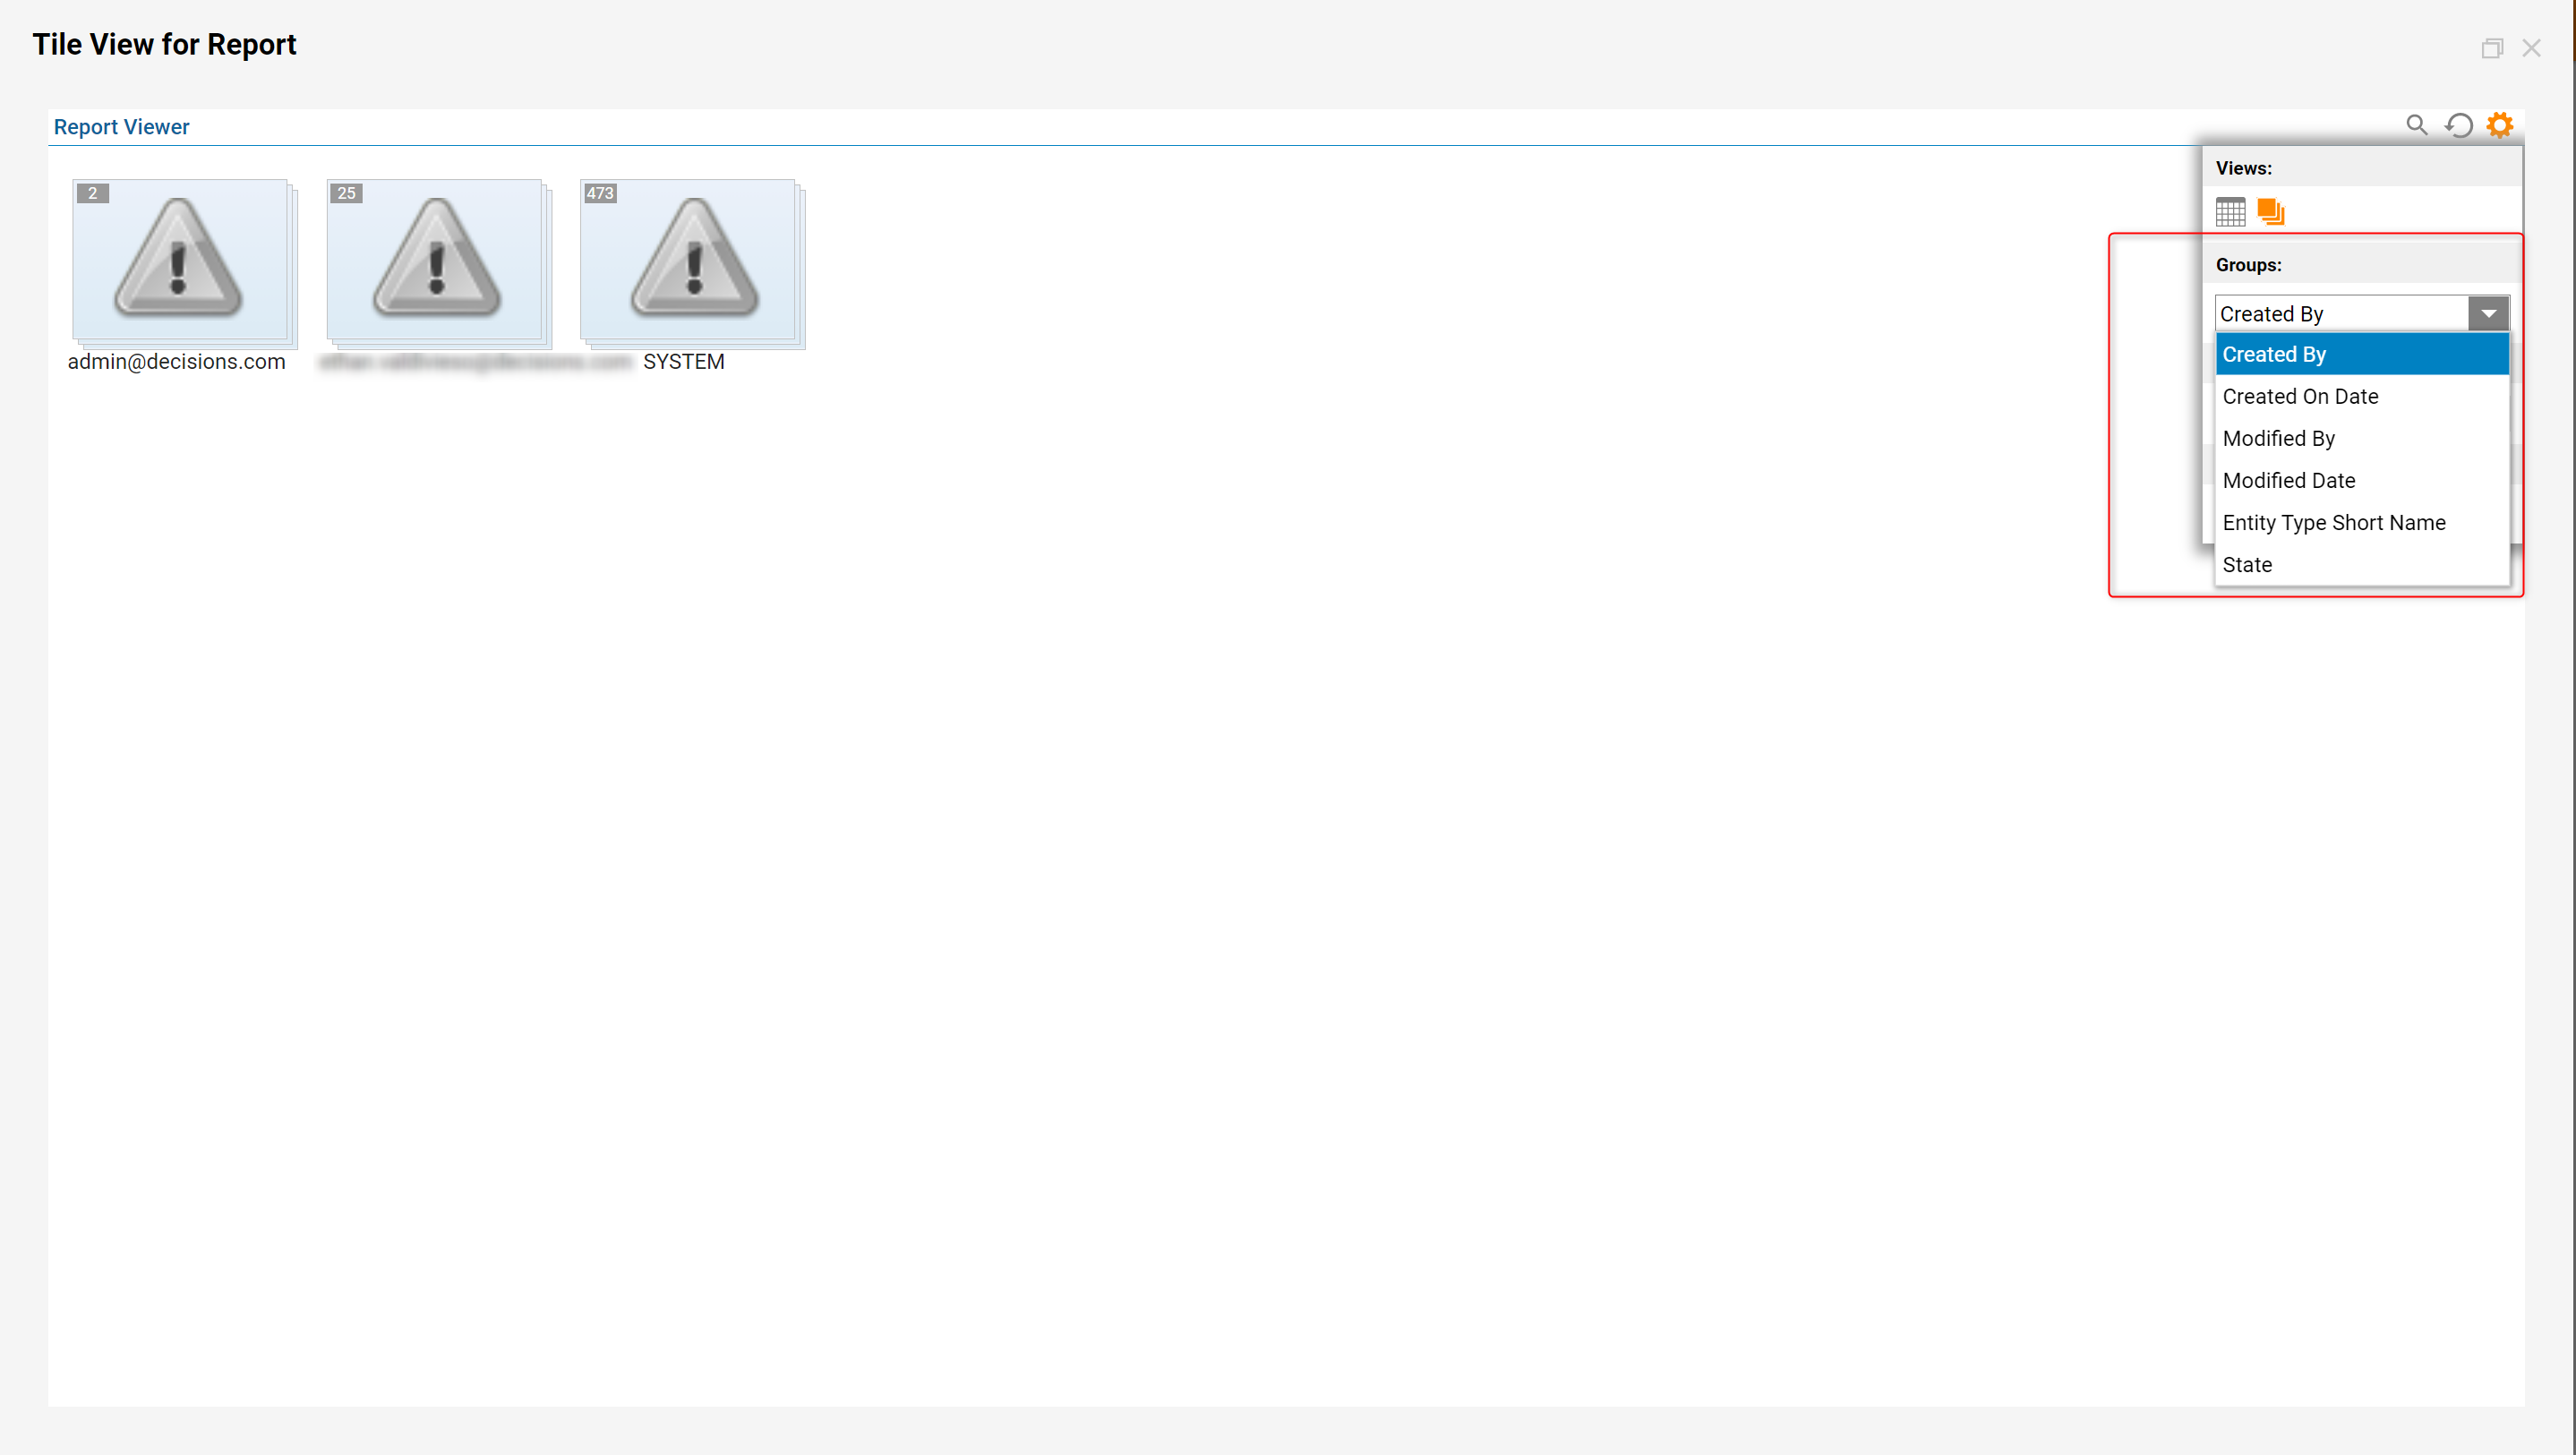
The Report Viewer can be configured to display Report information in a multitude of ways to give the user freedom to choose a view that is appropriate for the situation and information. Tile Mode is an easy-to-read way of grouping and viewing the information contained in the Report. In the following example, the user will create a new Report to display information in Tile mode and change the grouping within the Report.
Example
- To begin, navigate to a Designer Folder and select CREATE REPORT from the bottom action bar.
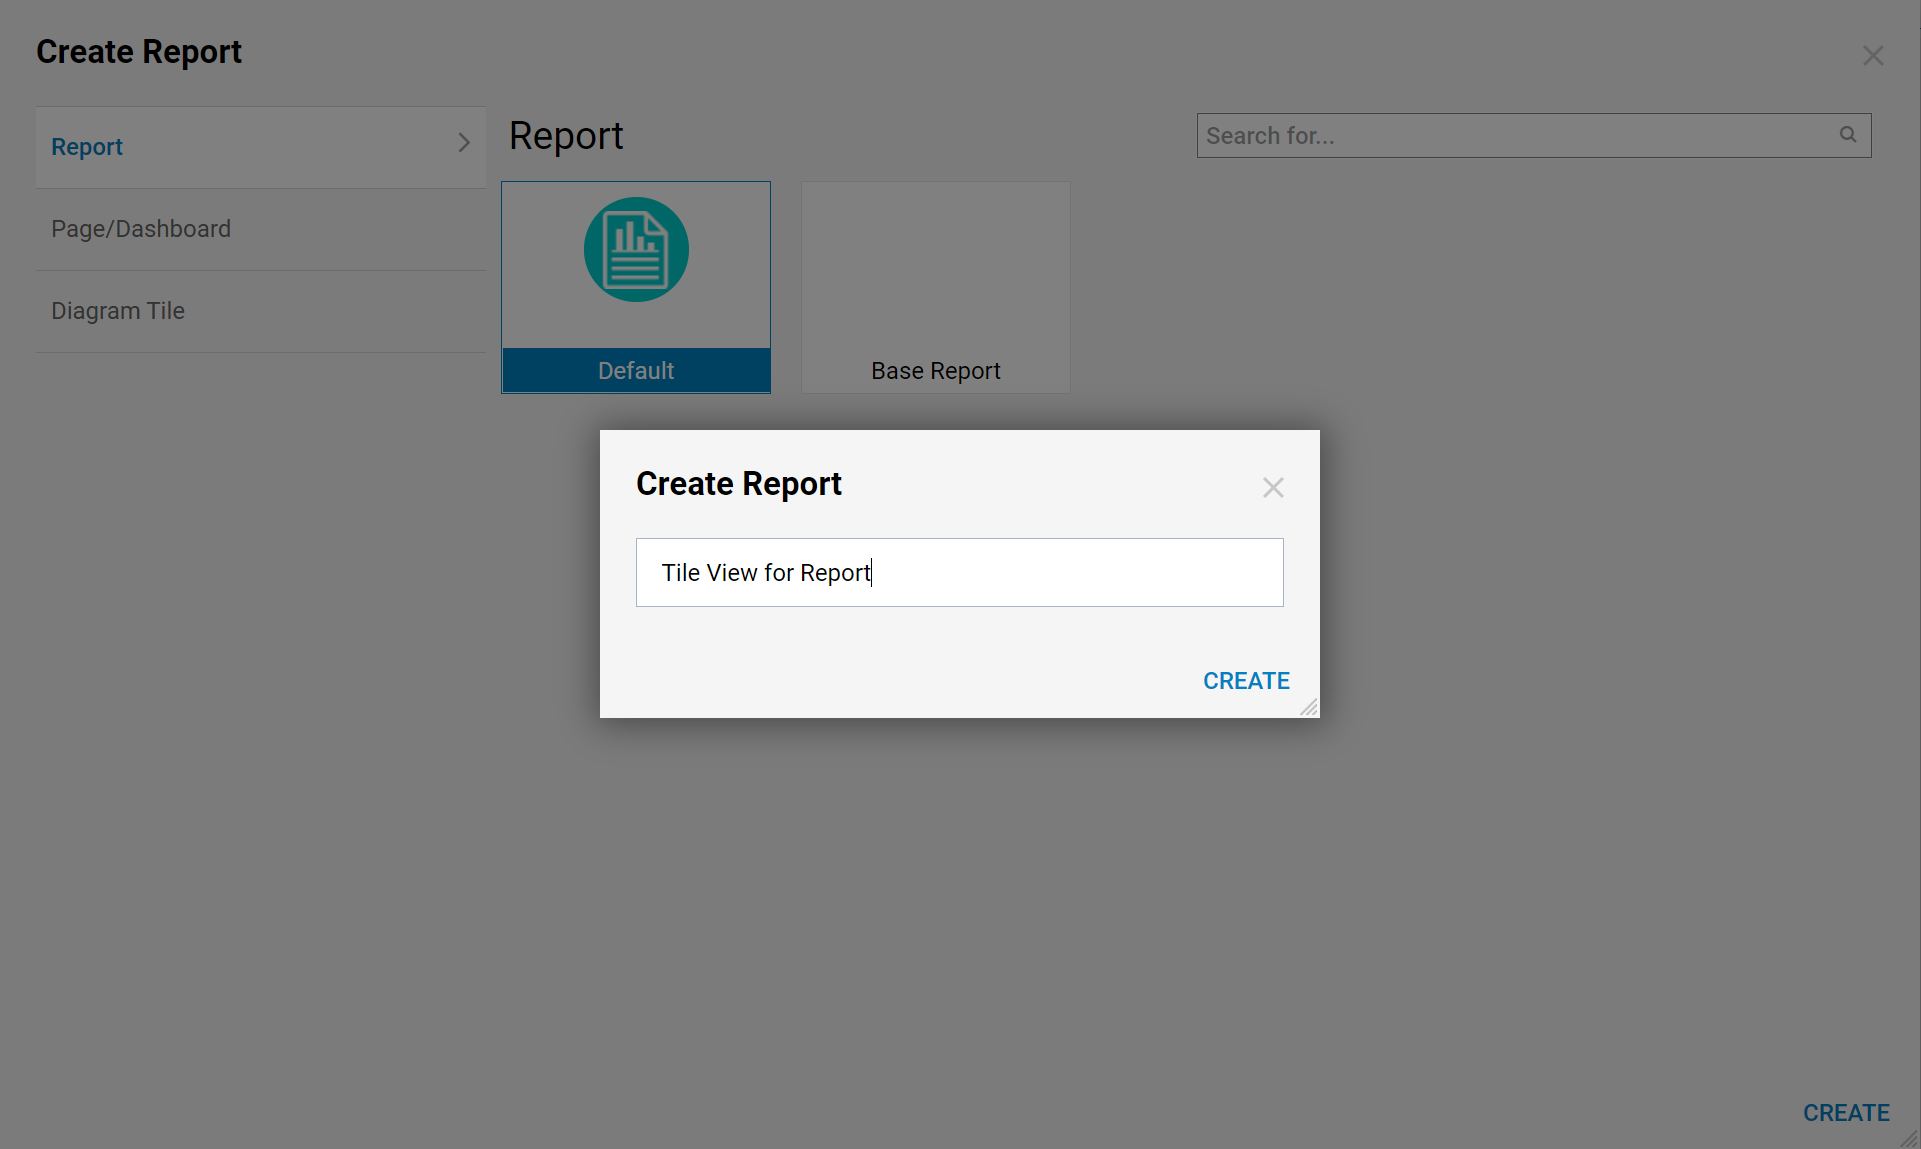
- In the Create Report window, select and name the default Report [Tile View for Report].
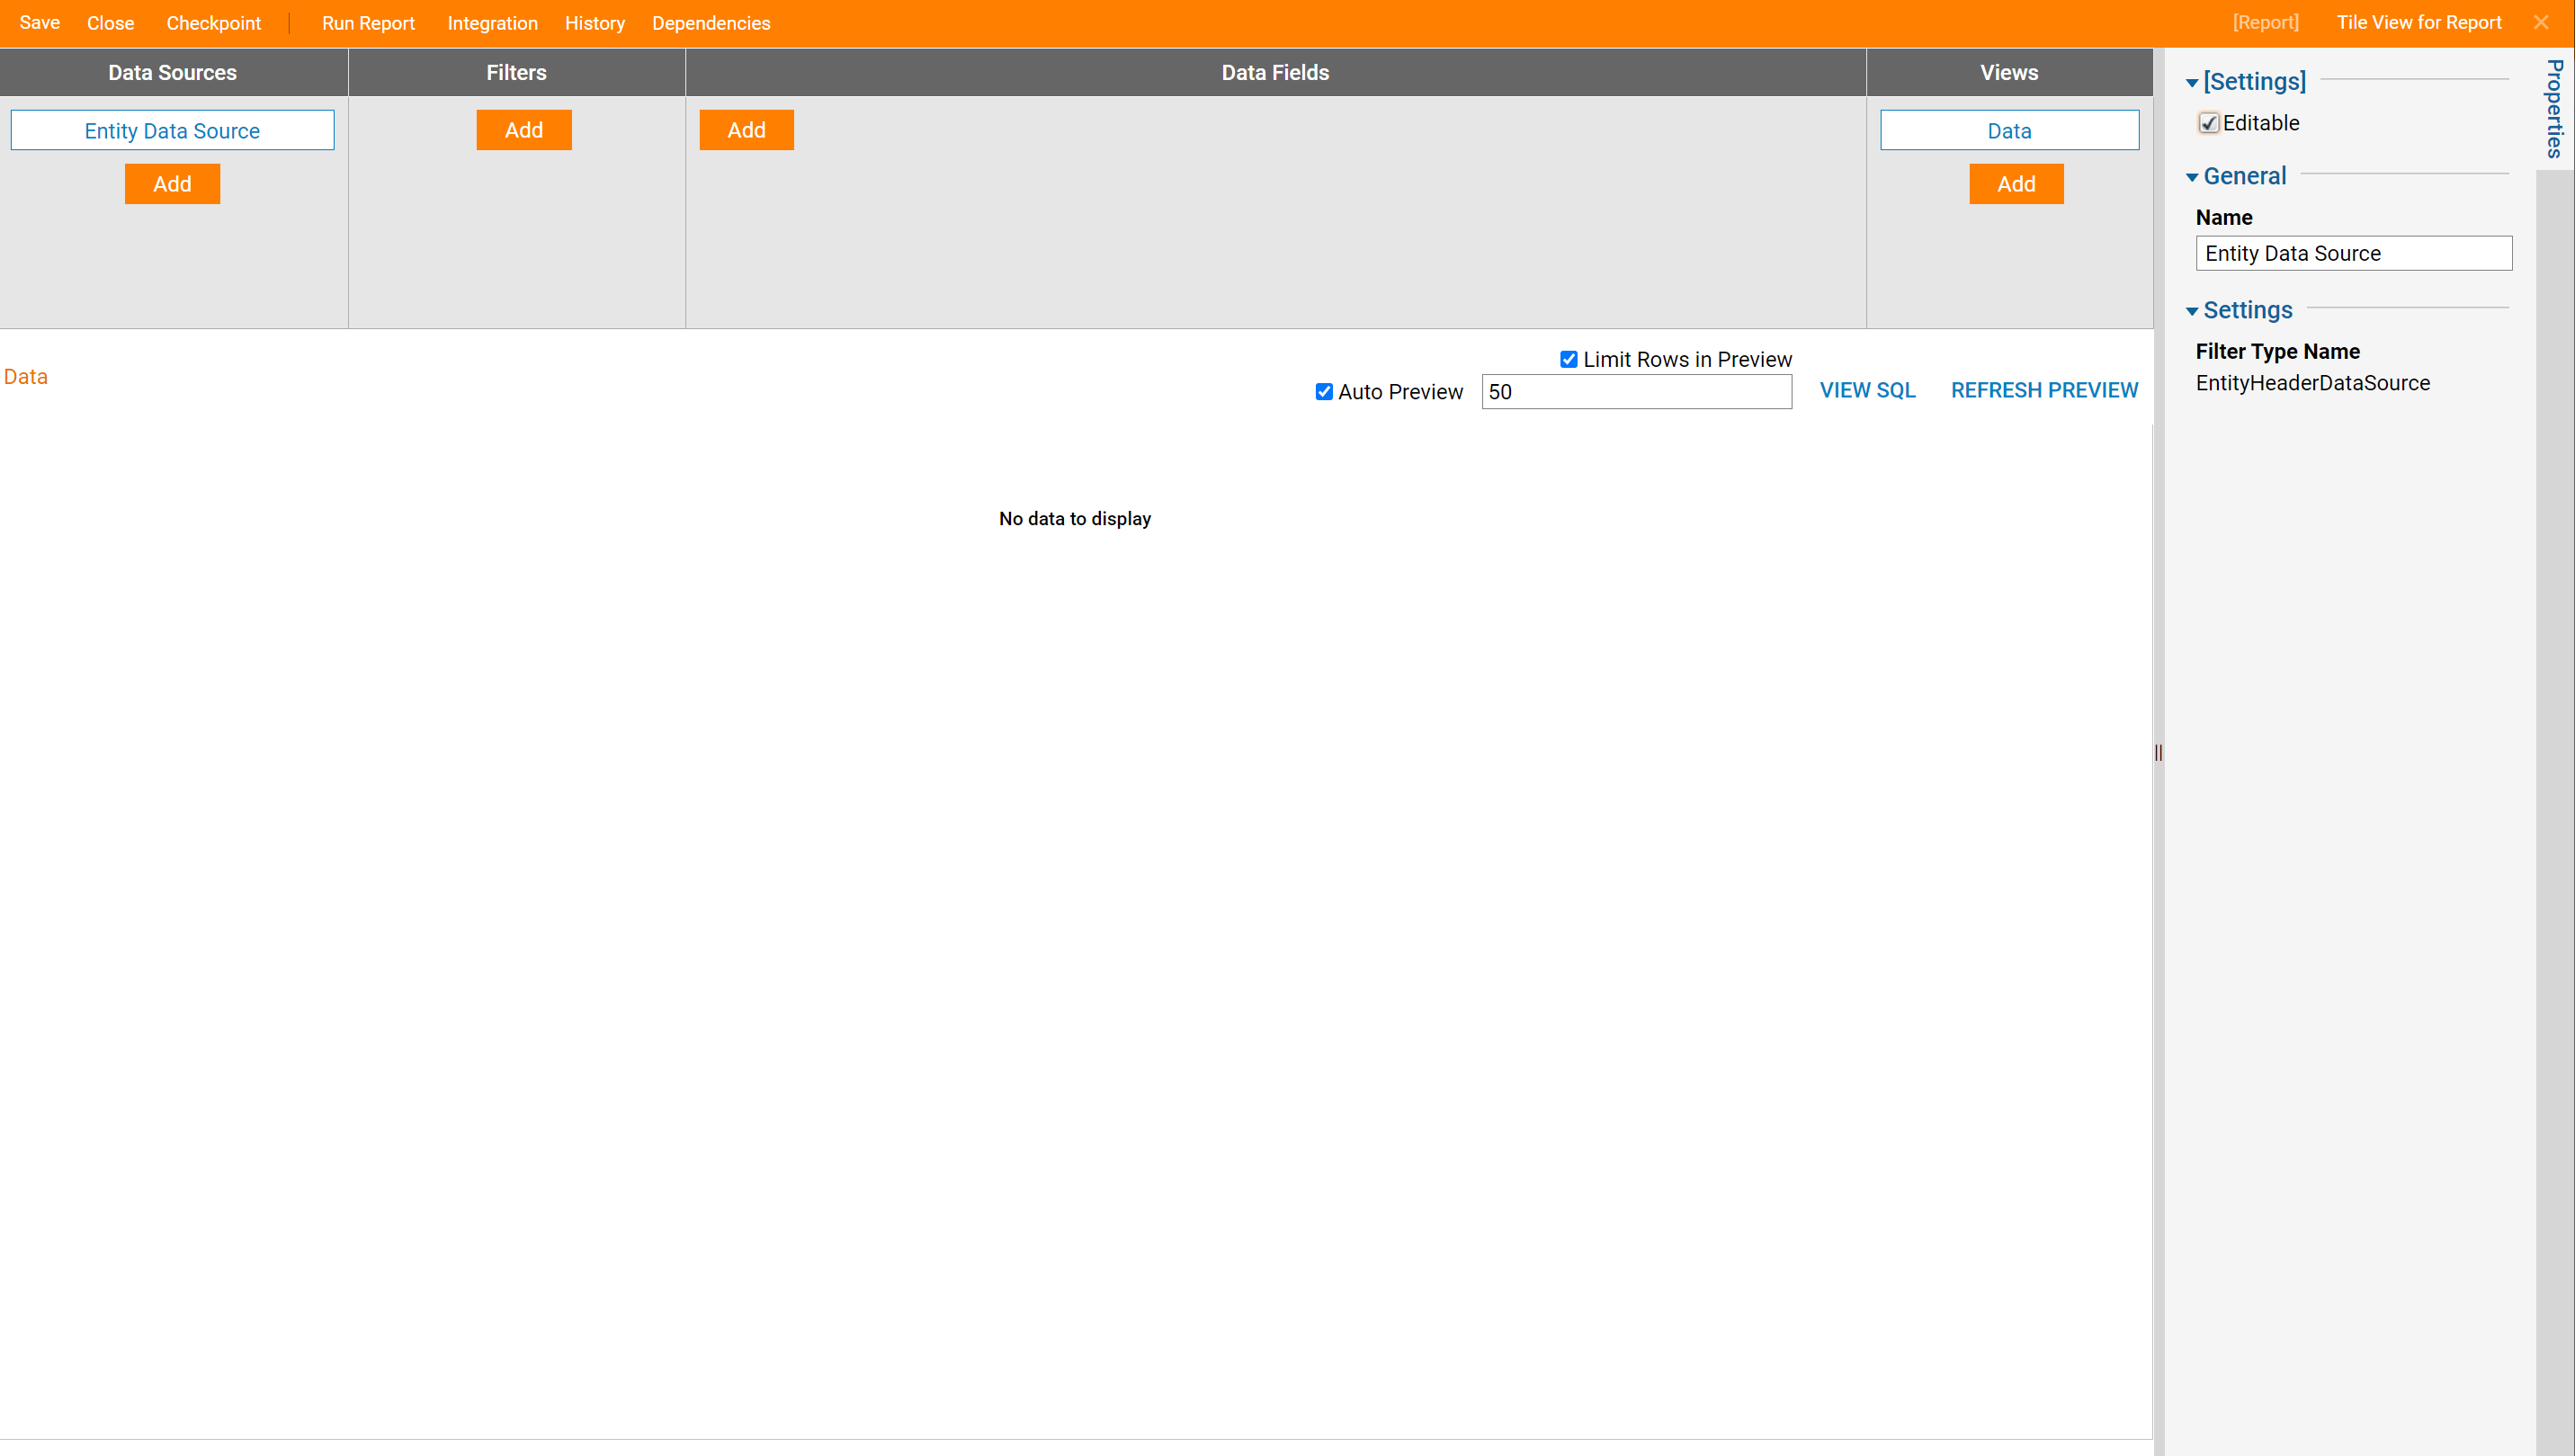
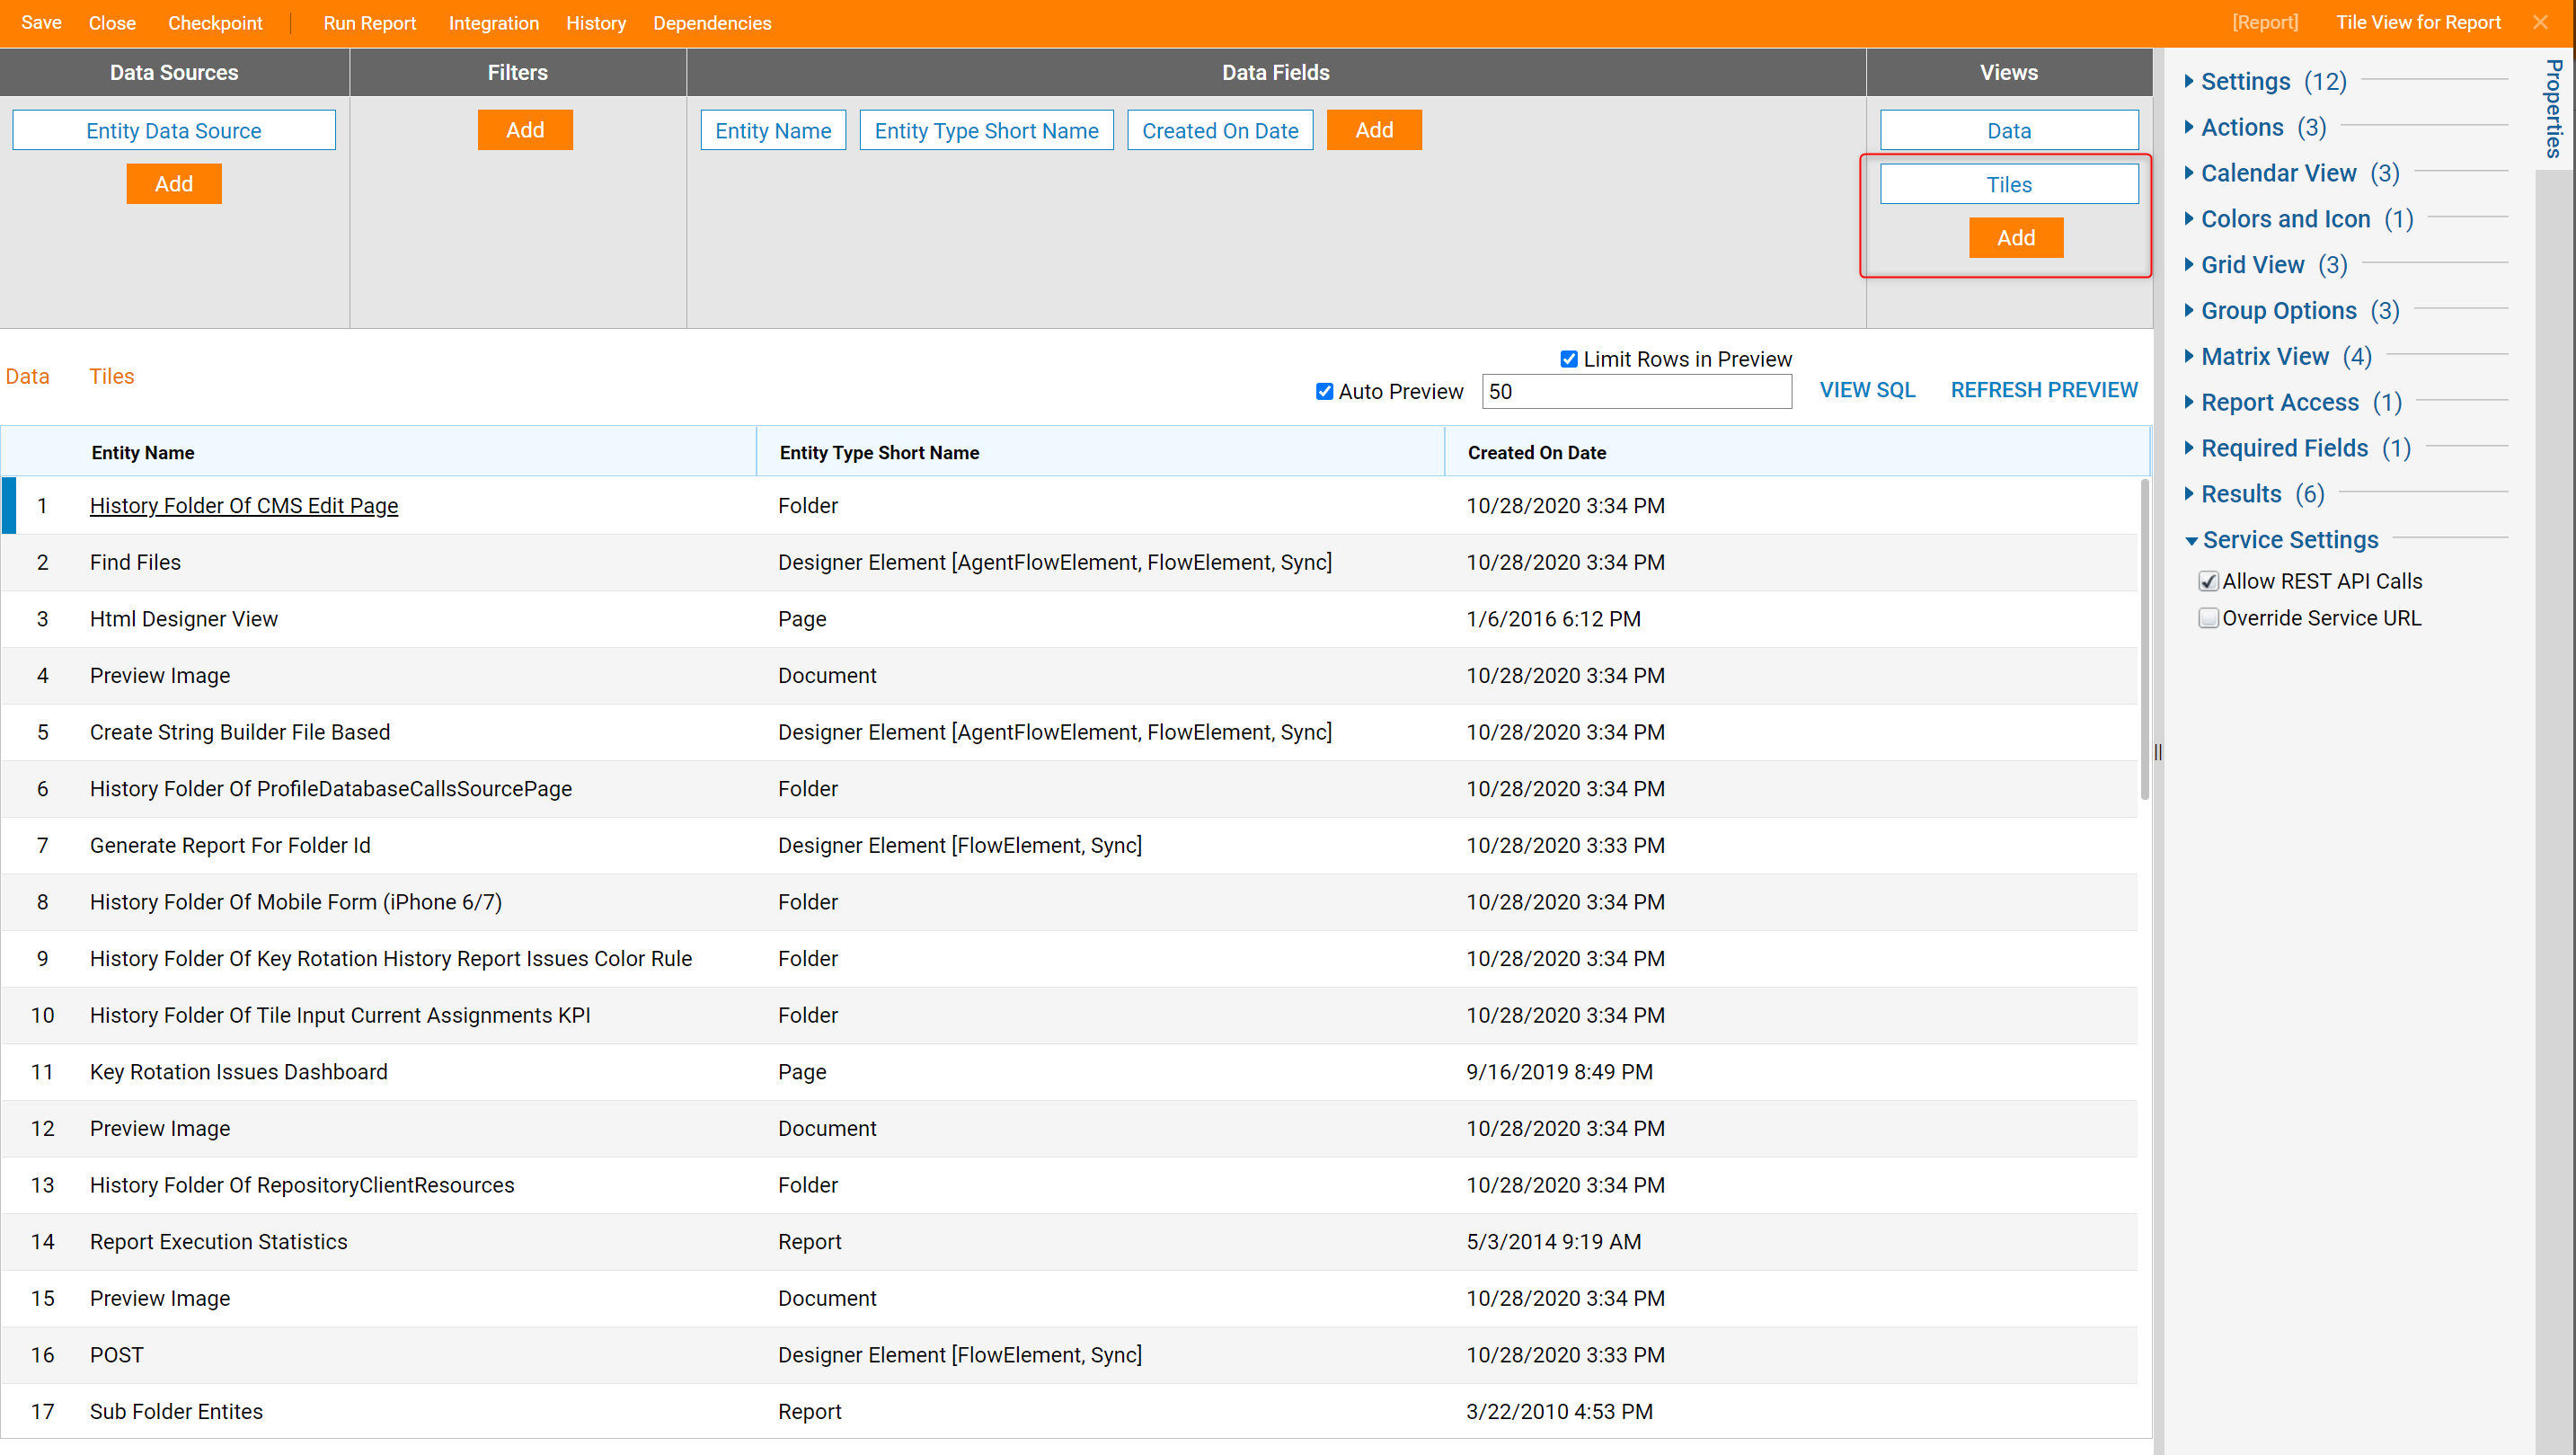
- In the Report Designer, navigate to the Data Sources section, select Add and expand the Data Sources > Common, and click Entity Data Source.
- Next, under Data Fields, click Add and select Entity Name, Entity Type Short Name, and Created On Date.
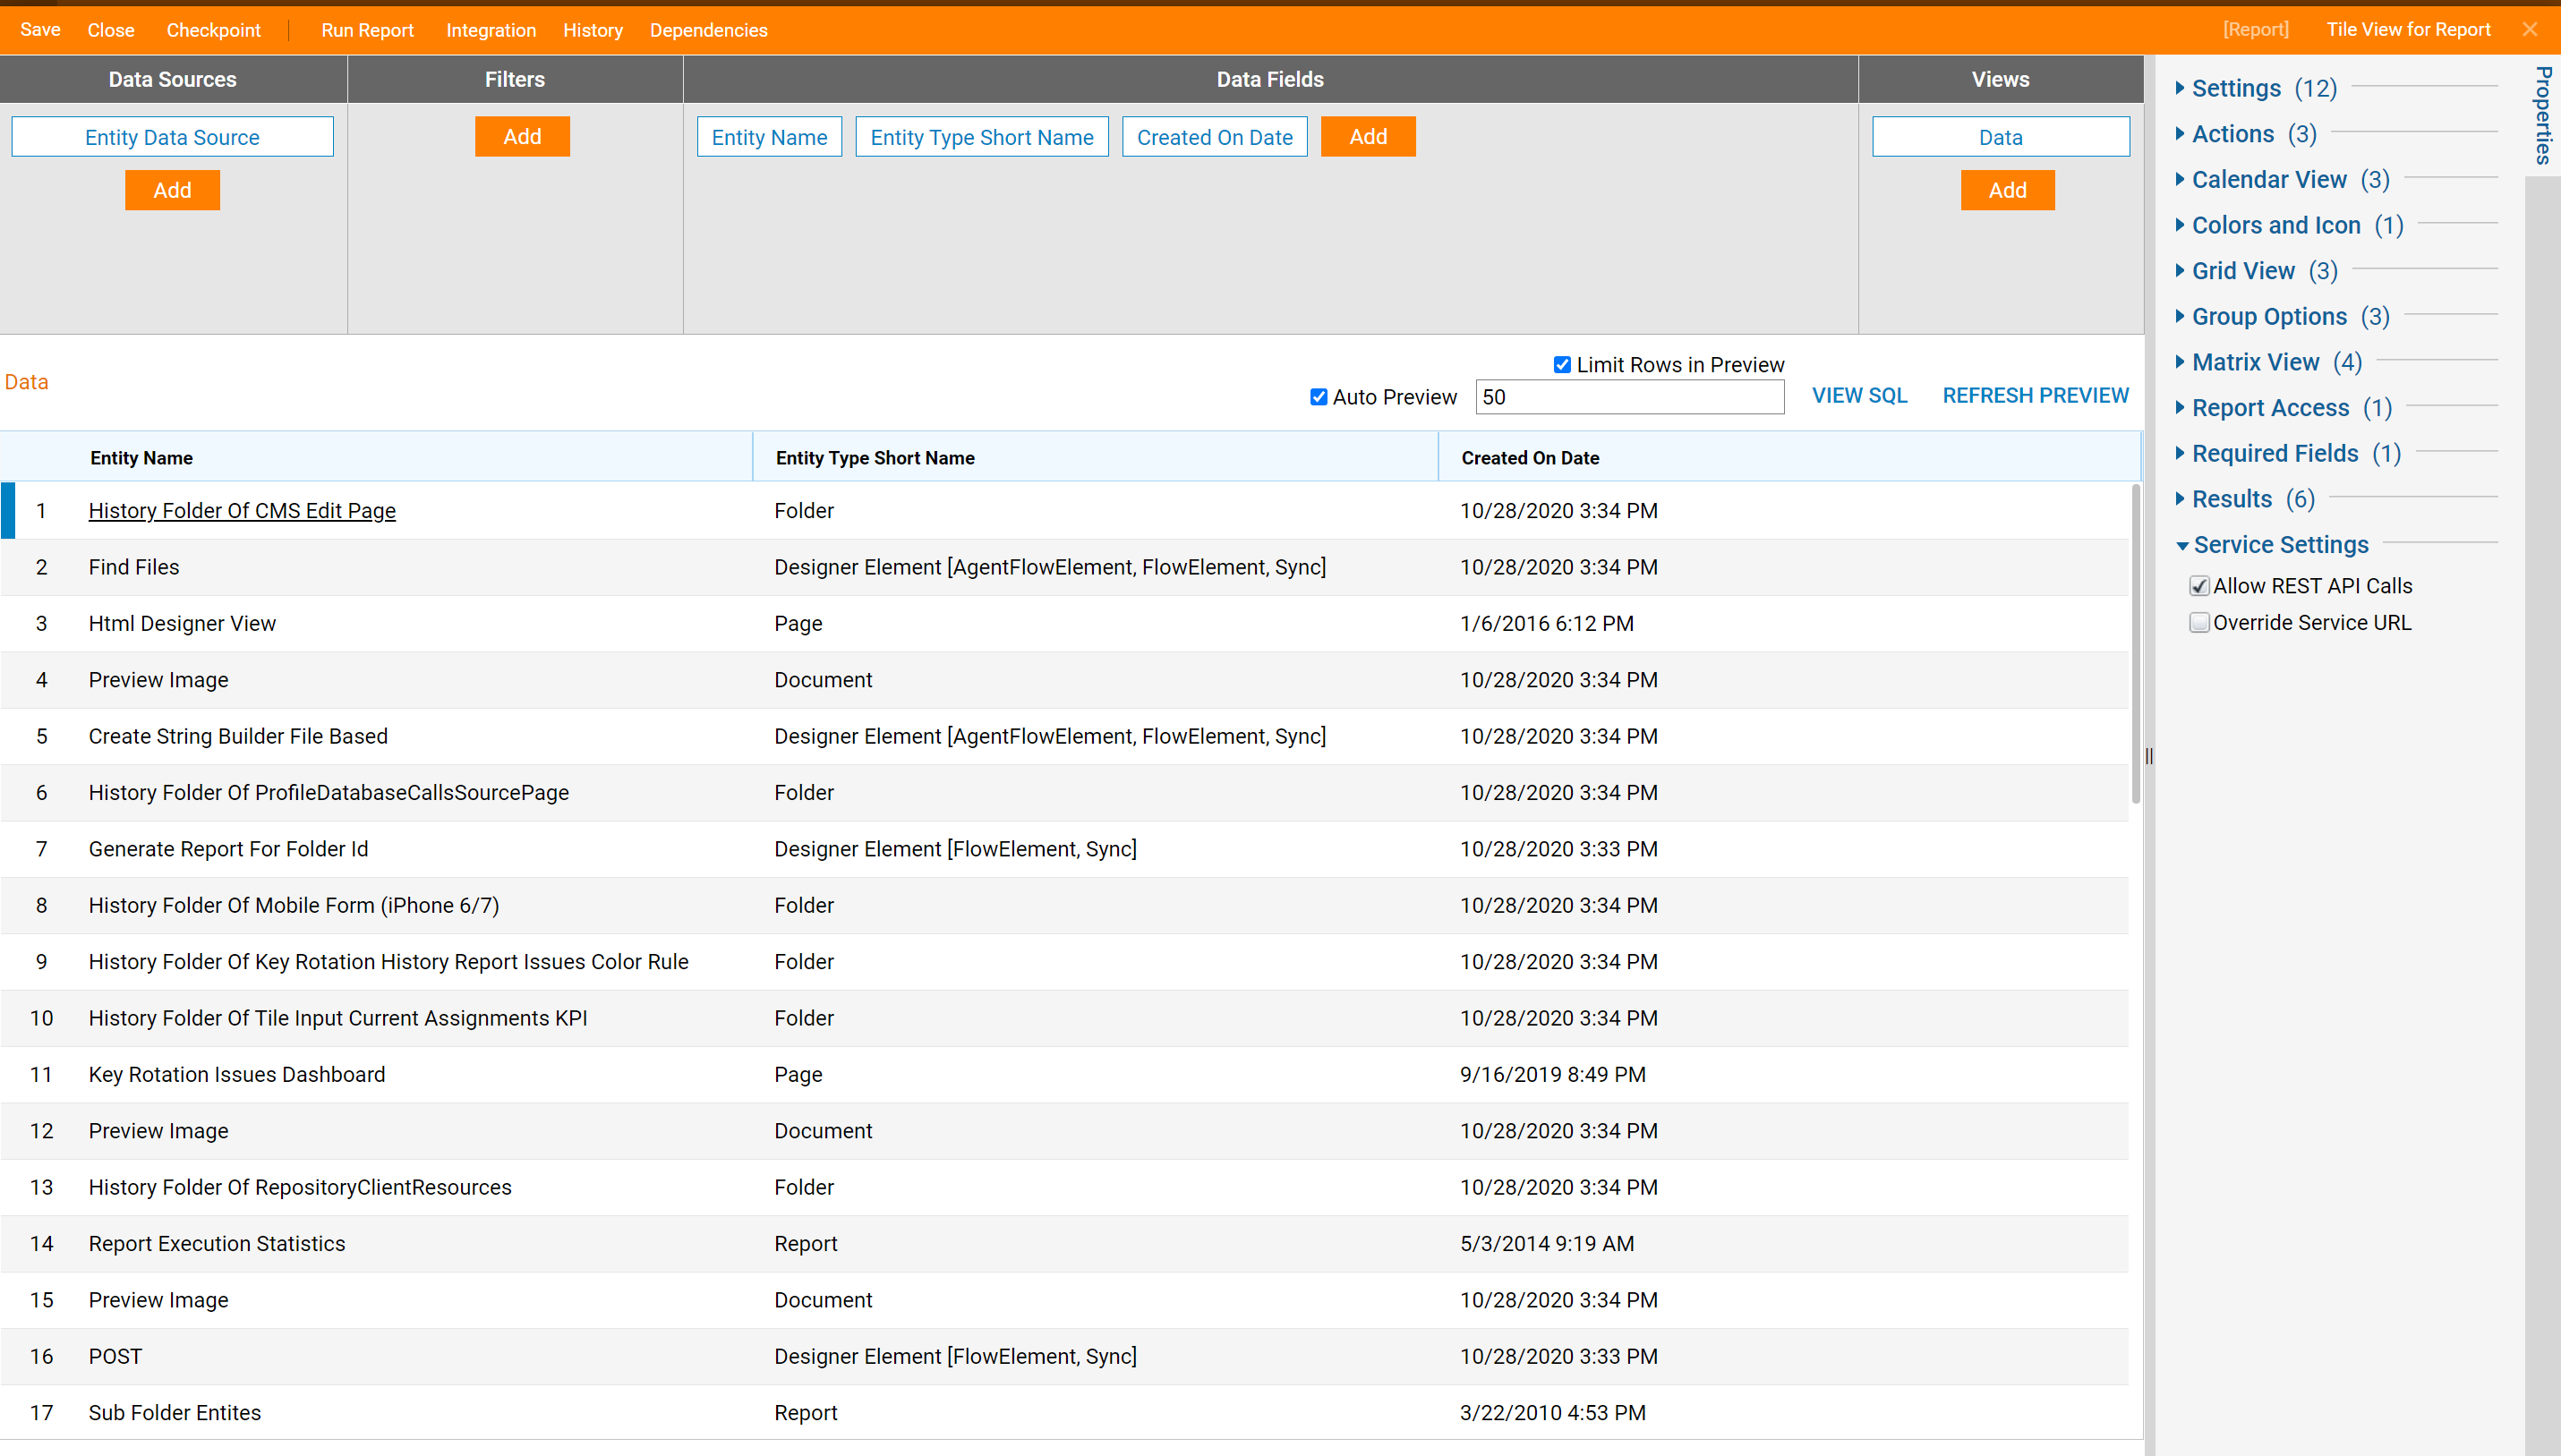
- In the Views section, select Add and select the Tiles view.
- Save and close the Report.
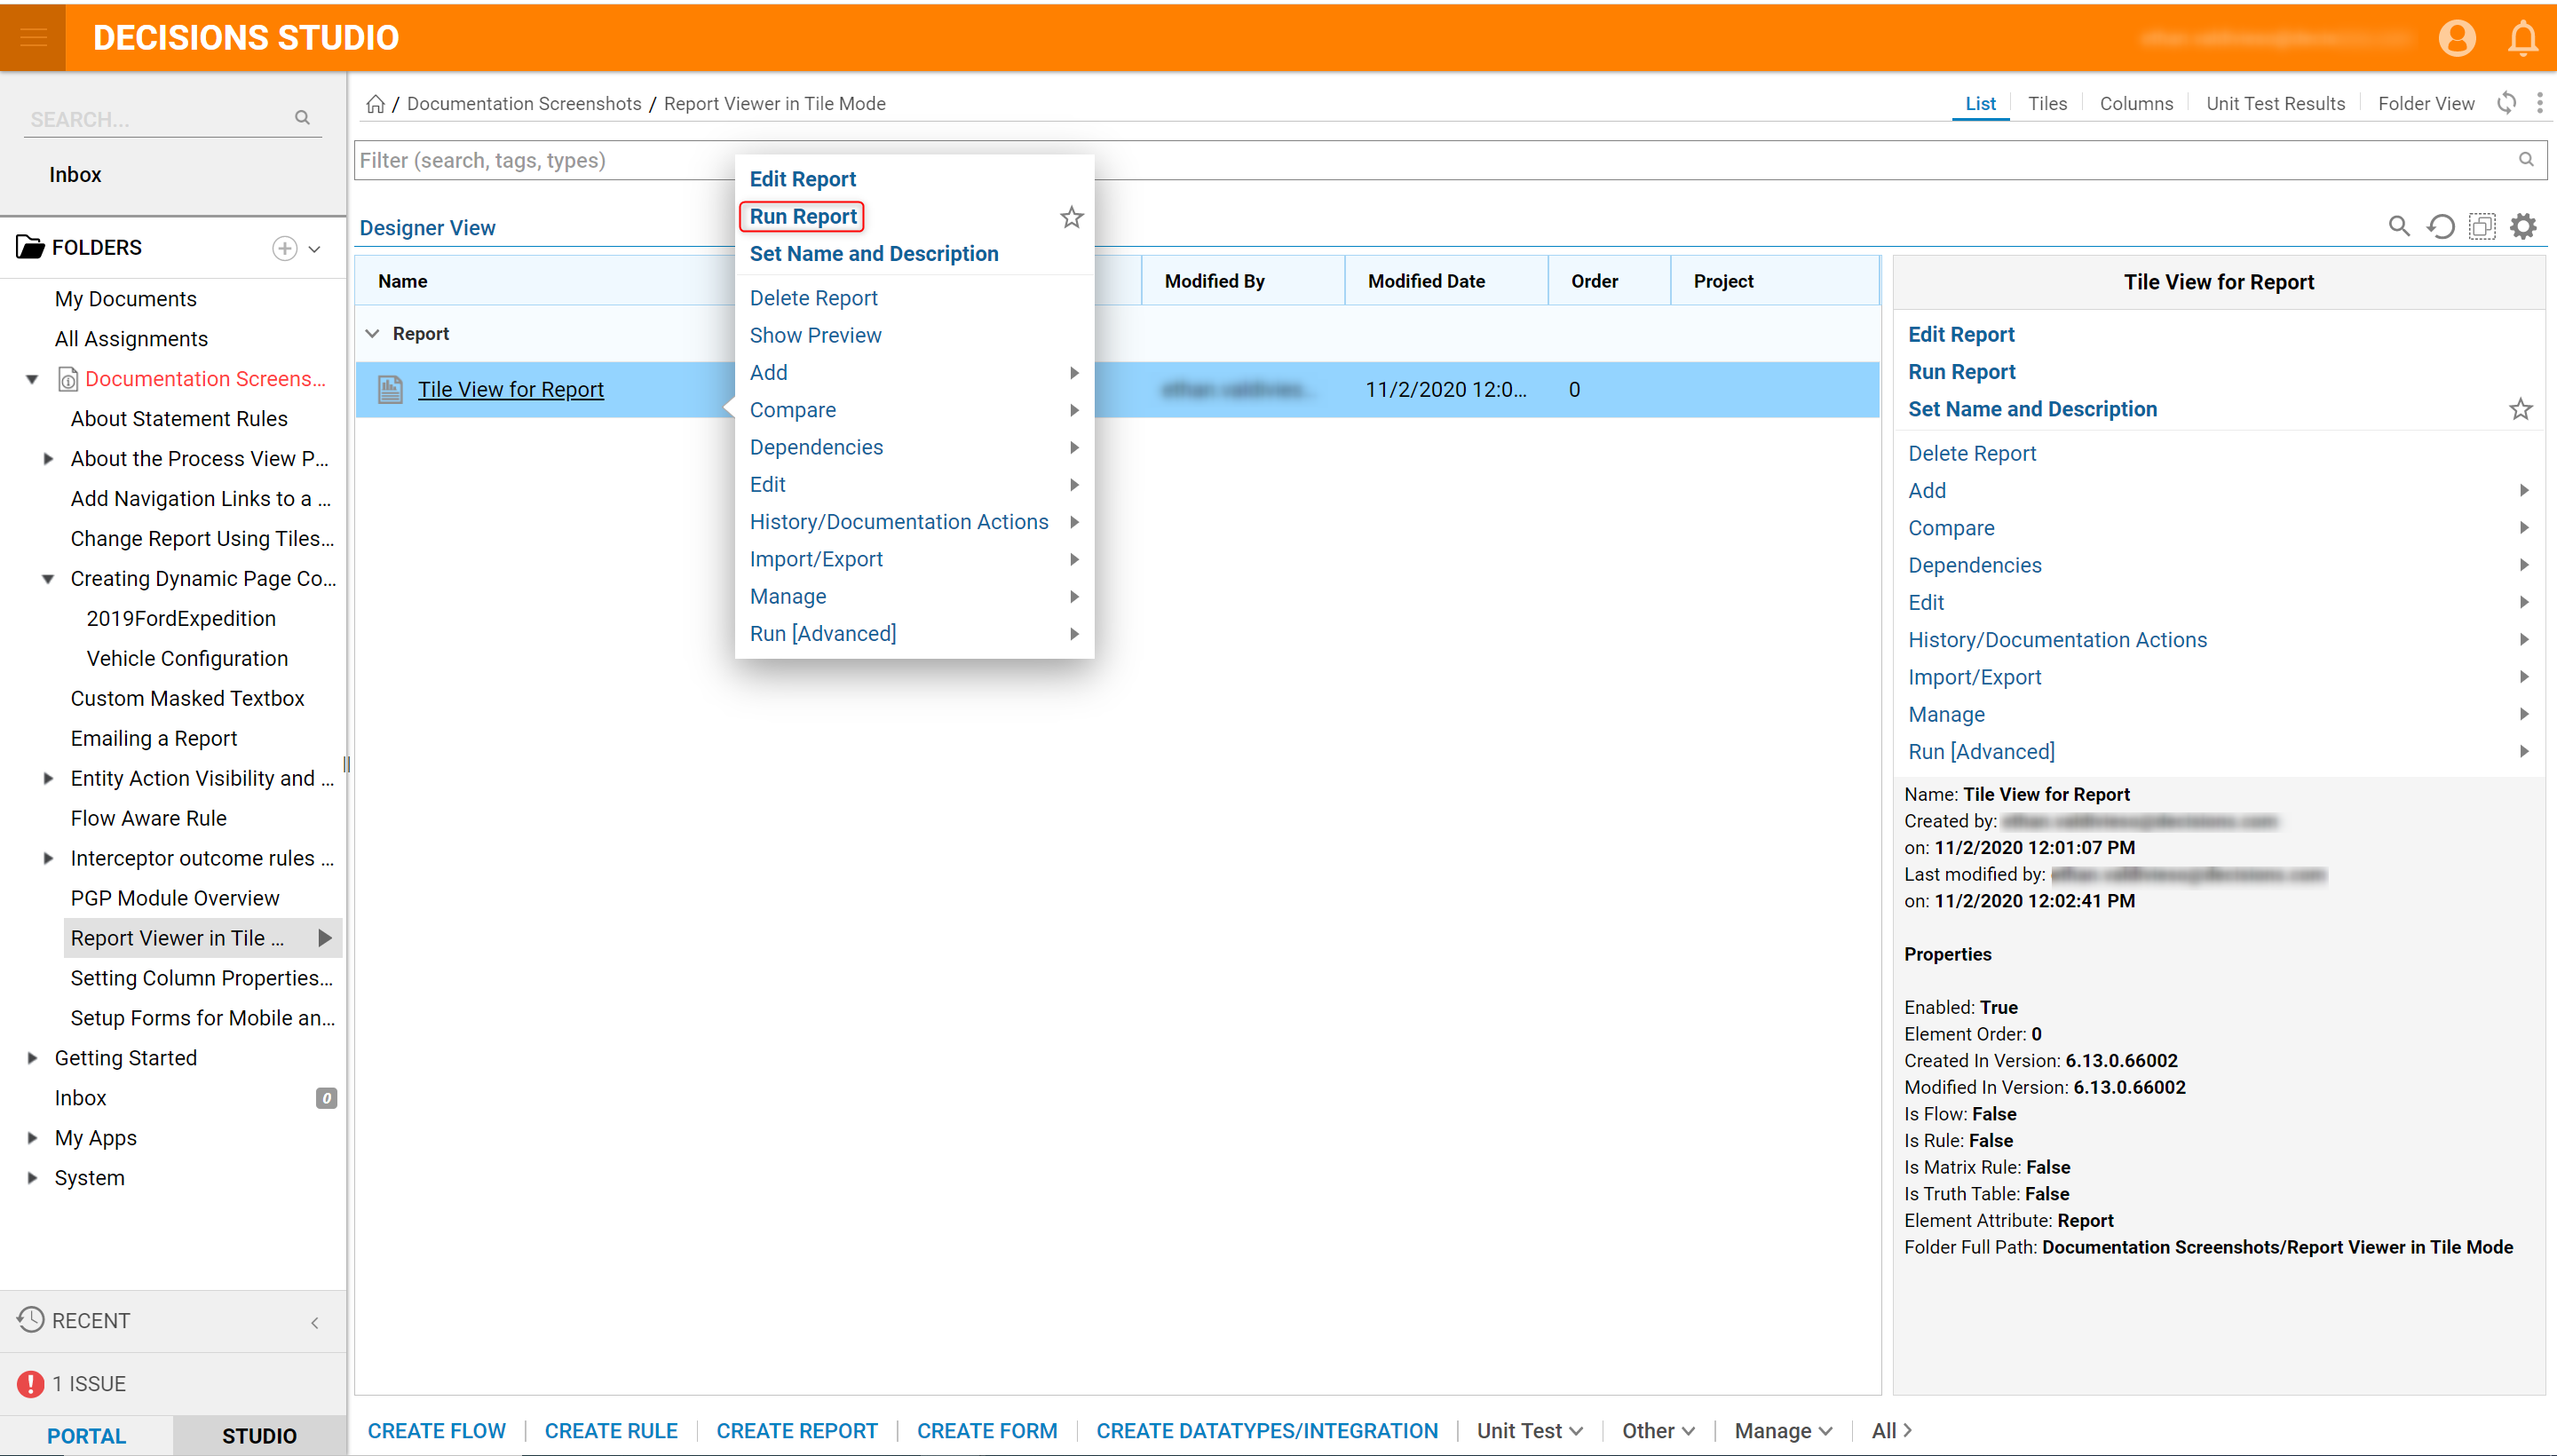
- In the Studio, locate the new Report and right-click to open the Actions menu. Select Run Report.
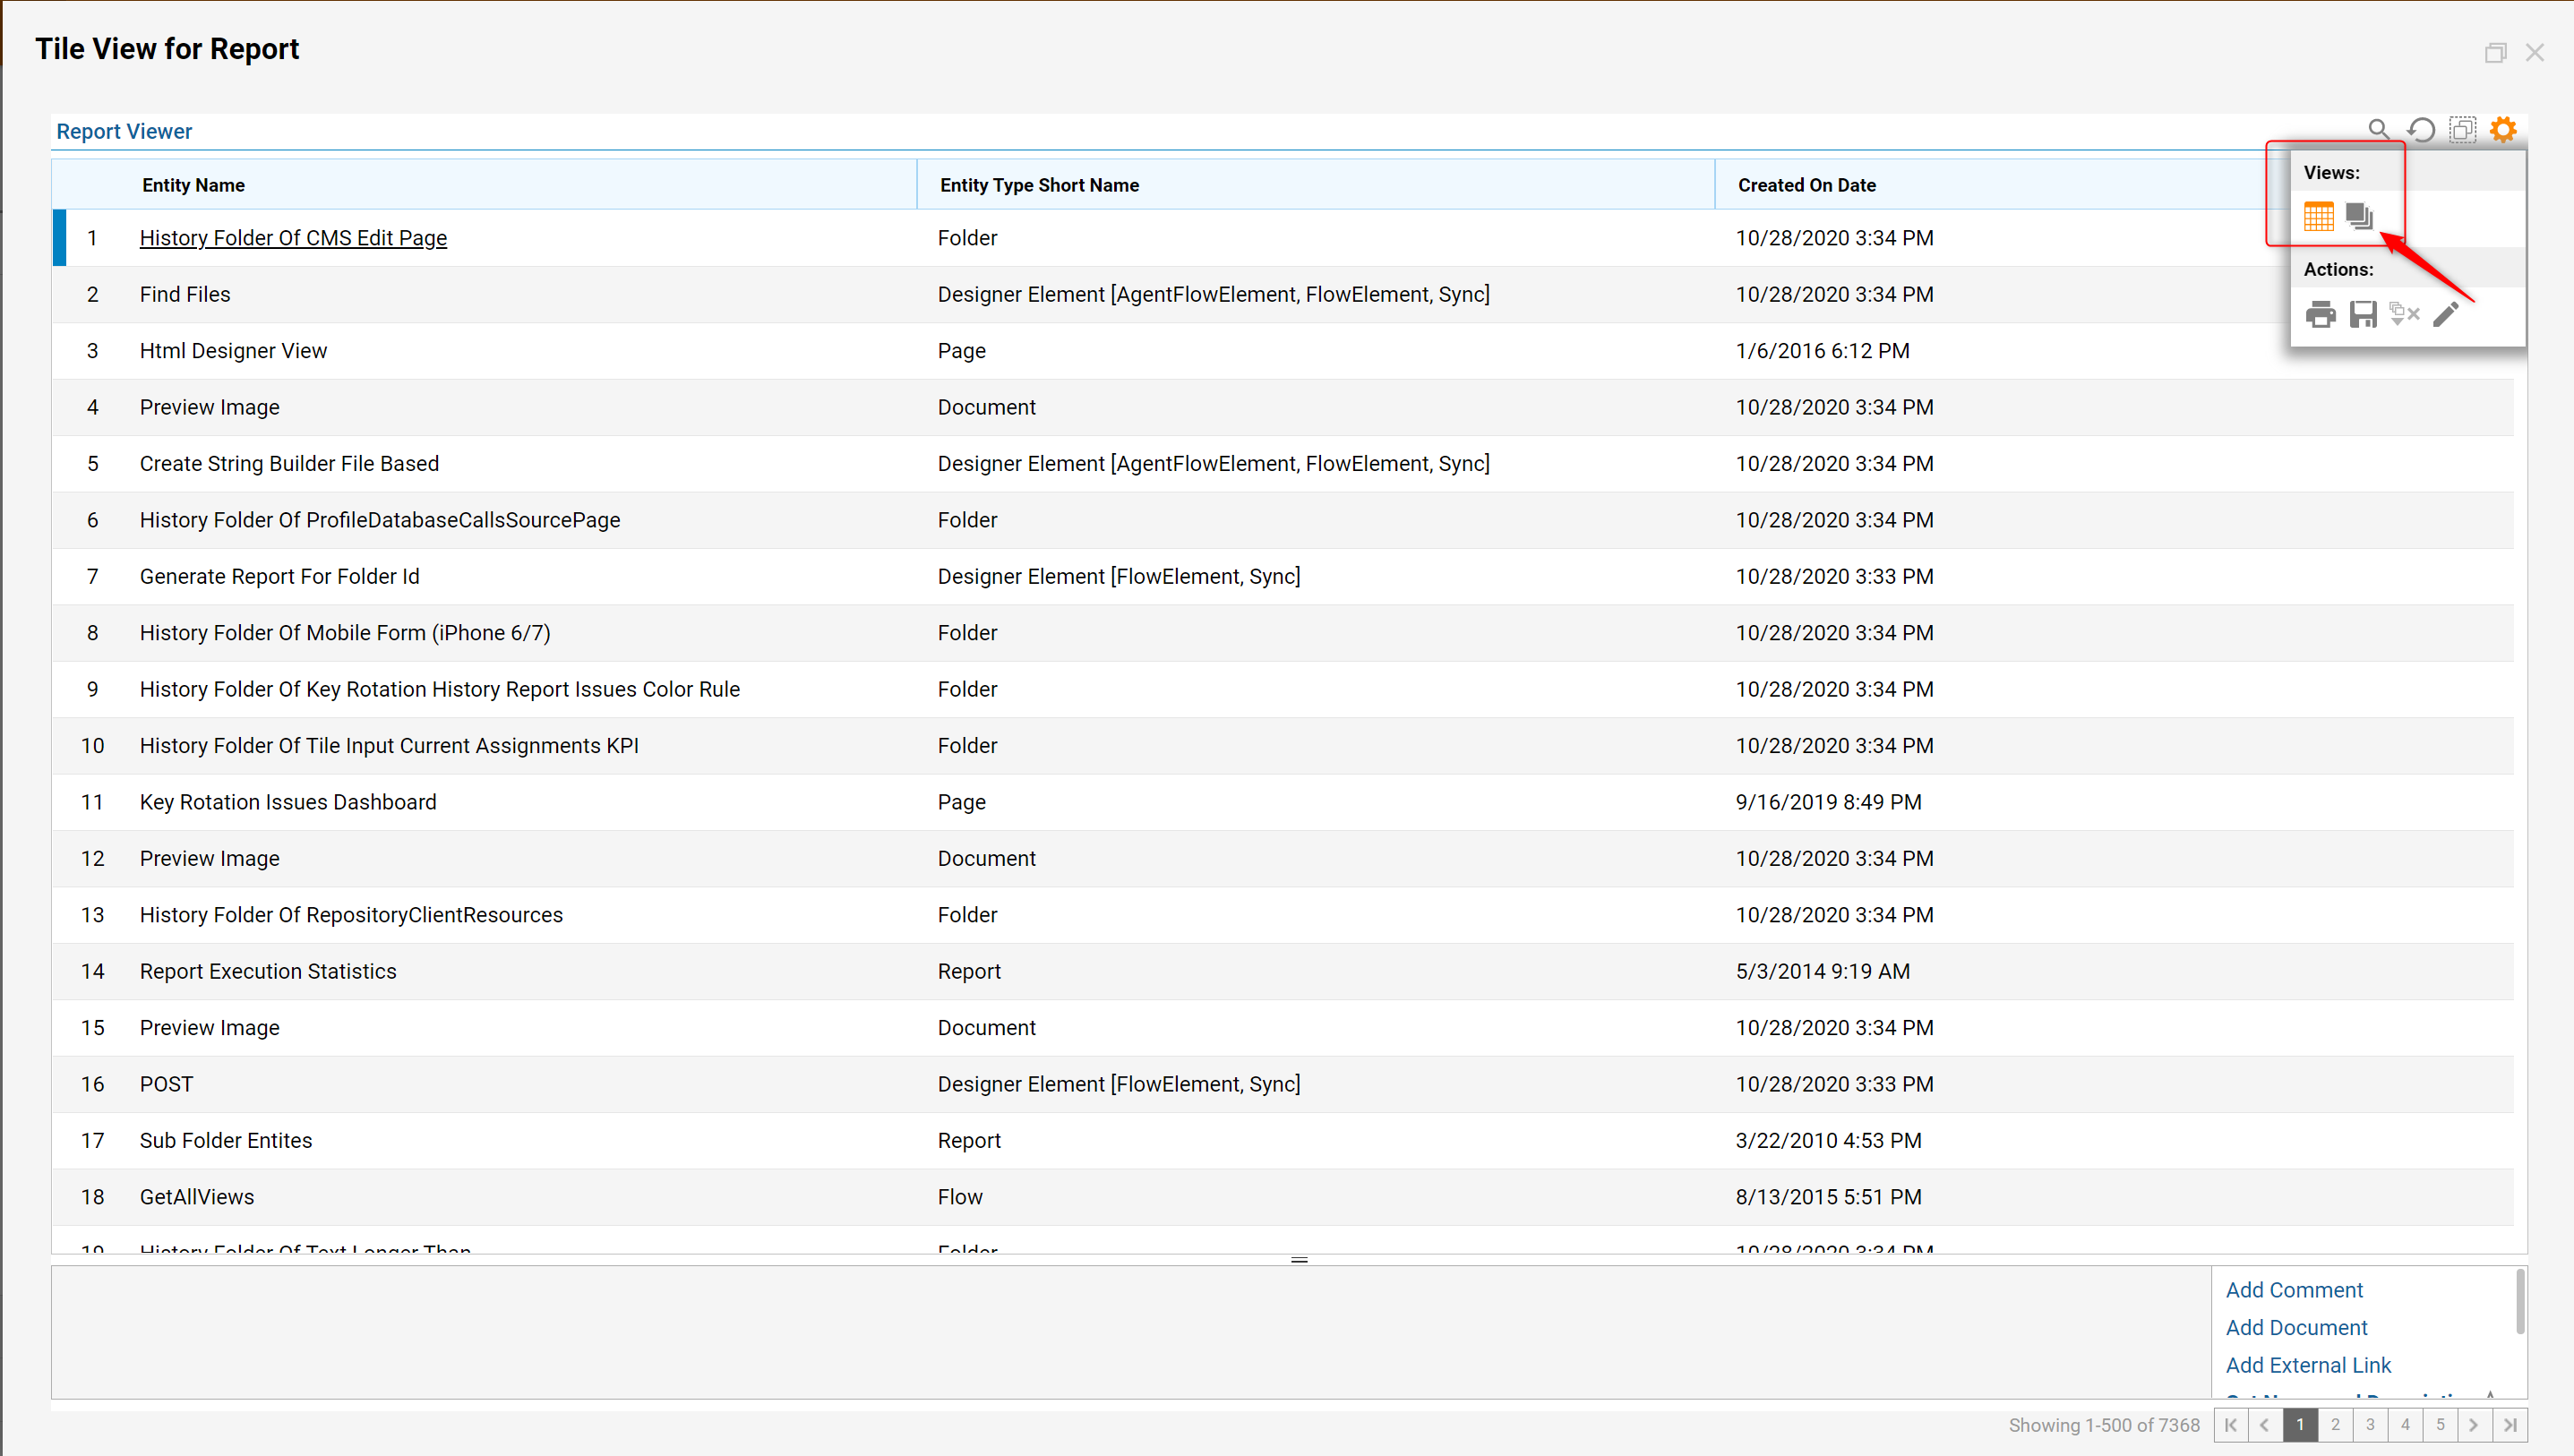
- In the Report Viewer, locate and select the gear or Settings button.
- Navigate to Views and select View Mode: Tiles.
- Notice the Groups: menu bar is now visible; this option allows the user to choose the desired method to group the information contained in the Report.Note: Clicking on any of the grouping options will change the way the Report data is being displayed. Additionally, clicking on a specific Tile will open a separate window containing the information for the selected Entity.
