Introduction
The Global Debugger is a new feature allows users to have more flexibility to troubleshoot Designer Elements within the Decisions Studio. It runs similar to a profiler. When the Global Debugging is turned on, it will in real time capture the running Flows and processes that are occurring within the Decisions environment. This helps troubleshoot processes that cannot be debugged efficiently with the Flow Designer Debug action. Scheduled Job Flows and Page Designer Tile Flows are two kinds of processes that more easily troubleshot with the Global Debugger.
How To Use
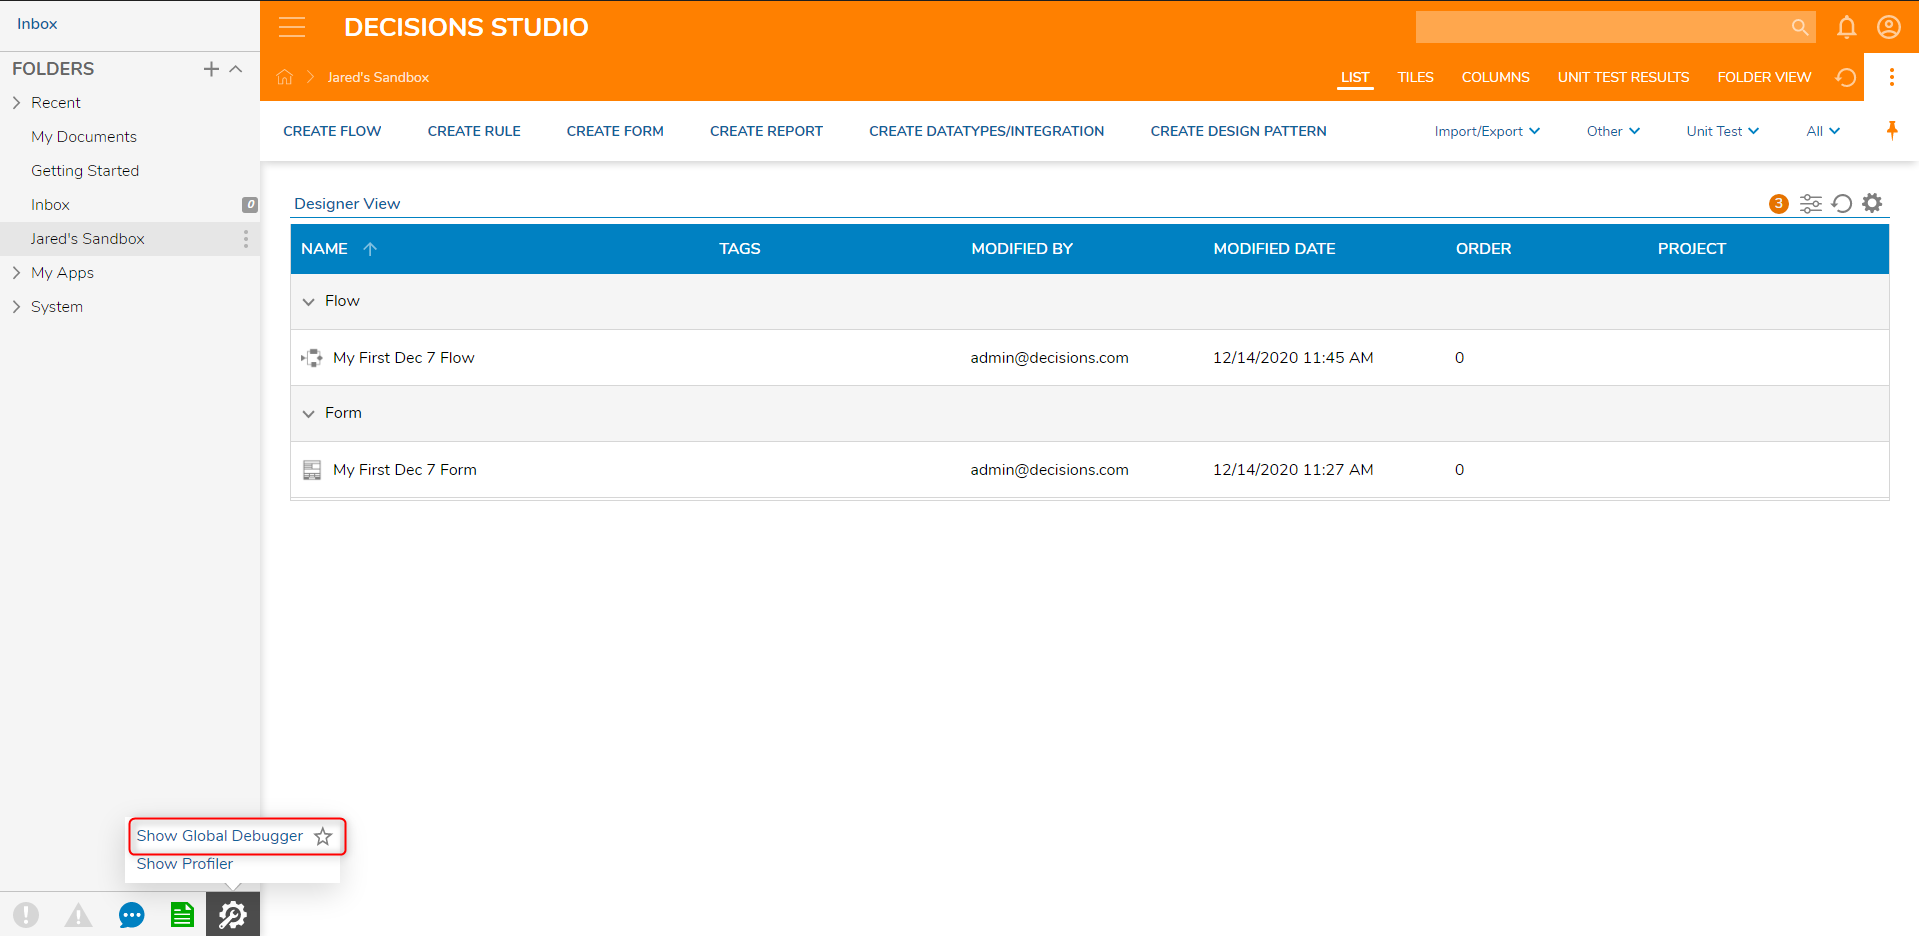
The Global Debugger can be enabled in the Designer Studio by clicking the wrench and cog wheel icon. Then click 'Show Global Debugger'.
This action will open a new browser tab taking the user to the Global Debugger home page.
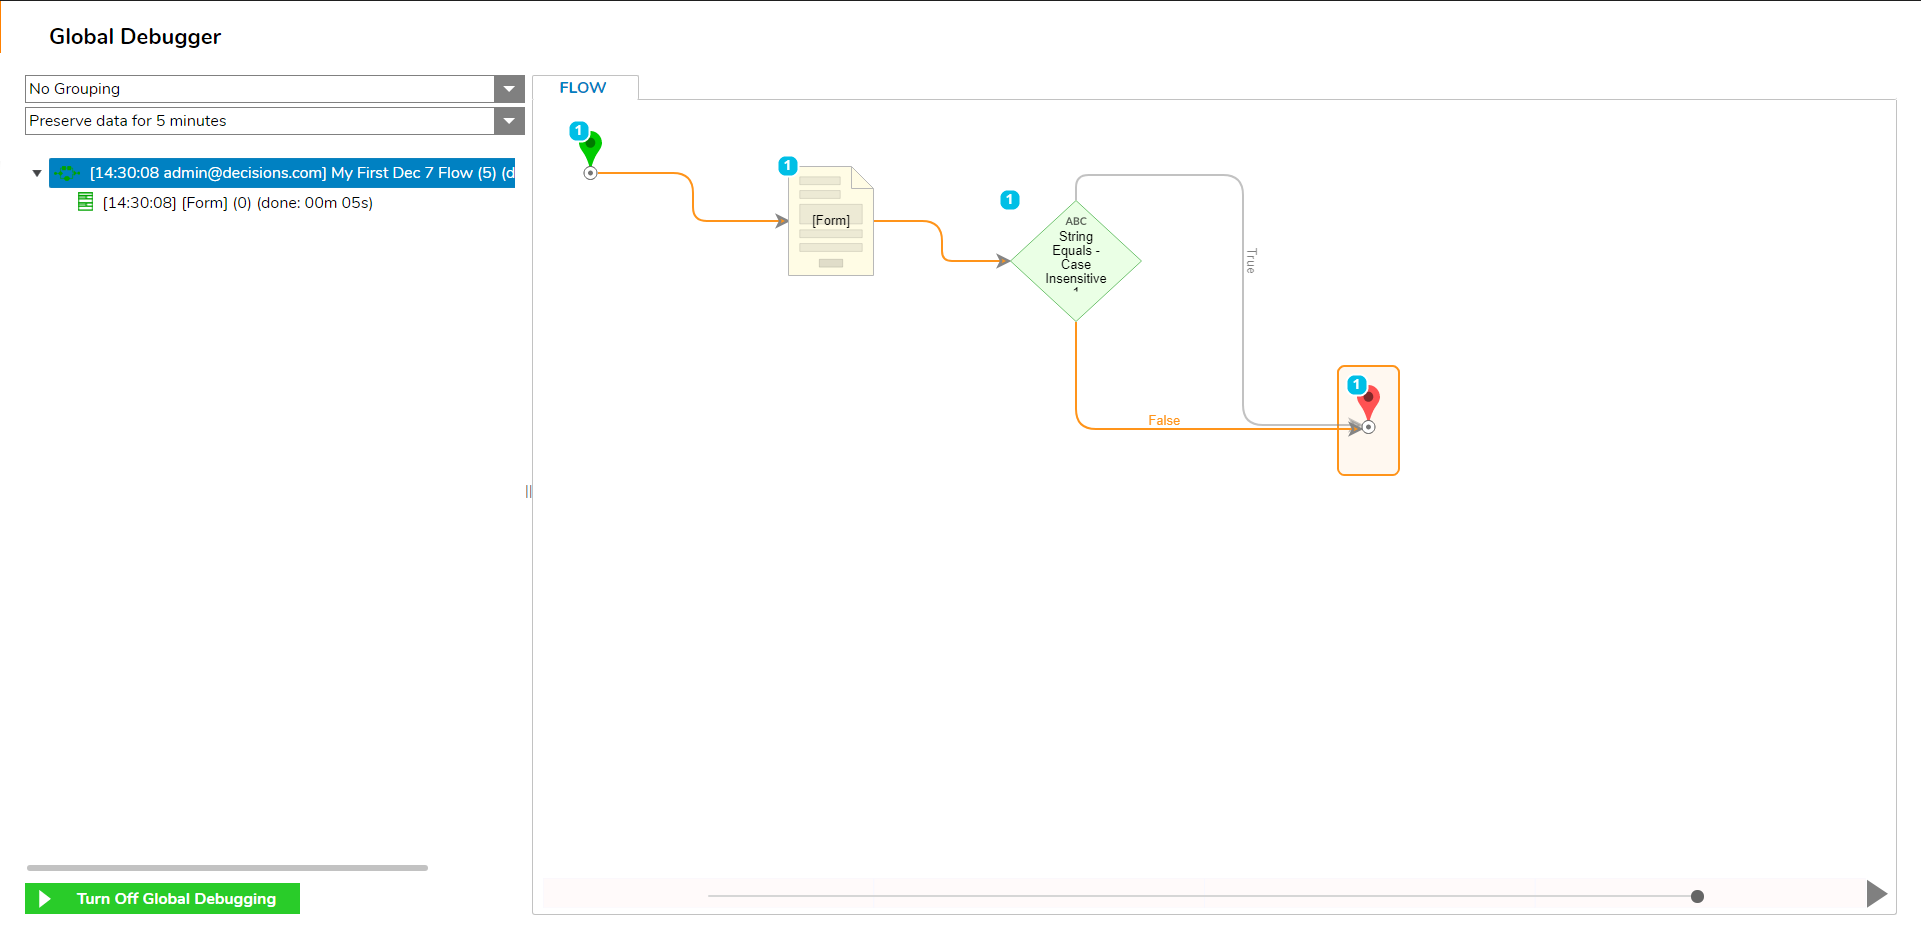
The first dropdown box controls how the debugged data be grouped. There are three options users can choose from.
| Grouping Options | |
| No Grouping | All Debugging data will appear individually |
| Group All | Groups all related data that can be expanded for details |
| Group Consecutive | Groups related process that were executed shortly after each other |
The second dropdown box controls when the debug data will refresh. This can be set for different pre-defined intervals, or users can select the custom option to declare a refresh time interval. To have data appear in this debugger, merely create and run a Flow or navigate to a user dashboard.