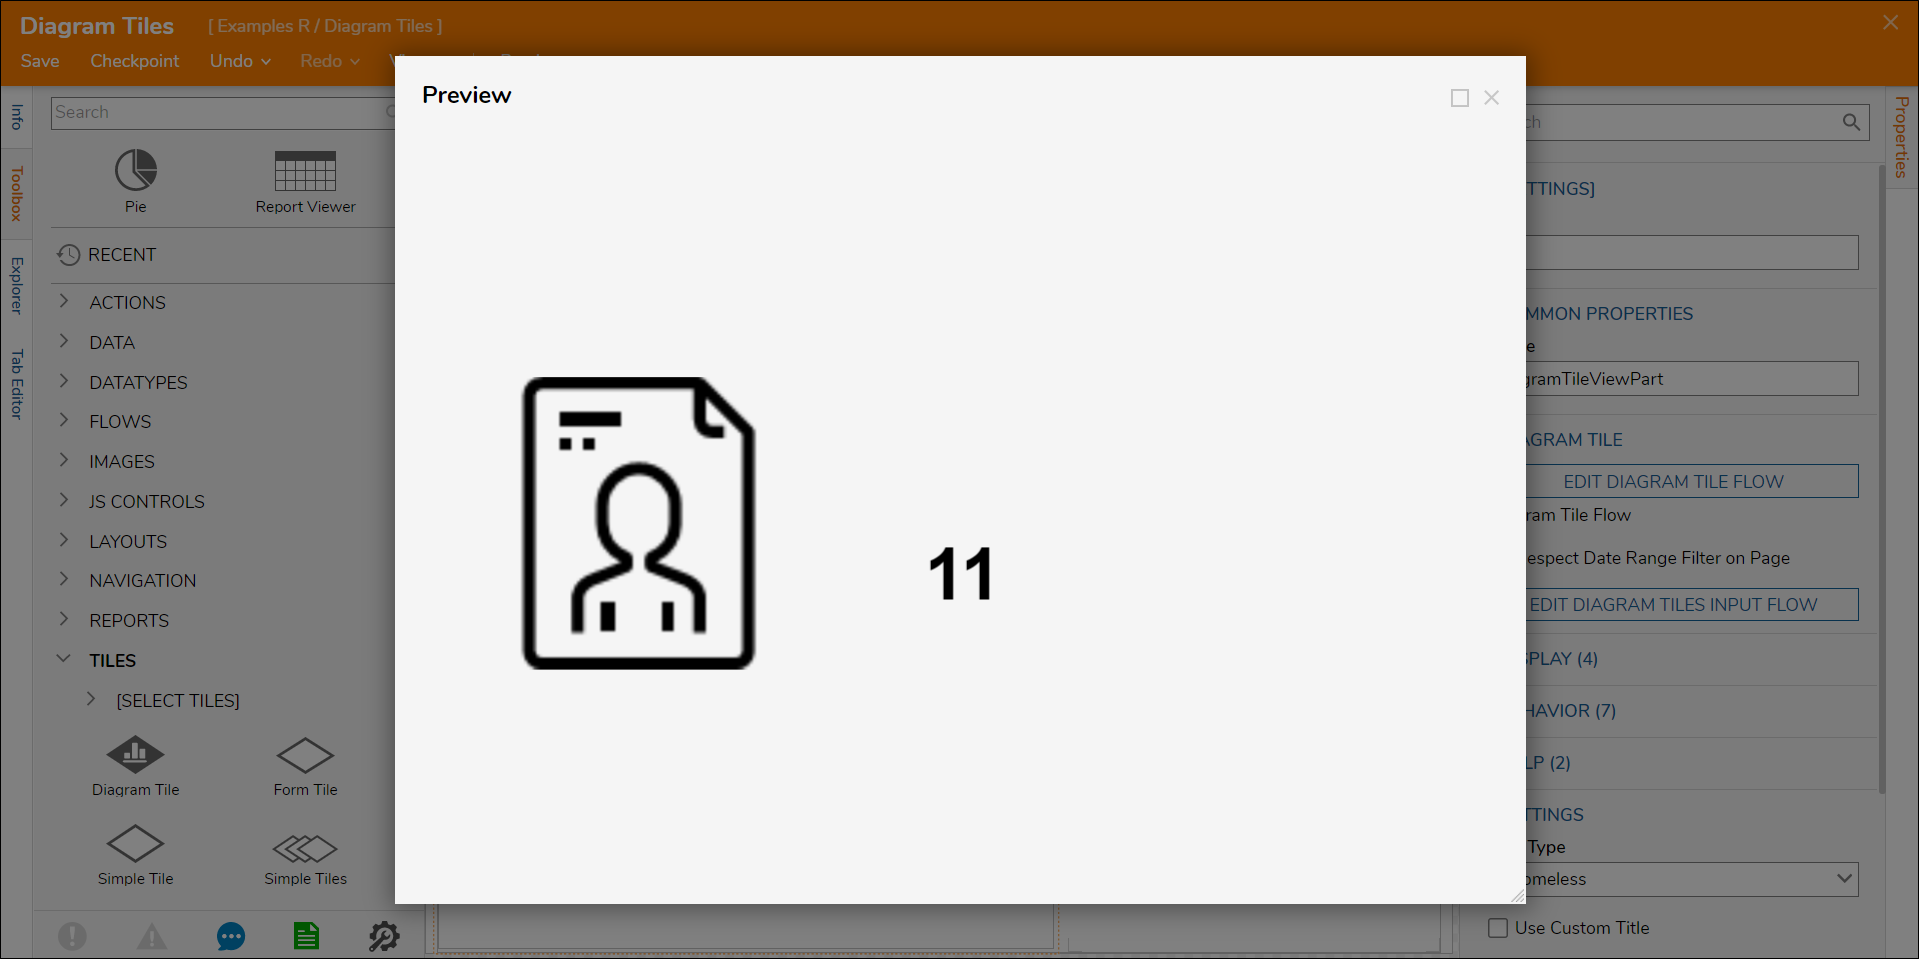
Diagram Tiles are components on a Page/Dashboard that can be used to present data with infographics. These tiles have a unique Designer Studio that resembles a Flow Designer but uses visual charts, shapes, labels, images, and more to create the content shown on the tile. These elements have their own properties that can be configured to achieve a specific aesthetic while showing relevant data.
Diagram Tiles need a Diagram Tile Flow and an Input Flow to supply the Diagram Tile Flow with a source for the input data. This example explores the use of a Diagram Tile that shows an image of an ID badge and a label with the number of accounts in the Decisions environment. The image is static and selected from the default image library. The label uses input data in the Diagram Tile Flow sourced from a Fetch Entities step in the Input Flow.
Example
- Create a new Page from a Designer Project using the Create a Page/Dashboard article.
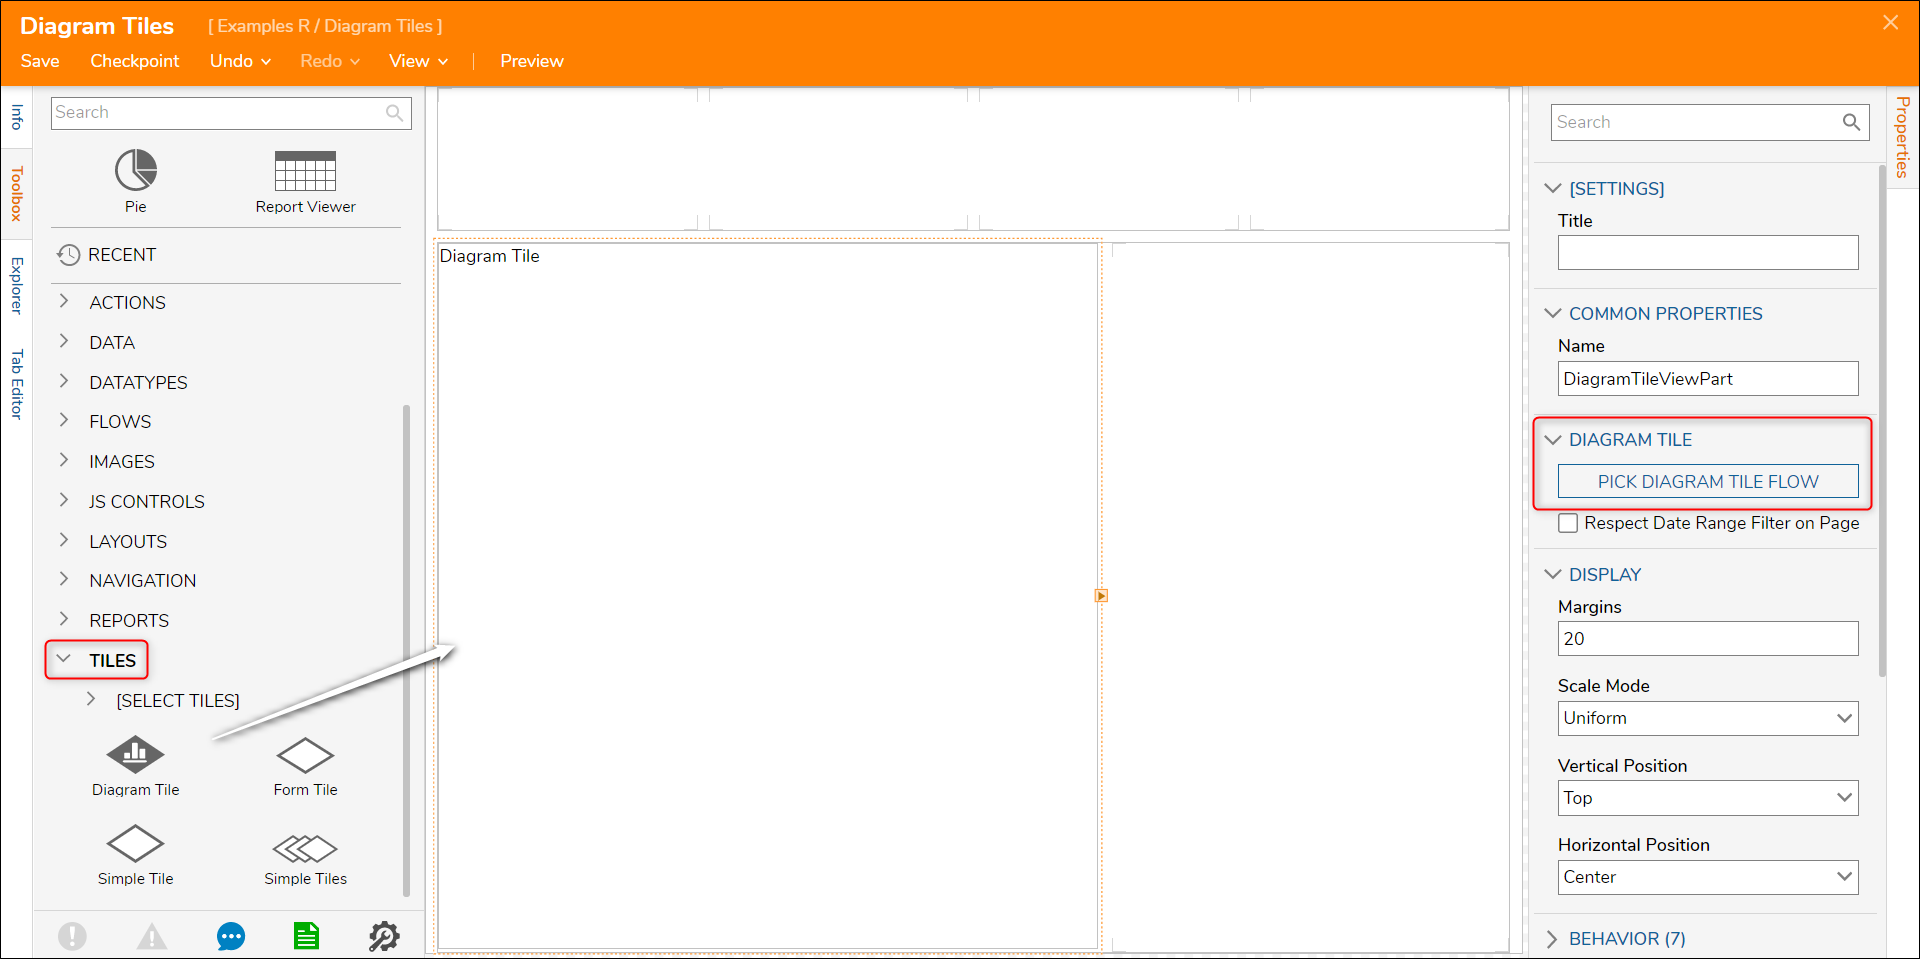
- In the Page Designer, expand the TILES section of the Toolbox and drag a Diagram Tile component into an empty spot in the workspace.
- With the Diagram Tile selected, the properties for it will appear. In the DIAGRAM TILE section, select the PICK DIAGRAM TILE FLOW button.
- Select the option to CREATE and provide a name for the Diagram Tile Flow.
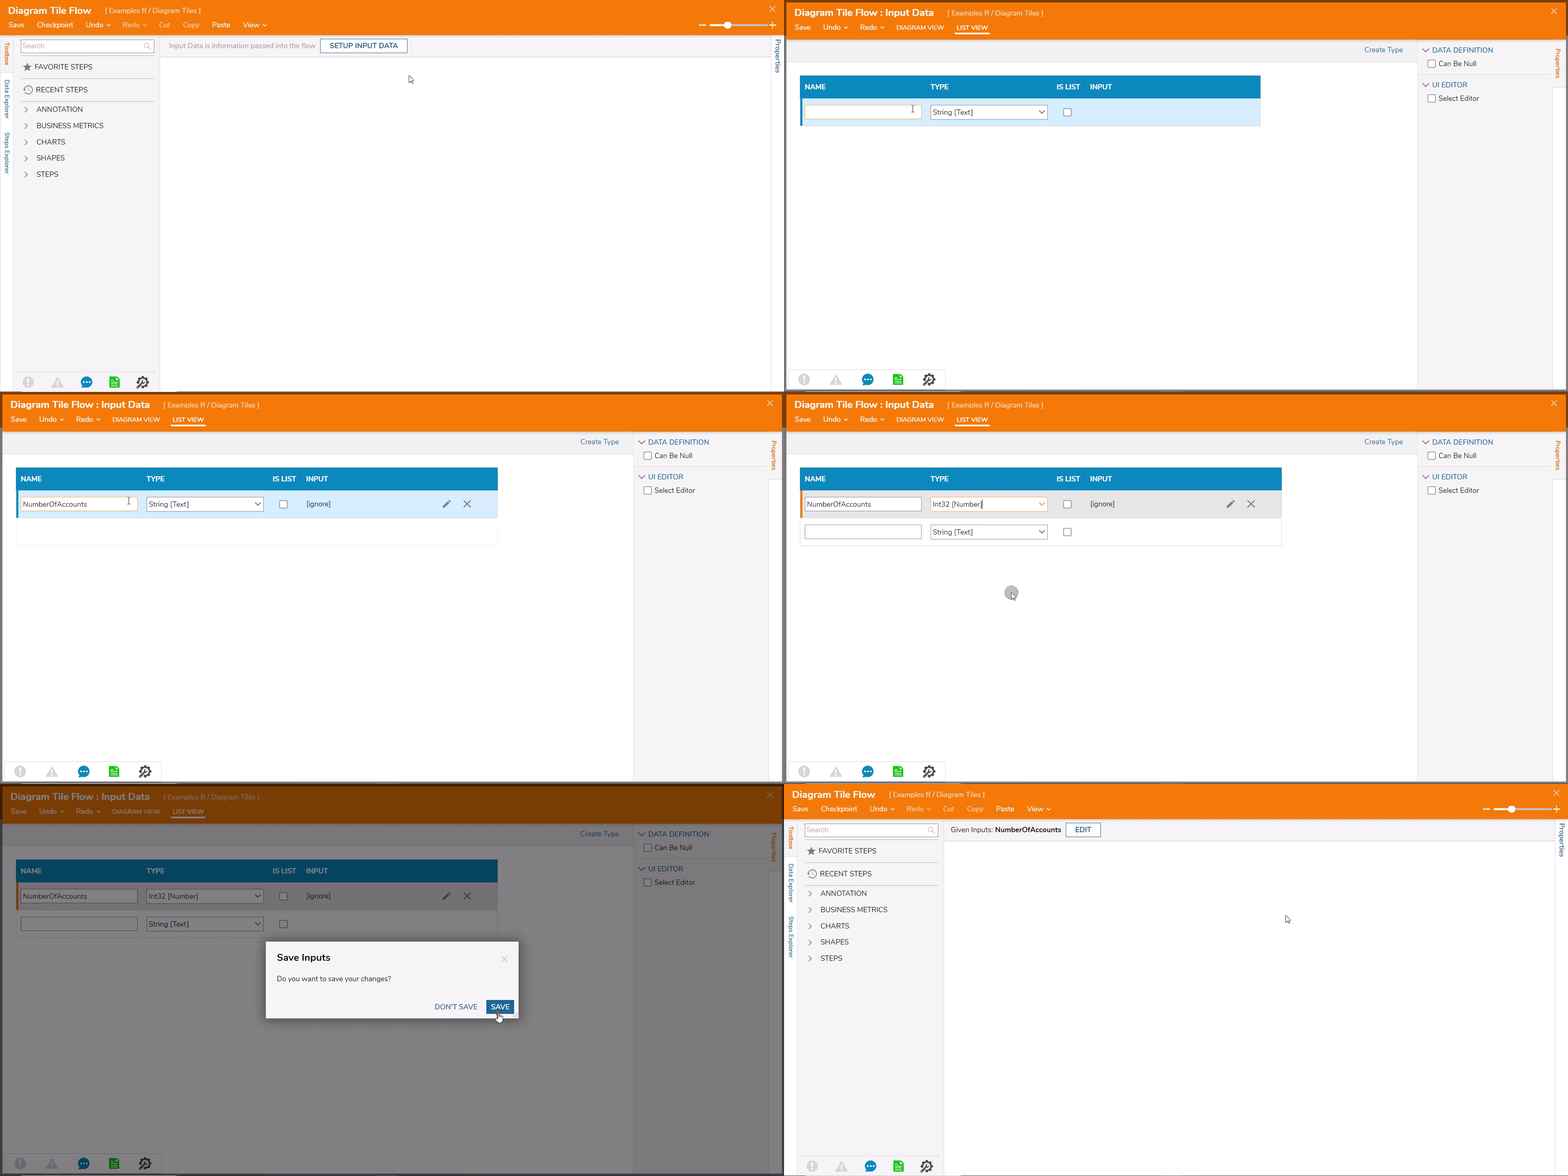
- In the Diagram Tile Designer, select the SETUP INPUT DATA button at the top.
- Enter NumberOfAccounts as the NAME, expand the TYPE dropdown, and then choose Int32 from Favorites.
- Save and exit the Input Data screen.
- Expand the ANNOTATION section of the Toolbox and drag an Image component into the workspace.
- The CONFIGURATION DETAILS section of the properties has some settings that can be configured to manipulate appearance.
- The option to choose an image from the default image library is available by selecting the pencil icon in the IMAGE section.
.png)
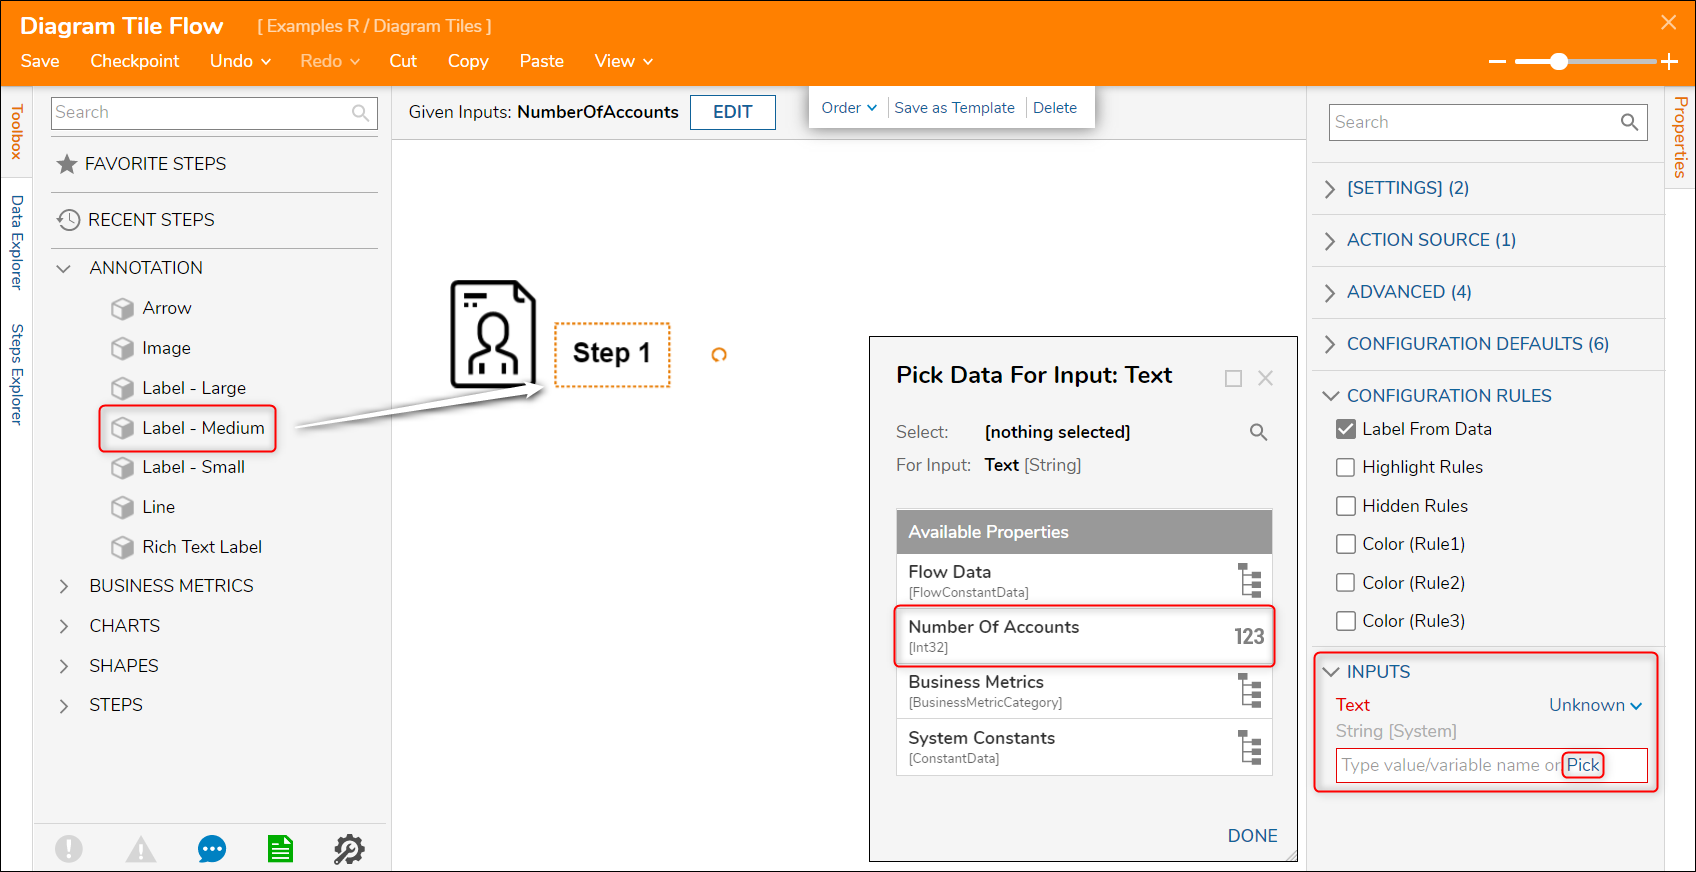
- Drag a Label- Medium into the workspace in the same section as the Image component.
- In the CONFIGURATION RULES section of the properties, select the Label From Data checkbox to tell the component that the label text will appear as the value of the mapped data.
- In the INPUTS section, select the Pick button under the Text input that has now appeared.
- Select the NumberOfAccounts input data configured at the beginning of the Diagram Tile Flow, then select DONE. None of the Available Properties are needed; select DONE again.
- Save and close the Diagram Tile Flow once complete, returning to the Page Designer.
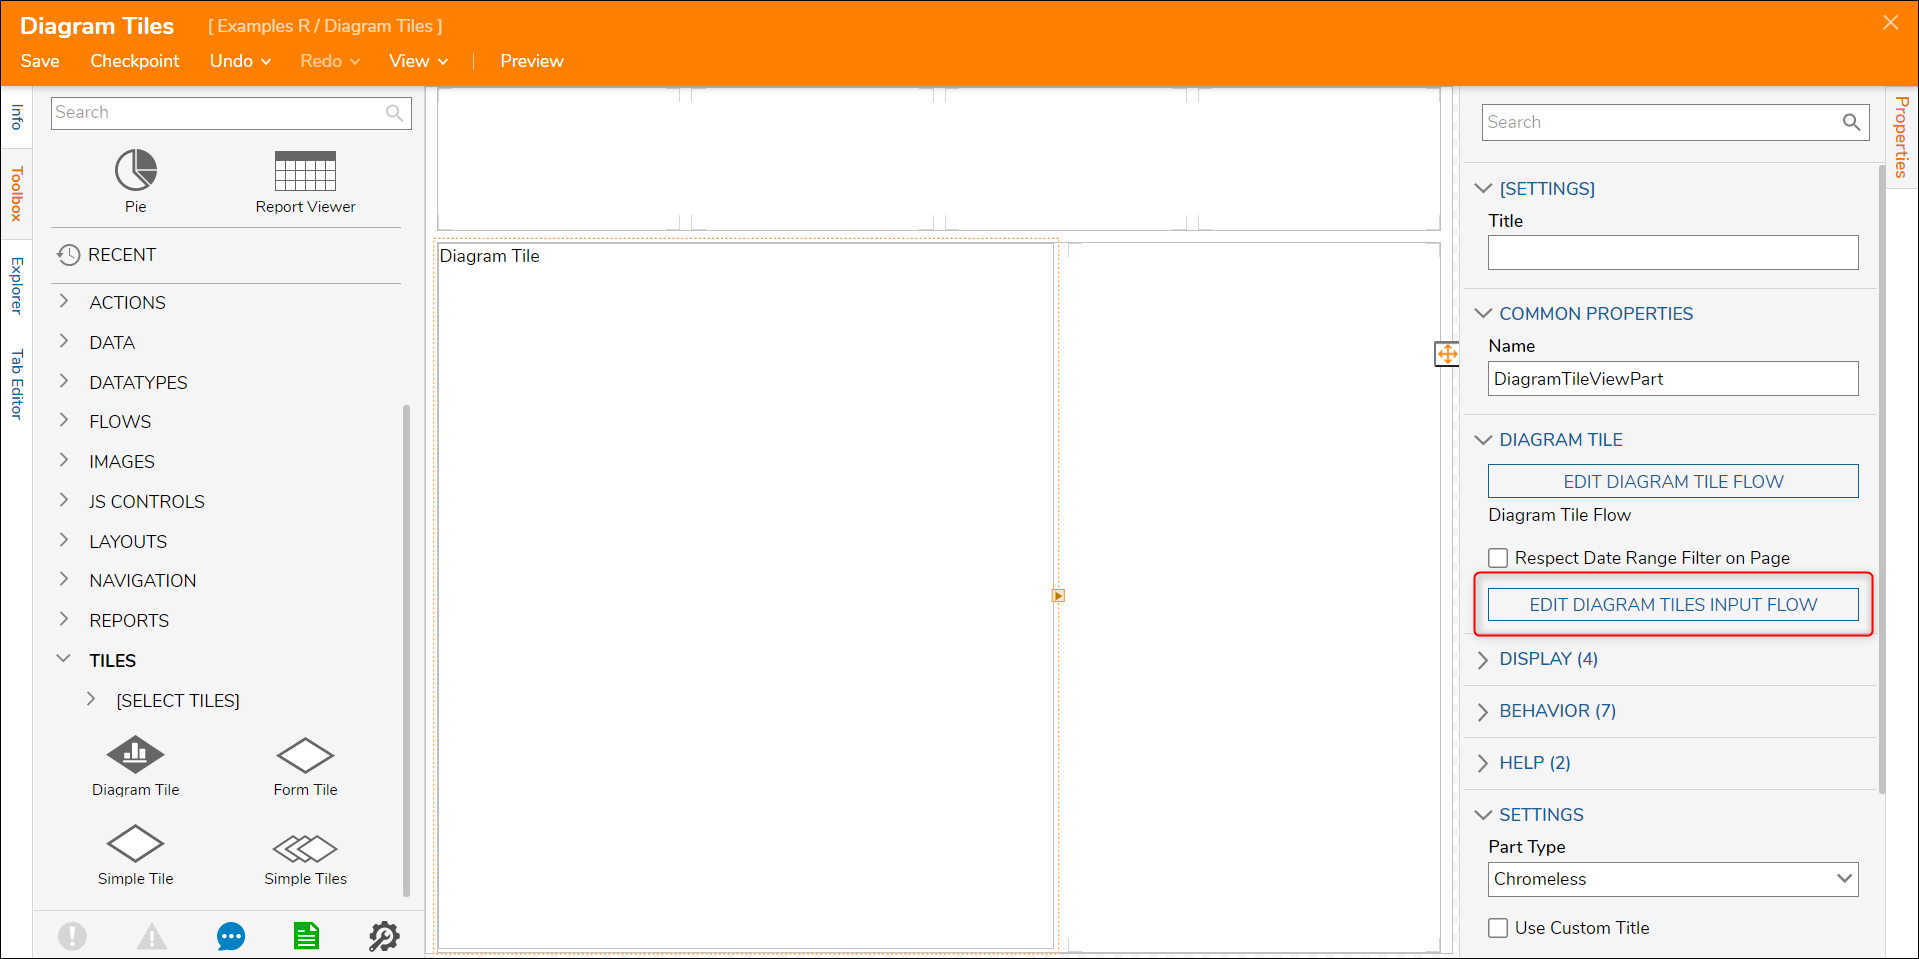
- Now that the Page Designer detects input data configured in the Diagram Tile Flow, a new box has appeared for the Input Flow. Select the EDIT DIAGRAM TILES INPUT FLOW button. This will redirect to a Flow Designer for defining the Diagram Tile input data.
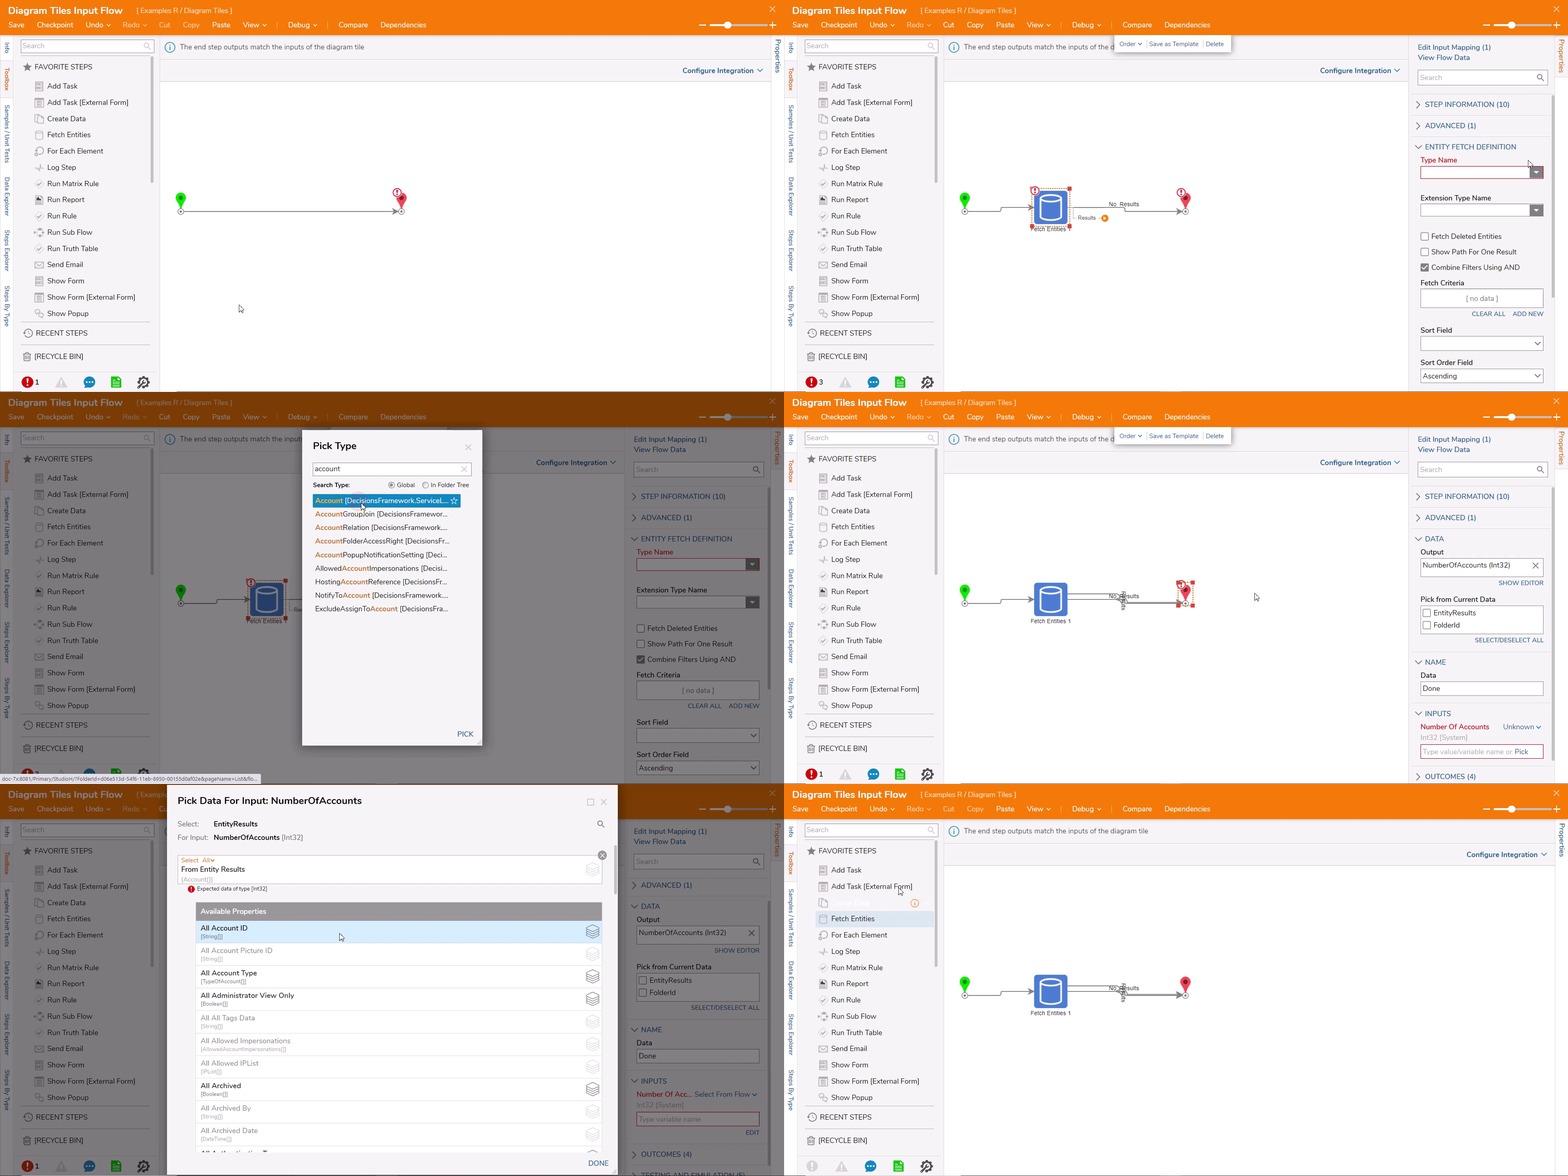
- This Flow Designer is specifically configured to define the Diagram Tile input data, which is why the end step is automatically populated with output data that will match.
- Connect the start and end step, drag a Fetch Entities step from the FAVORITE STEPS section of the Toolbox and place it on the connecting line. Connect both paths of the Fetch step to the end step.
- Select the Fetch step and expand the Type Name dropdown under the ENTITY FETCH DEFINITION section. Select the All/Search... option and enter the account, then select the first data type in the list.
- Select the end step and locate the INPUTS section of the properties. Select Pick for Number Of Accounts and expand the Entity Results, All Account ID, Count, and select DONE. This indicates that the output of this Flow is the input to the Diagram Tile, which will be the count value of how many account IDs are present in the Decisions environment.
- Save and close the Flow once complete.
- Select the Preview button on the top Action Bar in the Page Designer.
- The Preview of the Page shows the Diagram Tile created and configured to supply a data value to the label shown.
