Overview
The purpose of creating a Database Table Relationship is to integrate data from two separate database tables and pull from them at the same time. A user can use their default database, or they can integrate with another database. For more information on integrating a database, see Integrating an External Database with a Flow.
Example
This example demonstrates how to display columns from related Tables in the Report Designer. This is done by creating a Relationship between Tables to join them. Then, this Relationship can be used in the Report Designer to add a related Data Source.
- Start by creating a Relationship between Tables.
- In the Designer Folders, Navigate to the System > Integrations > Databases Folder in the Portal.
- Next, navigate to the Database Folder and create a Relationship.
- From the Folder Actions Panel, select Add Relationship.

- In the Add Relationship window, Name the Relationship.
- Then, pick the Tables and Fields that should be Related.
- Click OK when finished.
.png)
- The Relationship is being created in the Database Folder.

- Navigate to the Designer Folder and click CREATE PAGE/REPORT > Create Report from the Folder Actions Panel.
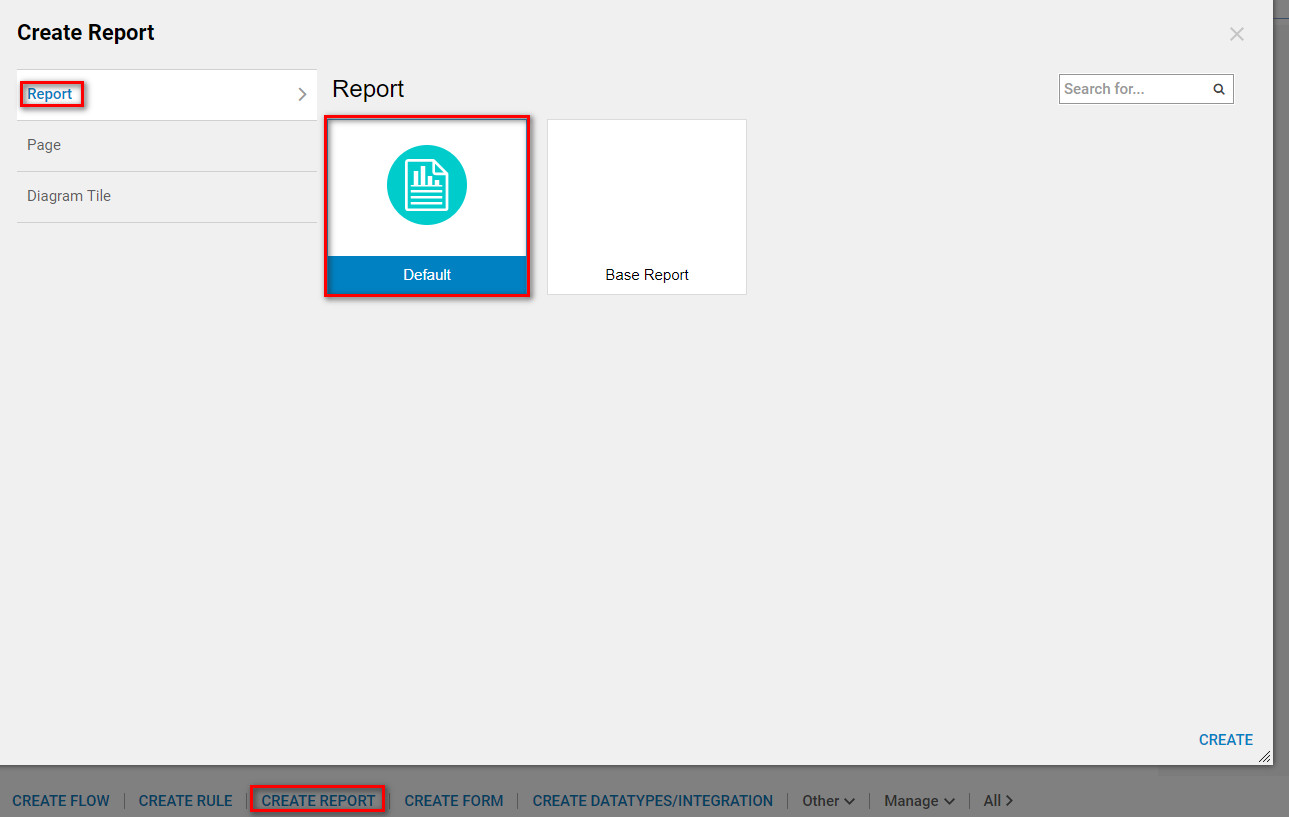
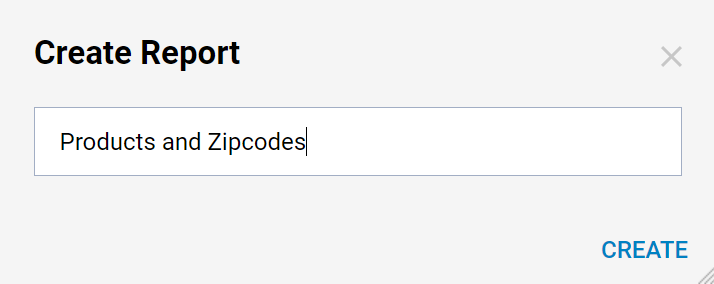
- Next, Name the Report and select CREATE to proceed to the Report Designer.
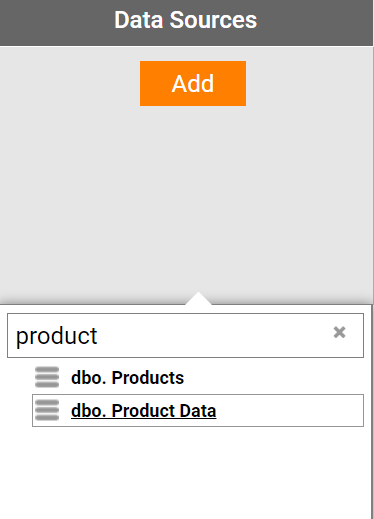
- In the Report designer, expand Data Sources > Common > [Folder For Our Database] and Add one of the Tables from our Relationship as Data Source.
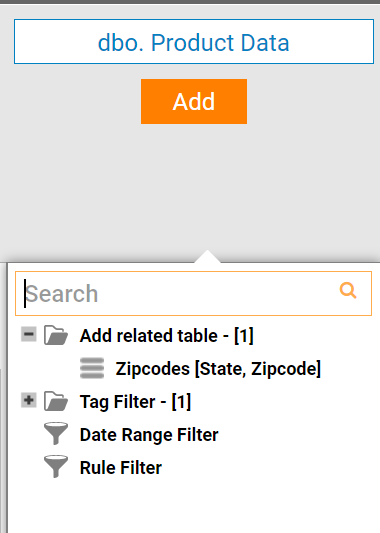
- An option will appear called Add Related Table because a relationship has been created.
- Select ADD, then select Add Related Table and the second table will be added to the Report.
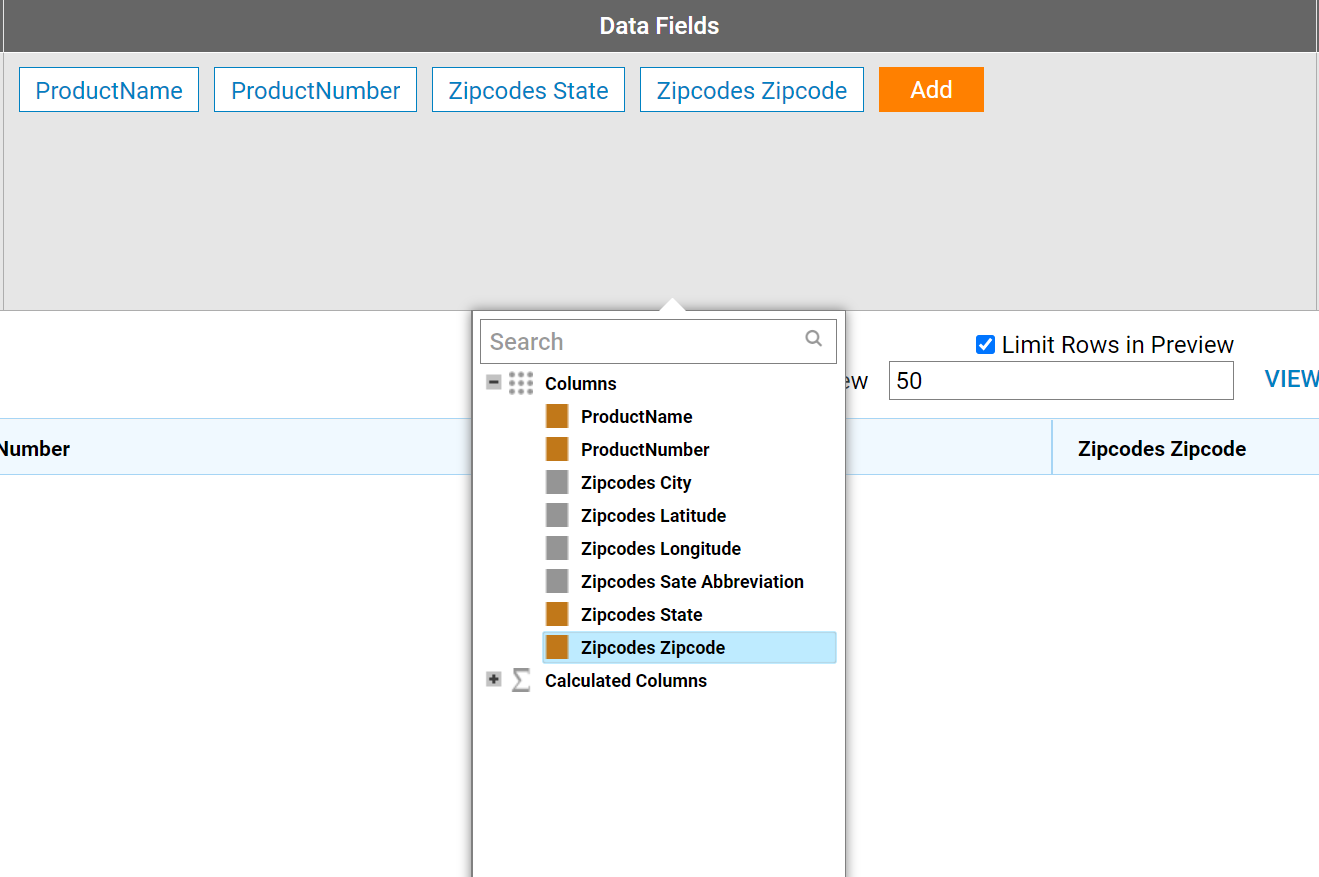
- When both tables from the Relationship have been added, fields from either table can be added as a column to the Report.
- When the columns are added and the Report is populated with Data, a user can Group or Filter data as needed.