Overview
The purpose of the Debugger is to ensure a Flow runs without errors. The Flow Debugger can be used to view how data transforms in the Flow and can be accessed from the Flow Designer. Because the Debugger runs Flows with additional processes to display contextual data for developers, the Debugger should not be used to gauge a Flow's performance.
Accessing the Flow Debugger
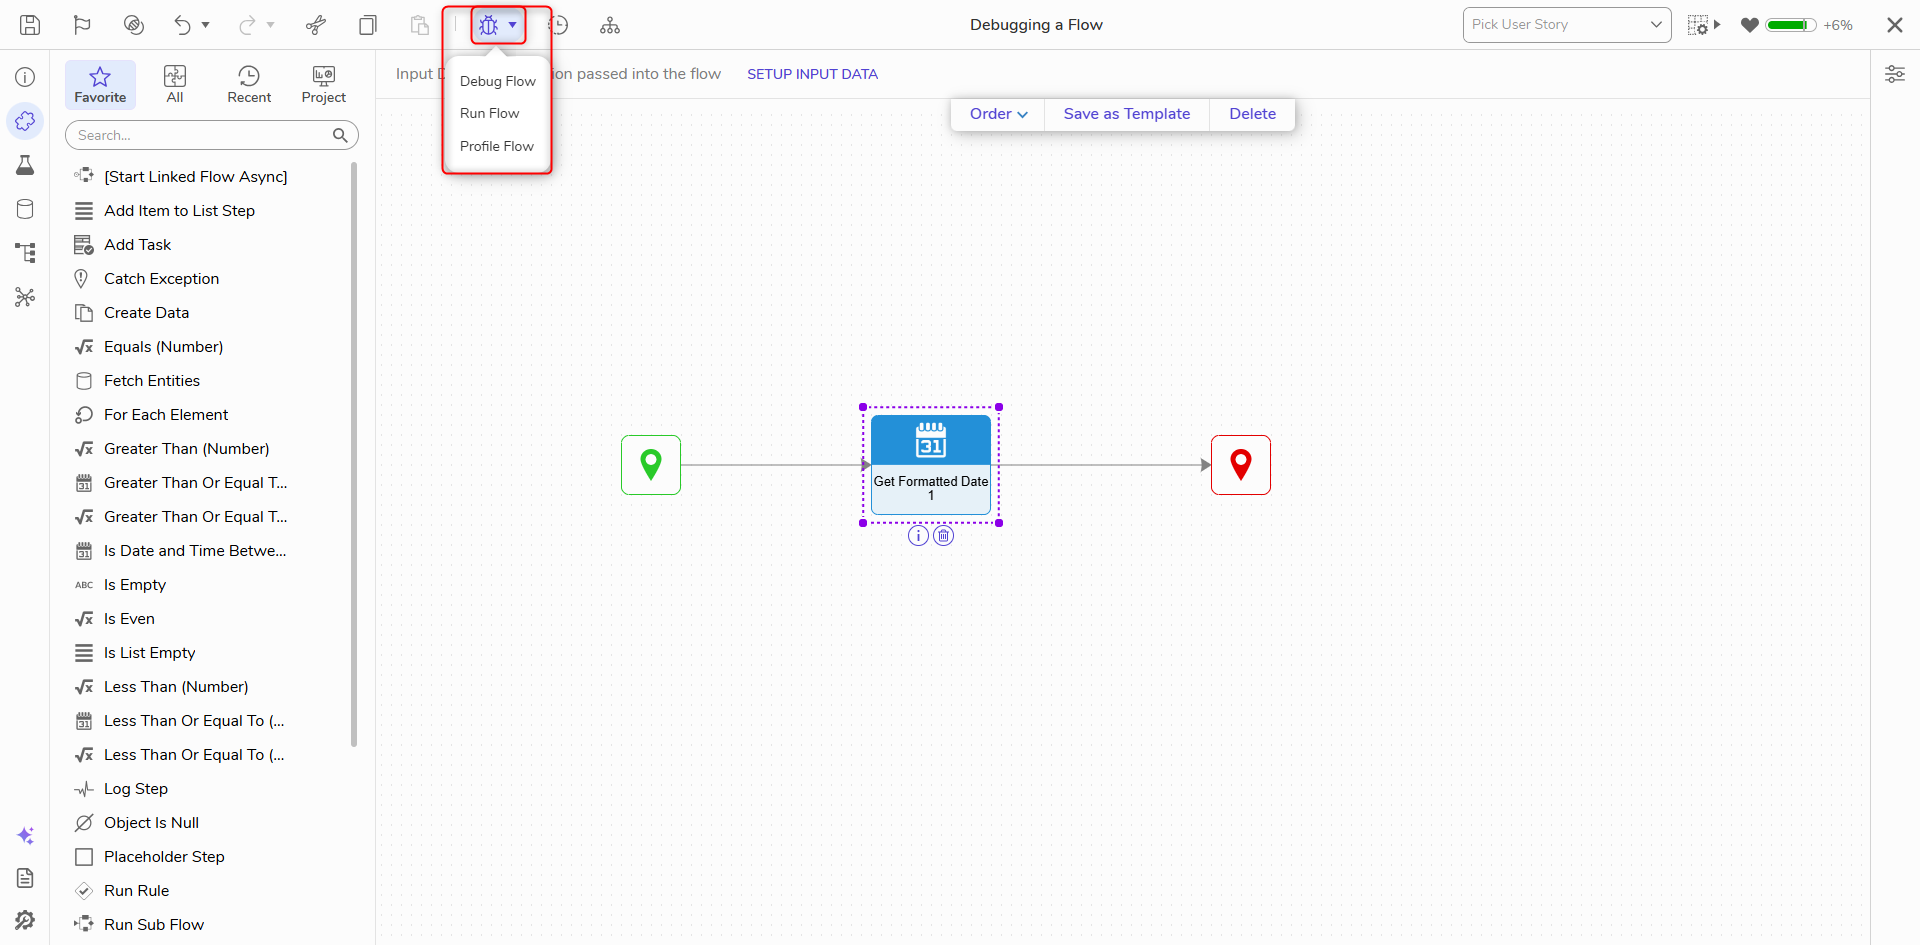
The Flow Debugger can be accessed by clicking Debug on the top action bar of the Flow Designer.
Starting the Flow Debugger
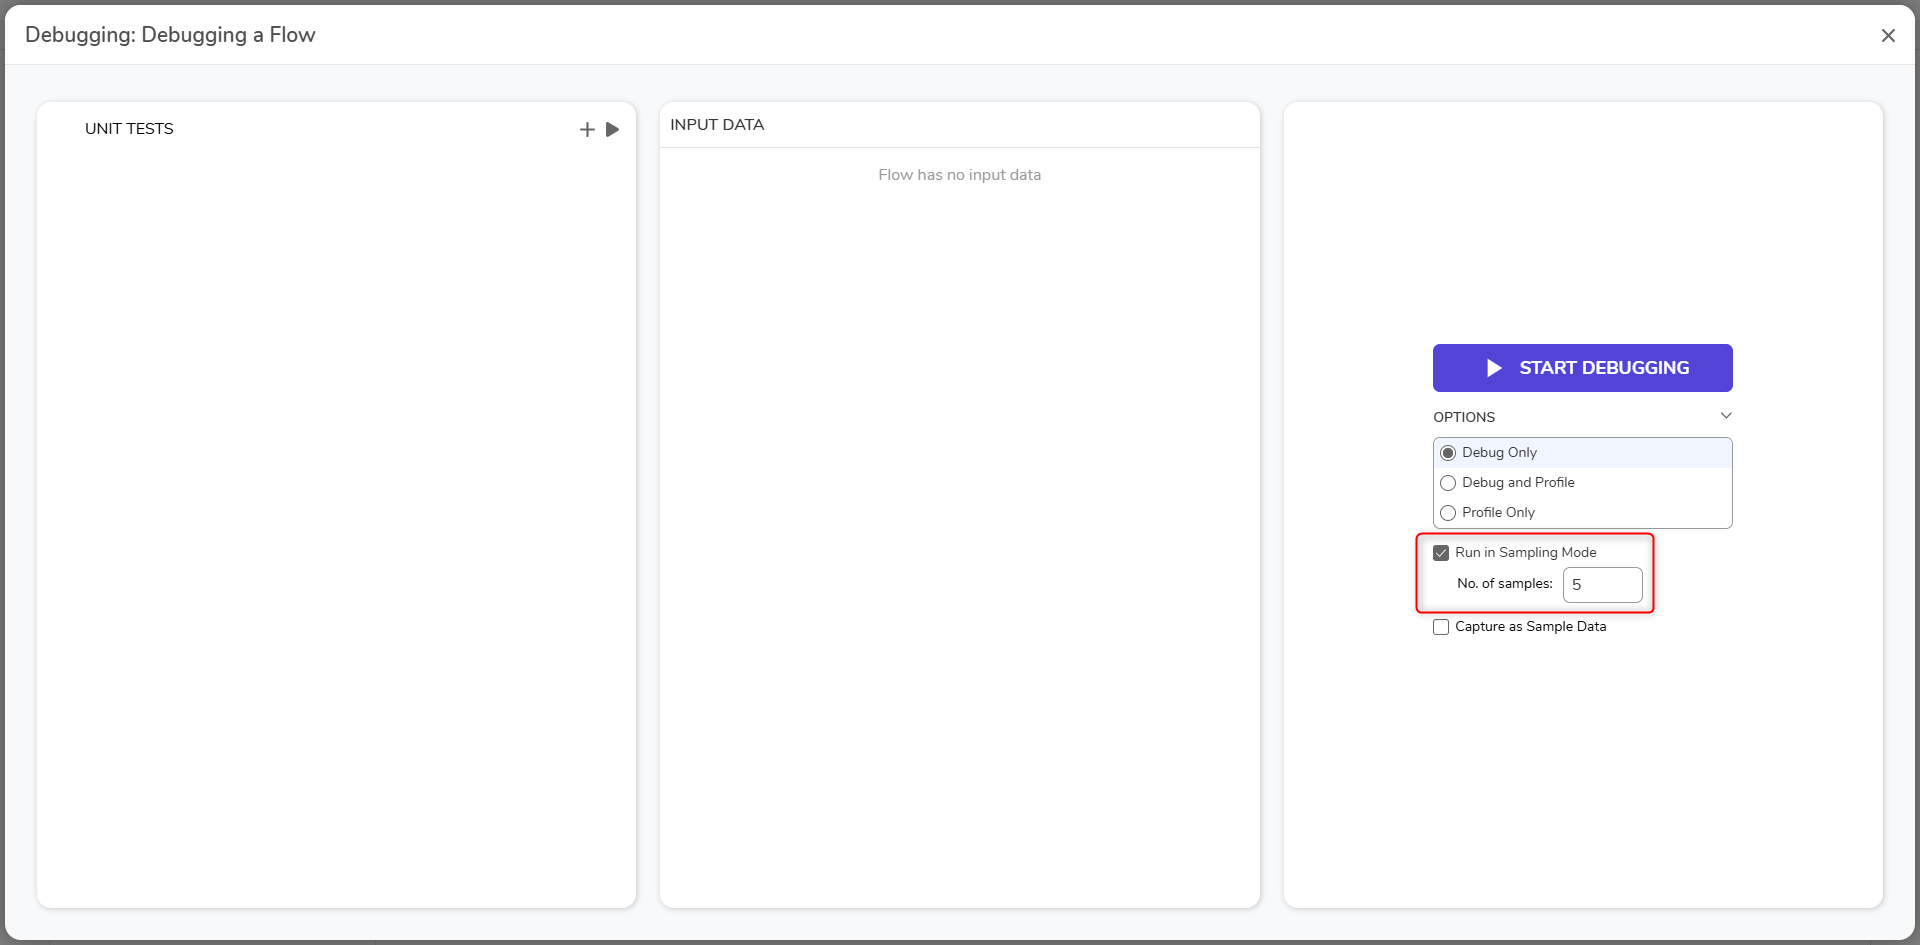
When the Debugger opens, there is a large START DEBUGGING button that will initiate the debugging process with the default settings. Expanding the OPTIONS section will display additional configurations such as running a Debug and Profile, Debug Only, or Profile Only session.
Refer to the article Troubleshooting Using the Profiler to learn more about Debug and Profile sessions.
In addition, the debugging test can Run in Sampling Mode, which reduces the size of the data set by debugging only a sample of the data. This can ultimately help with performance when larger data sets are being used for testing. The last option is to Capture as Sample Data, which can be used to capture and store the debugging data as sample data.
Sampling Mode:
By default, the Flow Debugger, Unit Tests, and Sample Data are set to run in "Sampling Mode." In Sampling Mode, the Debugger records the data for only five out of all the iterations it is supposed to run. It captures the data of the first two and last three iterations, respectively. This helps reduce memory consumption and makes the debugger faster.
Users can configure the sampling value and run the Flow in sampling mode for 5 to 100 iterations.
Project-level Sampling Mode Setting
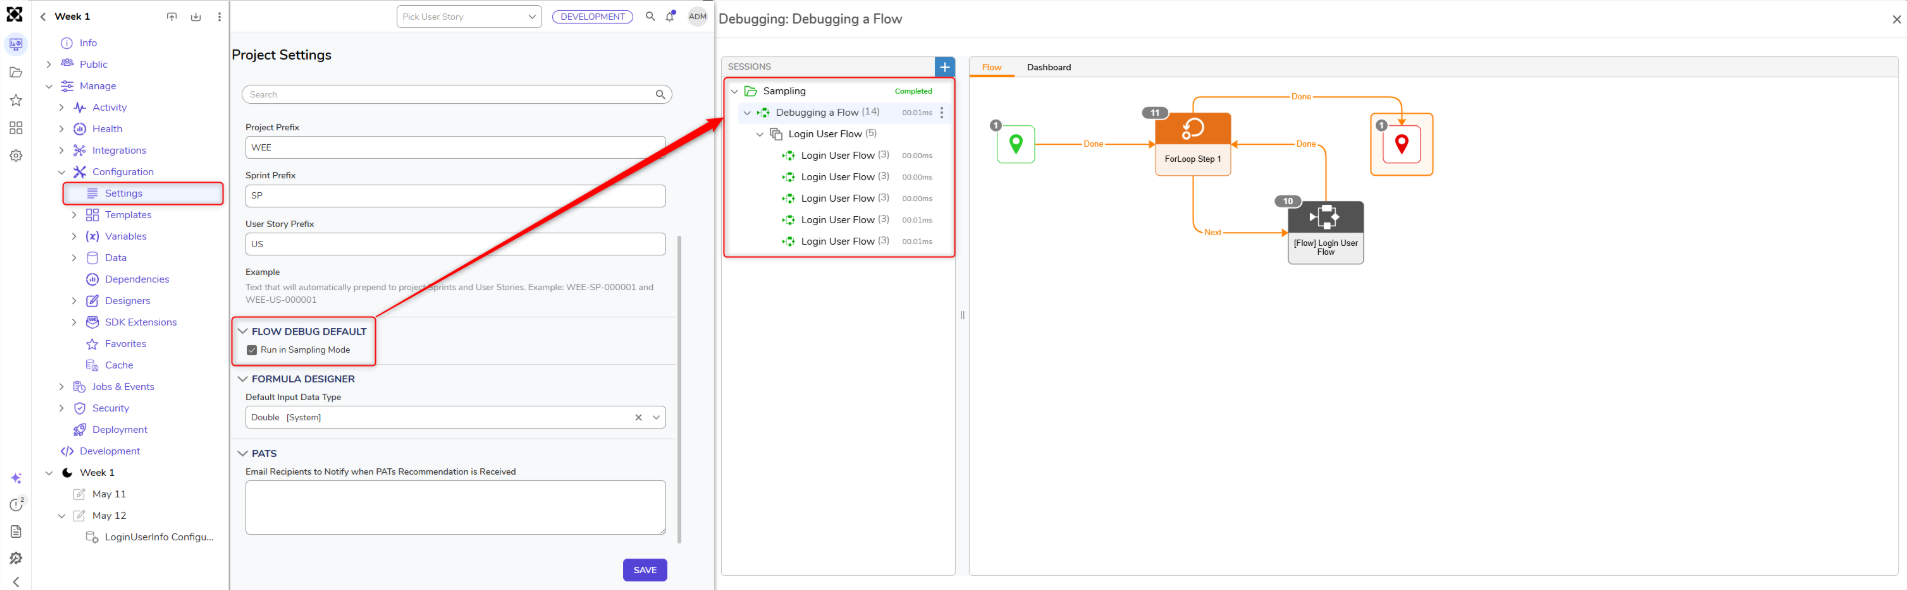
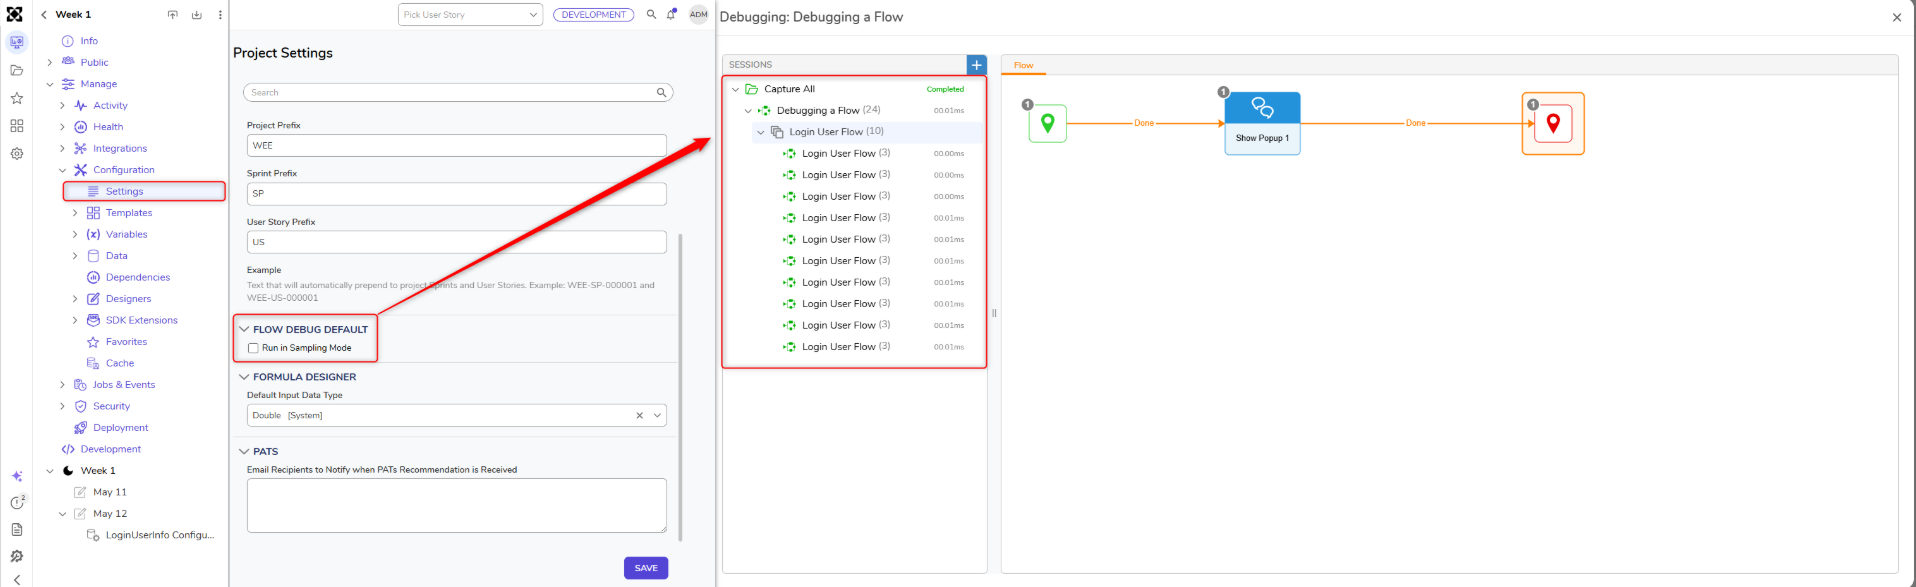
A project-level setting called Flow Debug Default includes a Run in sampling mode option. If this is enabled, the debugger will continue to use only a sample of the data during debugging, as previously described. However, if this setting is disabled, the debugger will use all available Flow data rather than just a sample. This enhancement provides greater flexibility in processing data during debugging, allowing teams to choose between faster, memory-efficient sampling or comprehensive, full-data debugging based on their project needs.
The images below illustrate the difference between debugging with sampling mode enabled and disabled.
Running the Flow Debugger
After starting the Flow Debugger, there will be three tabs: Flow and Dashboard.
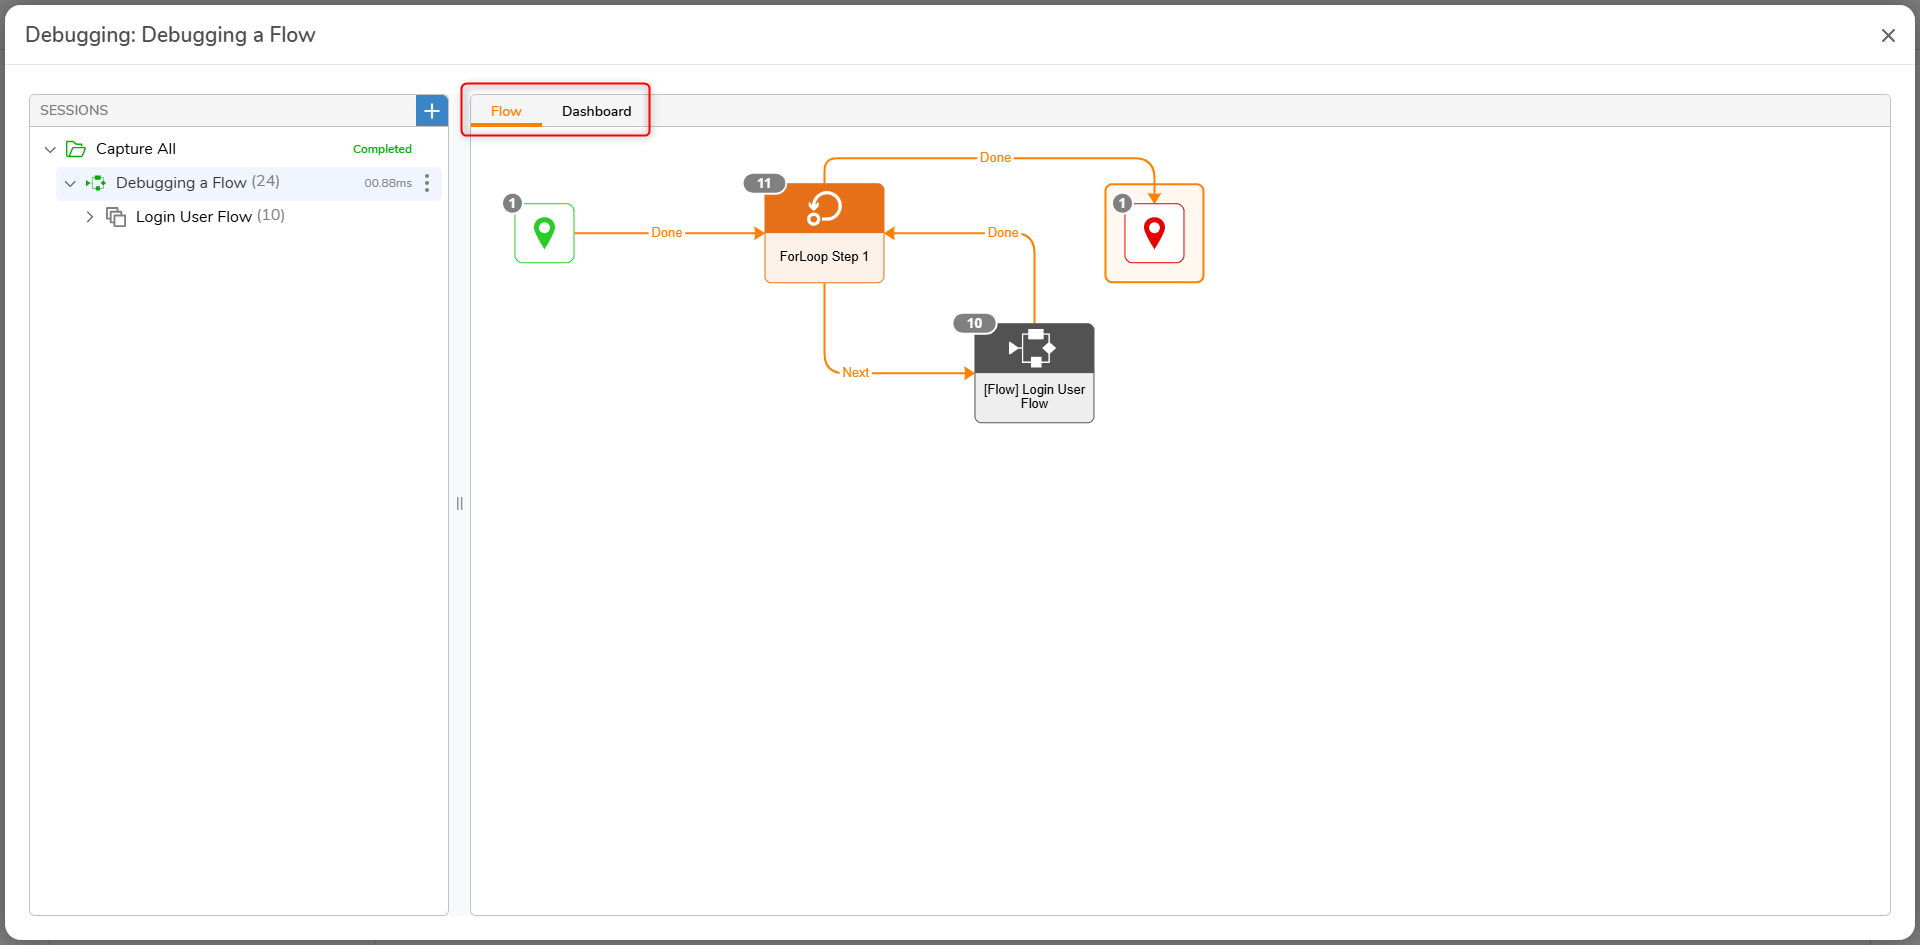
When Users select the Debug and Profile option, an additional tab called Profile Page will appear. 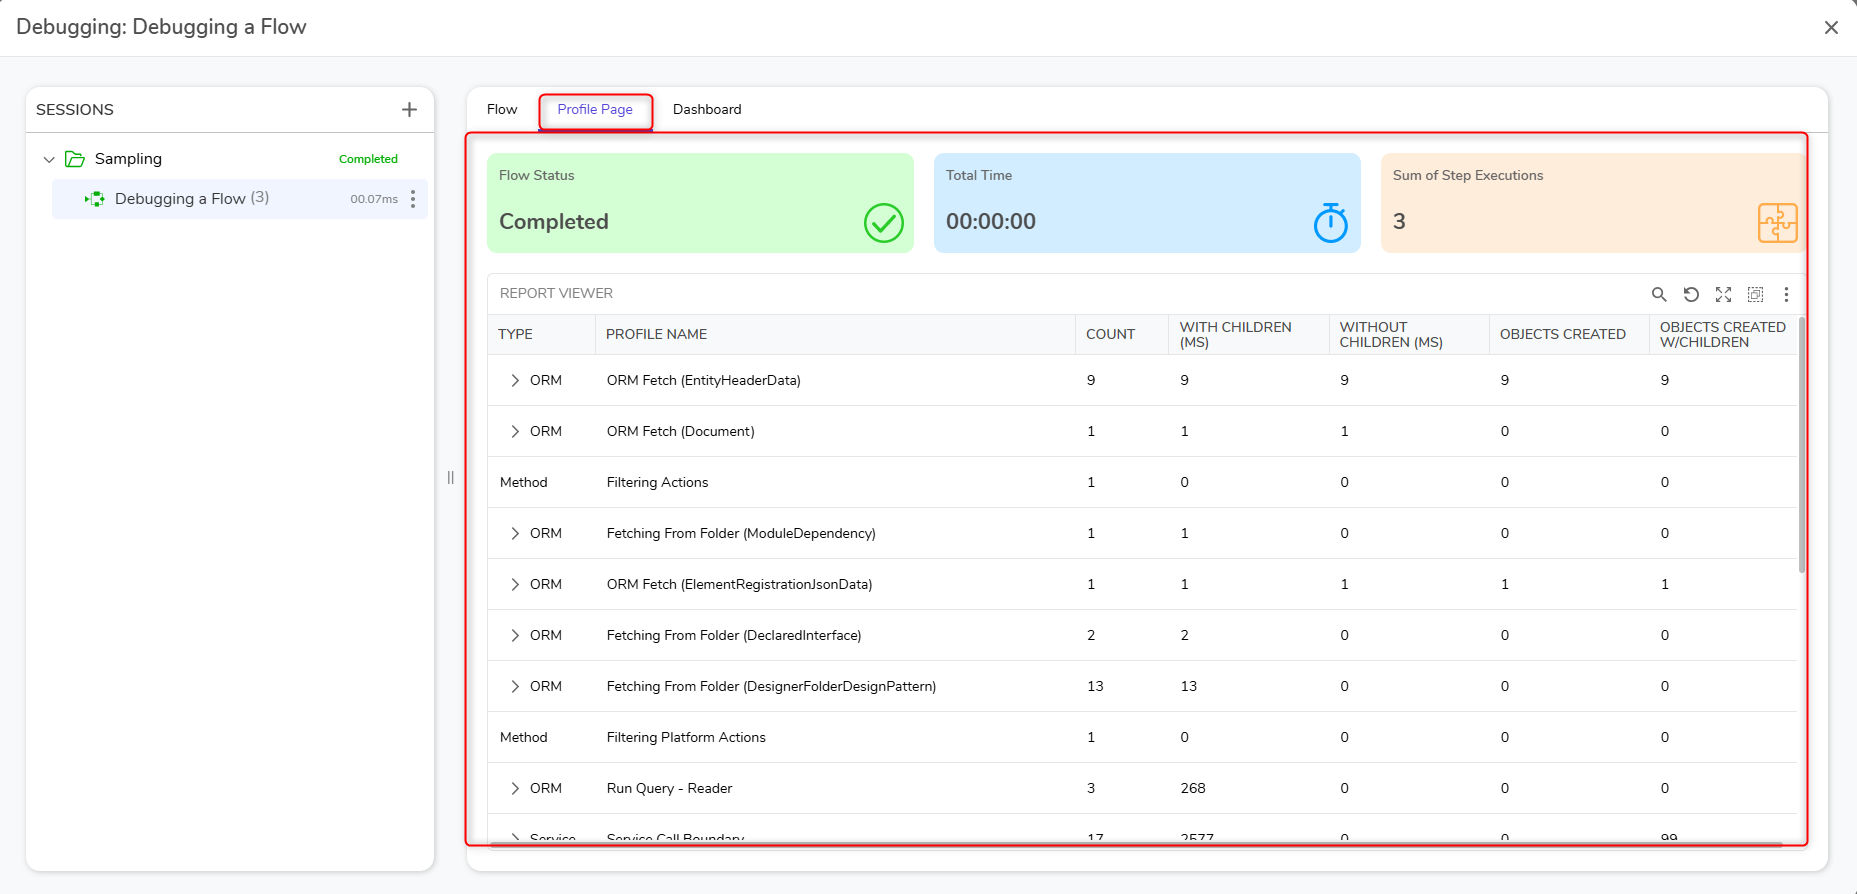
Step Inspection
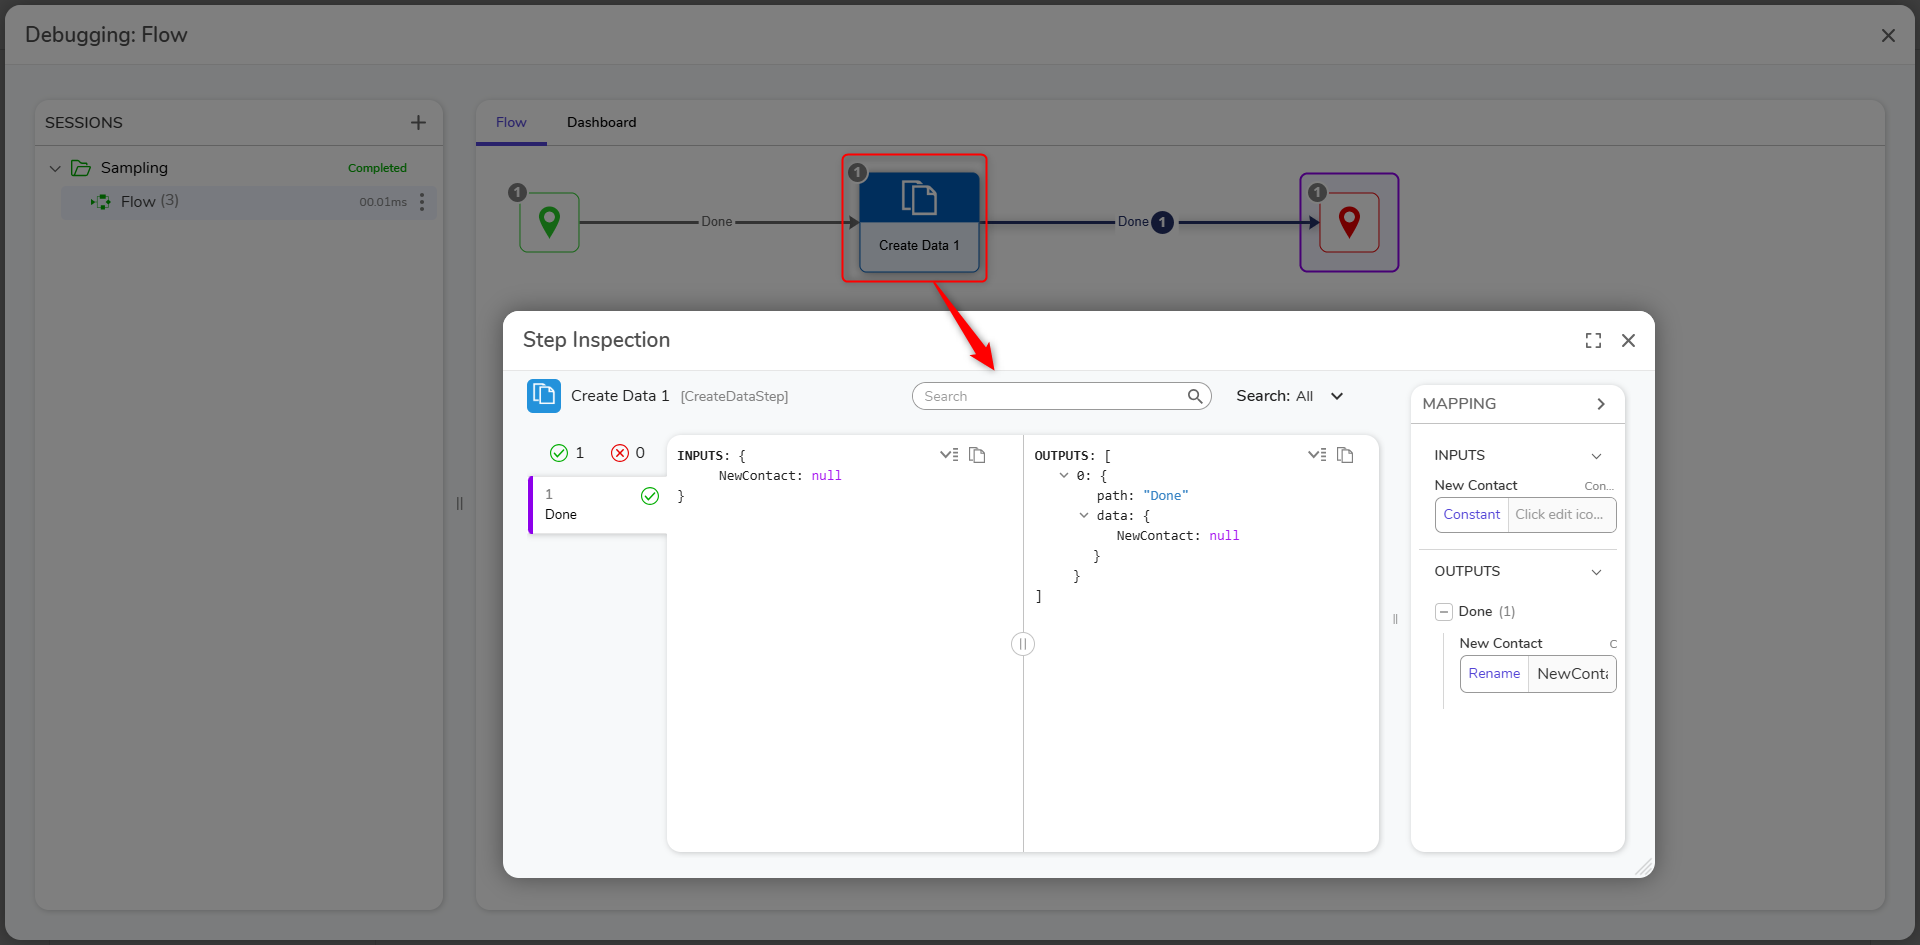
Clicking on the steps within the Flow provides the ability to view that step's Input Data, Output Data, and Step Info by selecting the step.
Flow Debugger Enhancements
After a debug session completes, select a step in the debugger to view its inputs, outputs, and other debug details. Refer to the following image: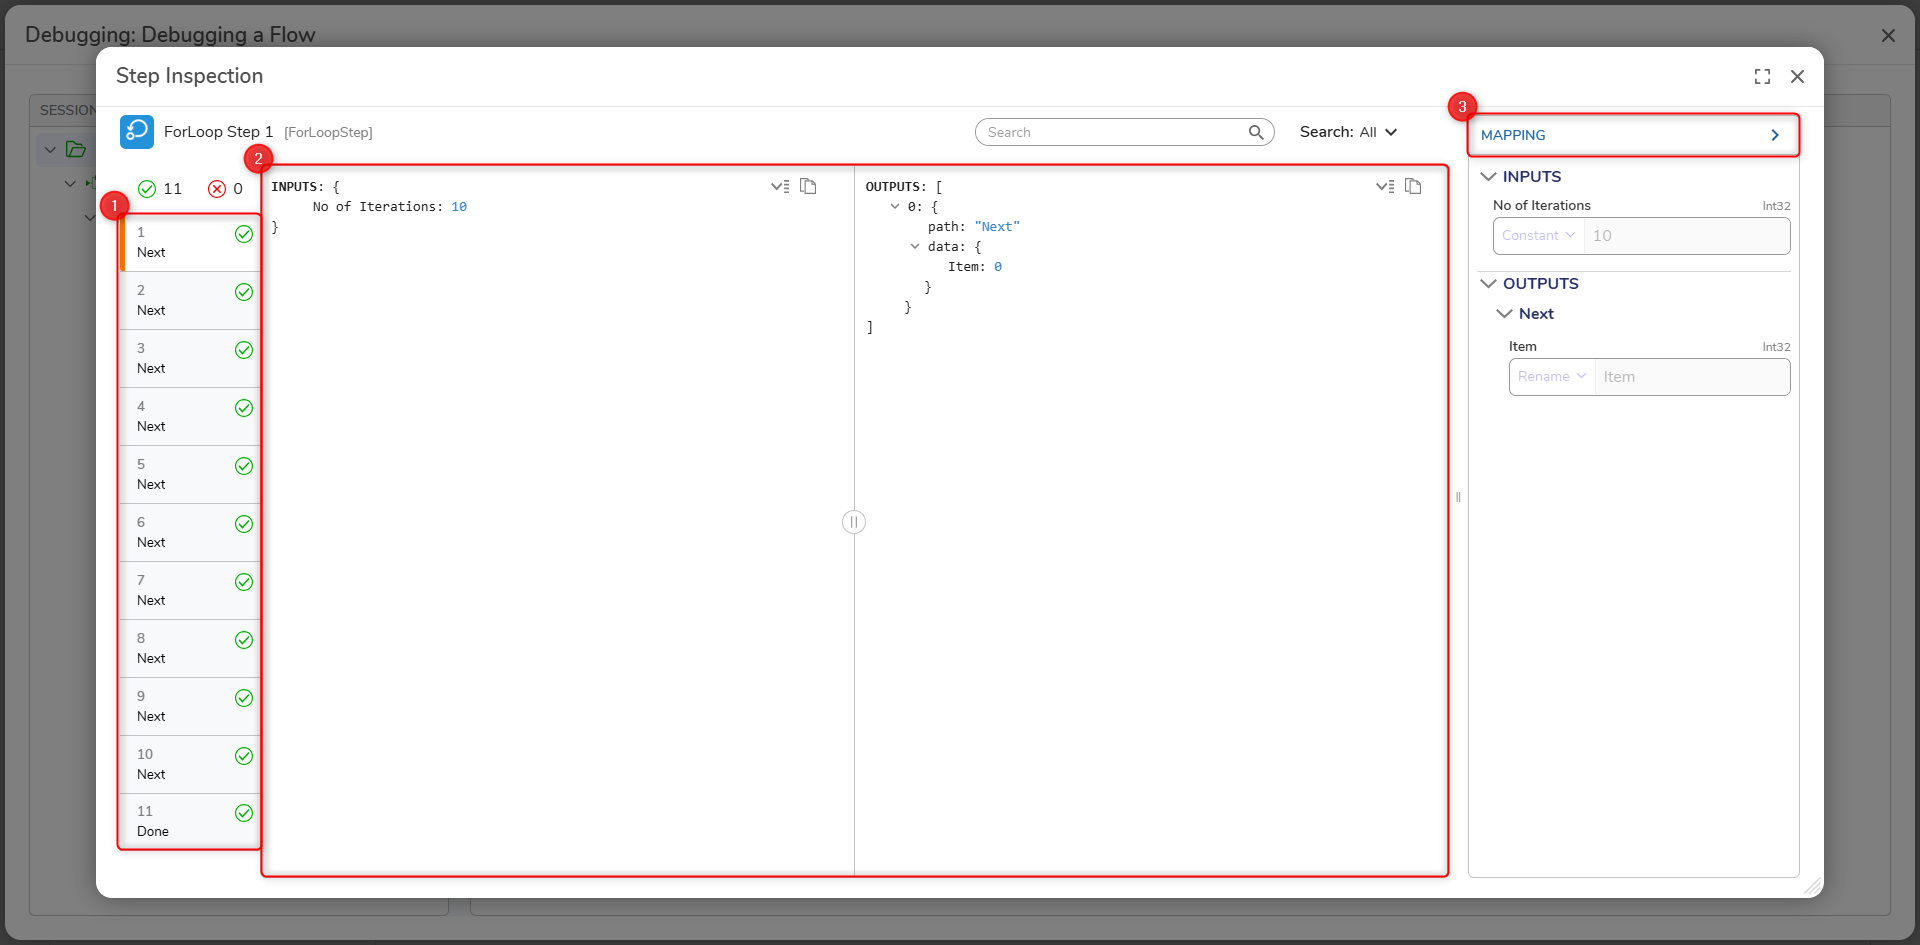
- Step Execution Count: This Panel on the left shows all the step execution iterations. If a Flow uses a For Each or For Loop step, which loops the Flow through steps and runs the step multiple times. This list shows all the iterations that the step has gone through. Users can click on any iteration to view the data for that specific iteration.
- Input & Output View: This section shows all input and output data associated with the selected step. Users can copy inputs or outputs individually using the copy button in the top-right corner. The splitter between panels can be dragged to adjust the view, and a search bar allows Users to quickly find specific data within the inputs and outputs.
- Mappings Panel: This panel, similar to the Step Properties panel, is read-only and displays the mapping types and data passed through the step. It helps Users understand how data is mapped and transferred within the flow.
Sub Flows and the Debugger
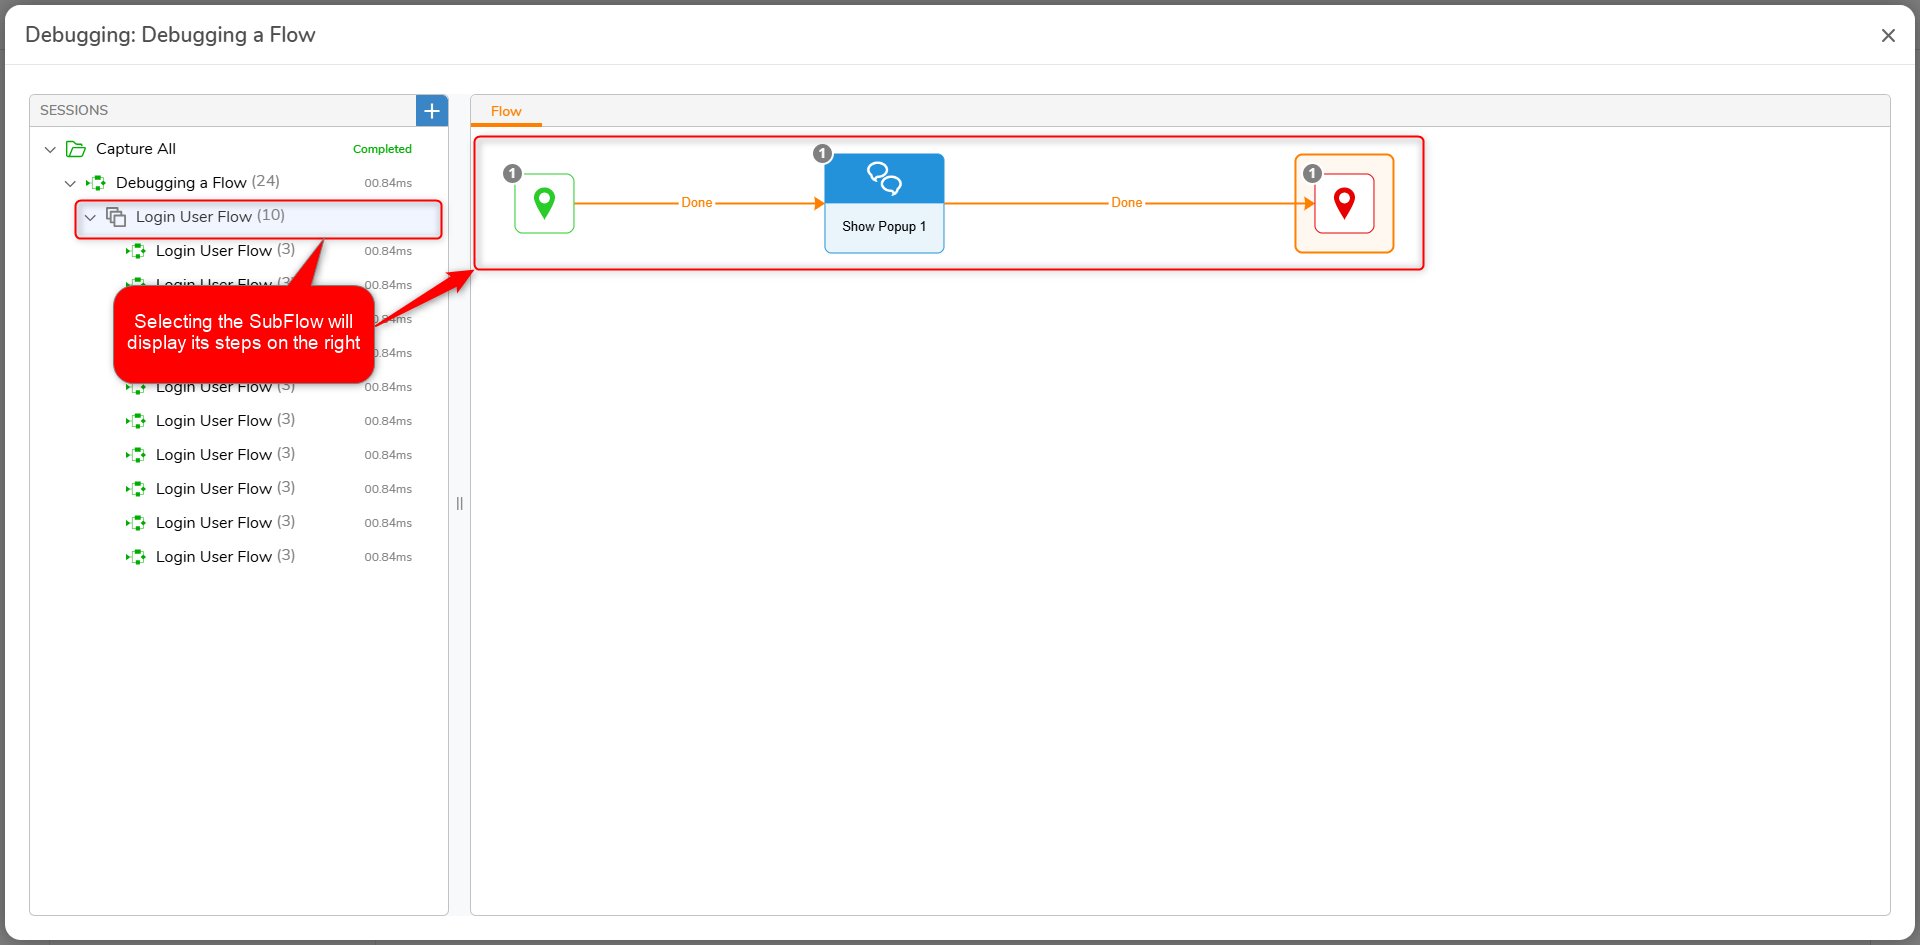
Sub Flows can be viewed within the Debugger. They appear underneath the Flow on the left side of the screen. Clicking on the name of the Sub Flow will show its steps on the right.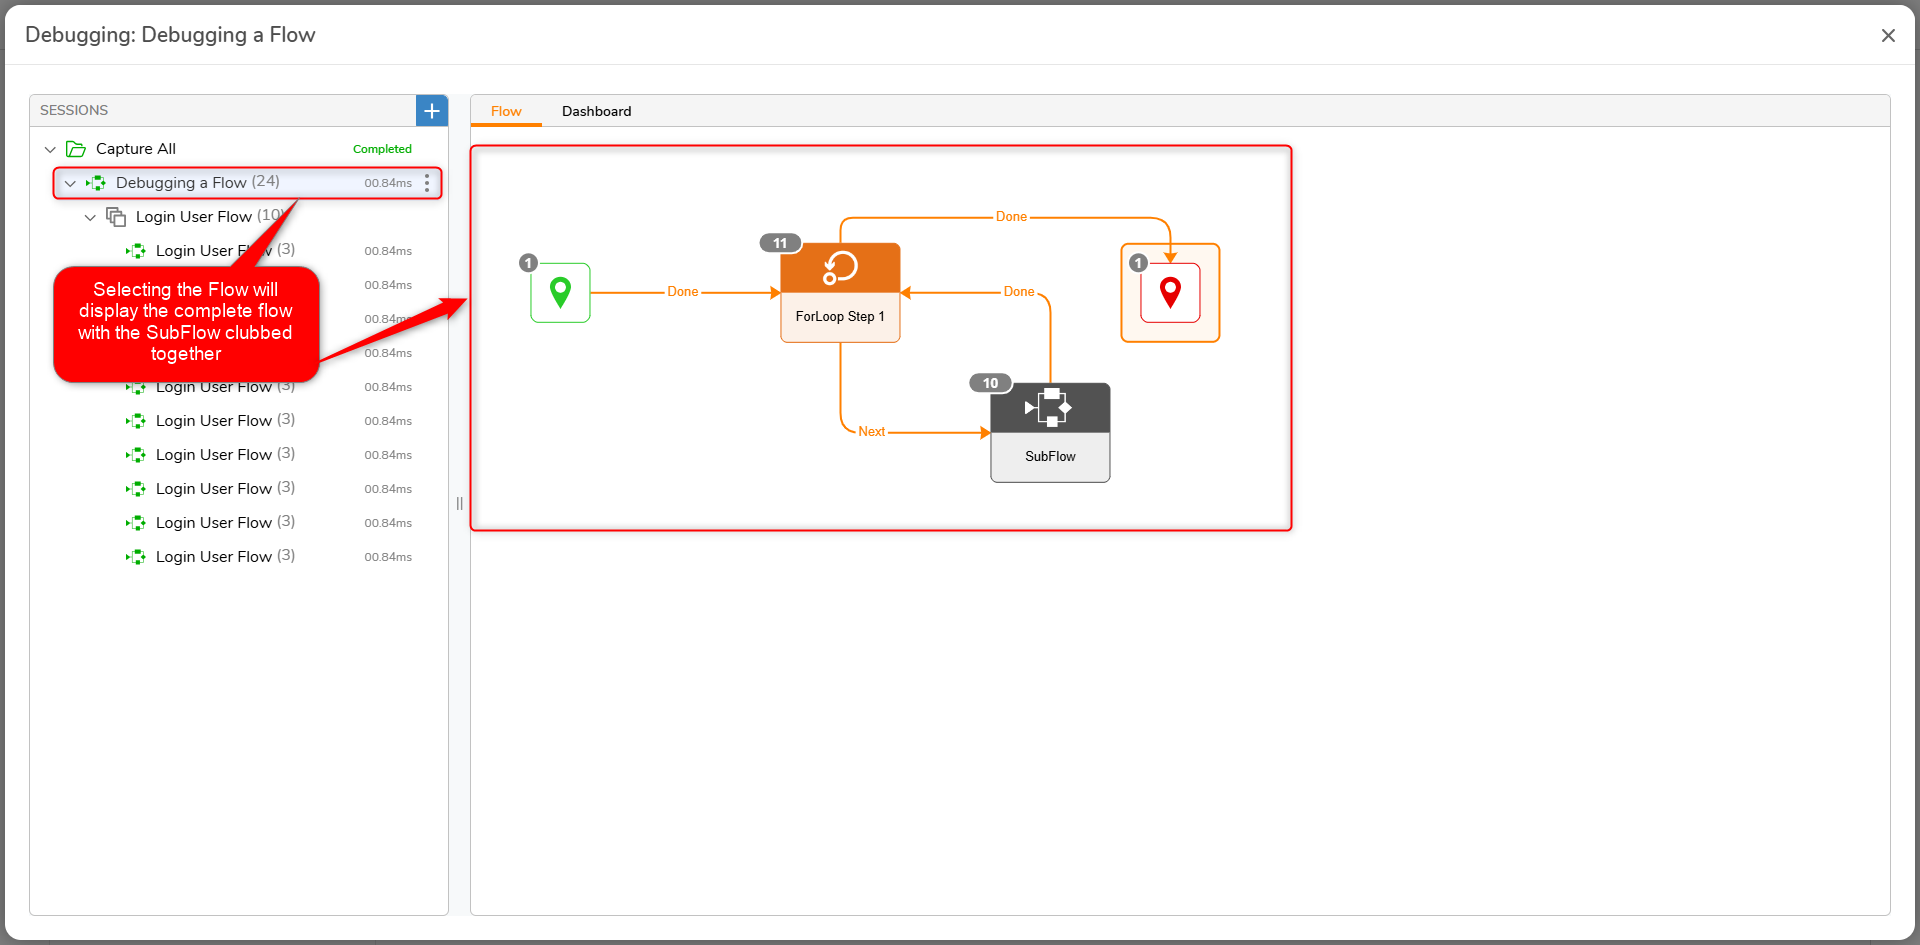
The Debug Report Page provides a simple Report of the steps within the Flow. This Report has been deprecated in v9.14. Users can now access the same report through the new Dashboard by switching reports via the Report Edit option.
The Dashboard
The Dashboard provides a snapshot of the executed Flow. The tiles on the left-hand side display the Total Time it took for the Flow to execute, the Number of Steps, the Number of Flows, the Number of Rules, the Number of Flows, and the Number of Exceptions. This Dashboard is displayed as a Report but can be viewed in a different form by clicking Change Report.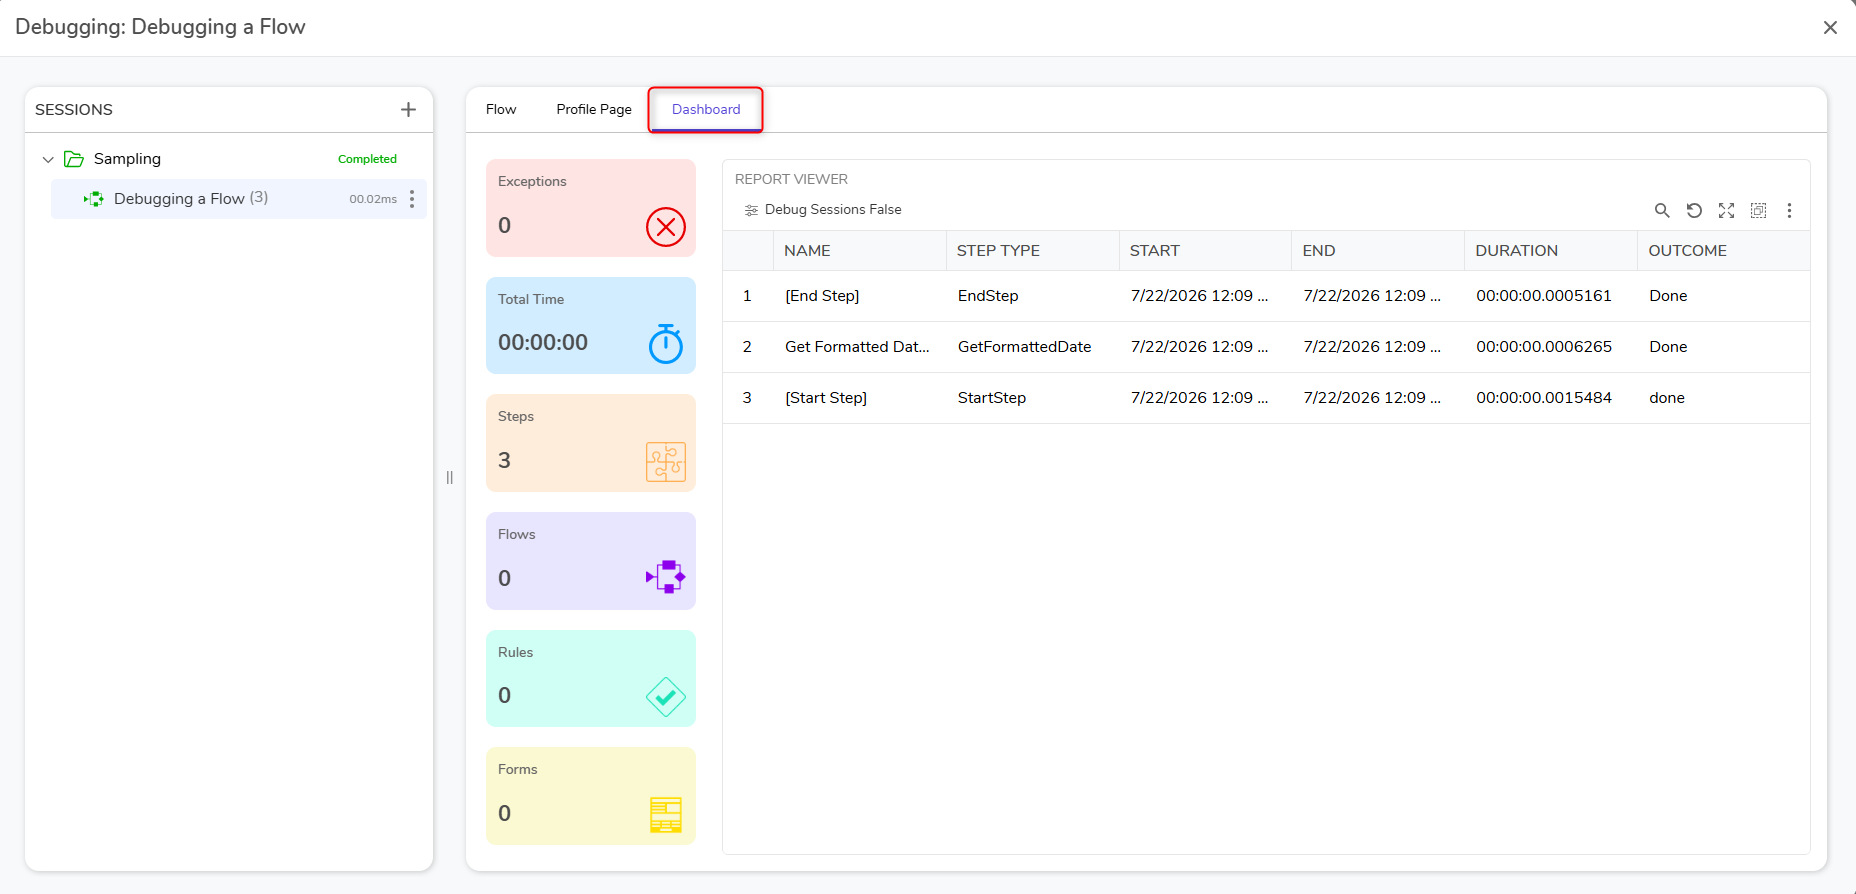
Flow Debugger Icon Guide
| Icon | Description |
|---|---|
 | This icon appears when a Flow is run. |
 | This icon appears when a Rule is run. |
 | This icon appears when a Form is run. |
Remember to the Recent List
Setting the Remember to the Recent List checkbox in the Edit Designer Settings window to true will save the current run in the Debugger in the Data Samples back in the Flow Designer.
This default option can be turned off and on in System > Settings > Designer Studio Settings, under the FLOW DEBUG DEFAULT category.
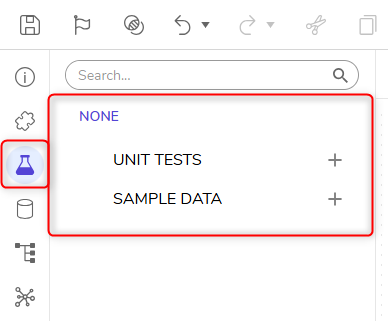
After the Debugger runs and Remember to the Recent List is set to true, the run will be saved in the Samples/Unit Tests panel in the Designer. Under Sample Data > [Flow Name], there will be the saved version of the previously run Debugger. Each time the Debugger is run, and this option is on, it will save a new Sample Data that can be Debugged again. The magnifying glass will show what input was used for that run, and the save icon will allow the ability to save that run as a Unit Test or Data Sample.