Overview
Grafana Loki is a log aggregation tool that allows users to get logs from different Decision nodes into one place. This document demonstrates how to set up the Grafana and Loki for Decisions. For more information, refer to Grafana Loki Documentation.
Prerequisite
- Loki Server
- Grafana
Note: Both applications can be hosted on-premises or on Grafana Cloud.
Access Policies
To interact with the Grafana Cloud API, users must create two access policies. These access policies must be configured with the scope to Read and Write the Logs. Users must generate API tokens under both access policies. Specifically, the API Token with Read scope will enable Grafana to retrieve data from the Loki server, while the API Token with Write scope will facilitate Decisions in writing logs to the Loki server.
Configuring Loki Server in Decisions
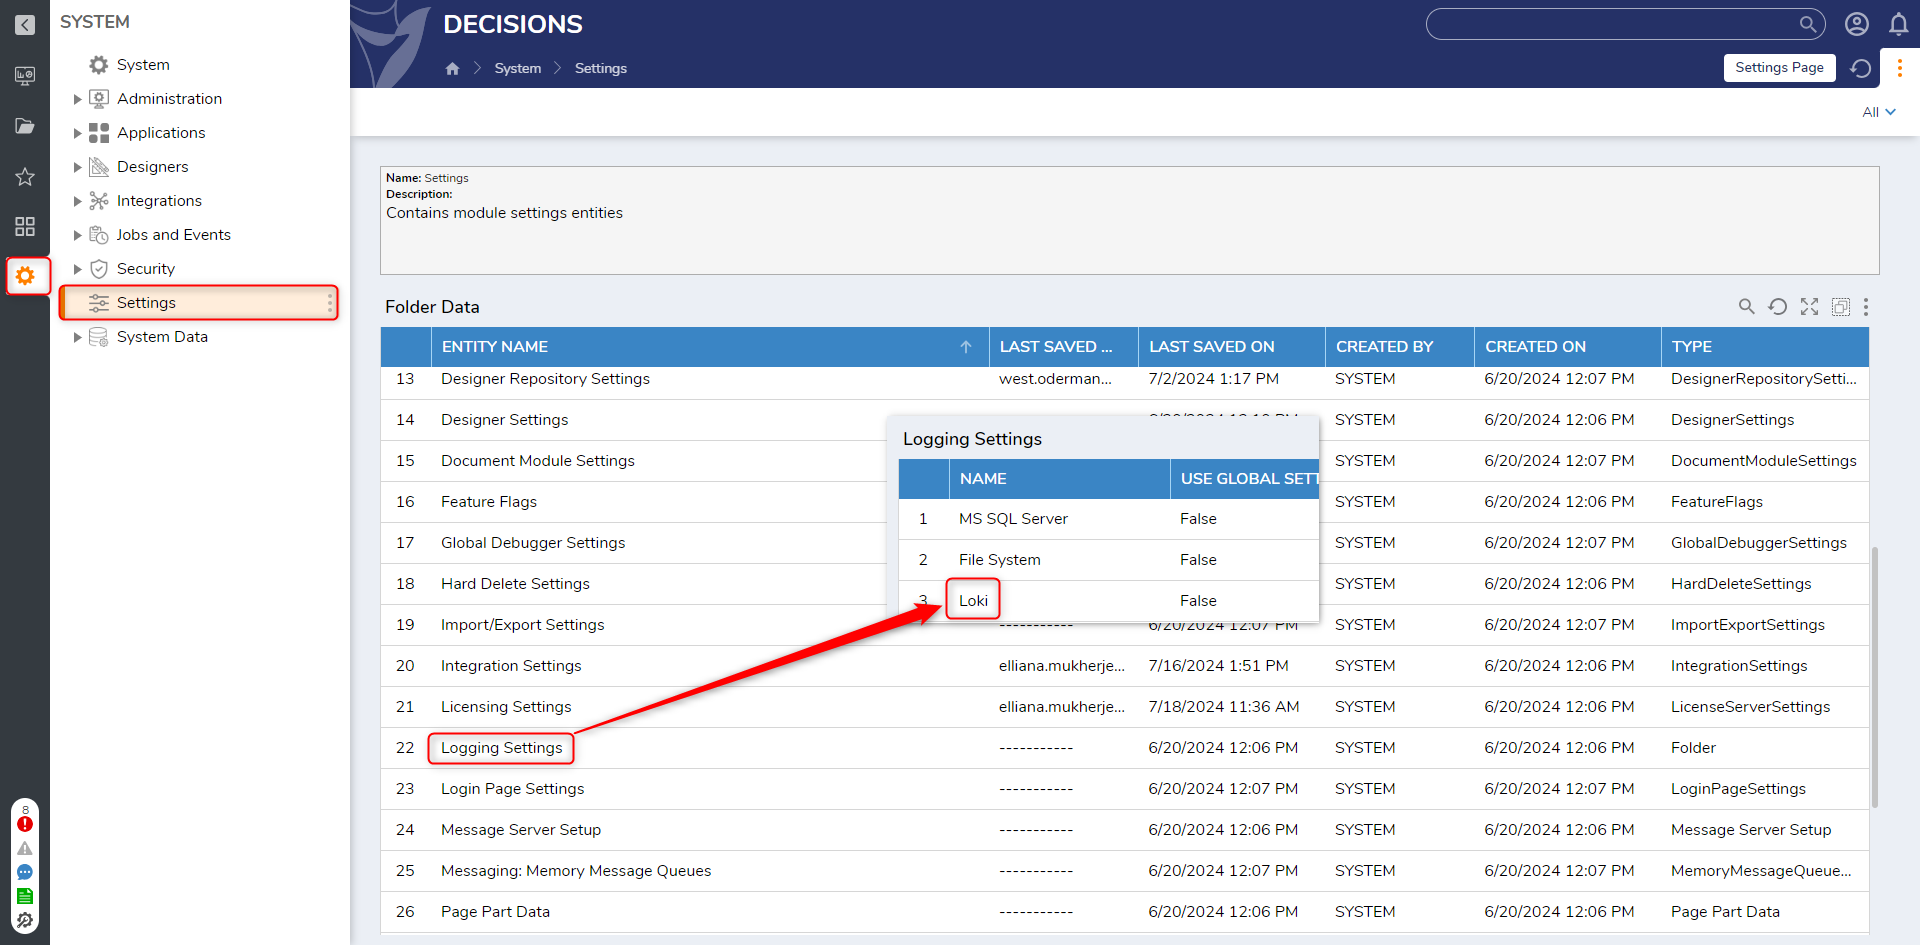
- Log in to Decisions Studio, navigate to System > Settings > Logging Settings > Loki.

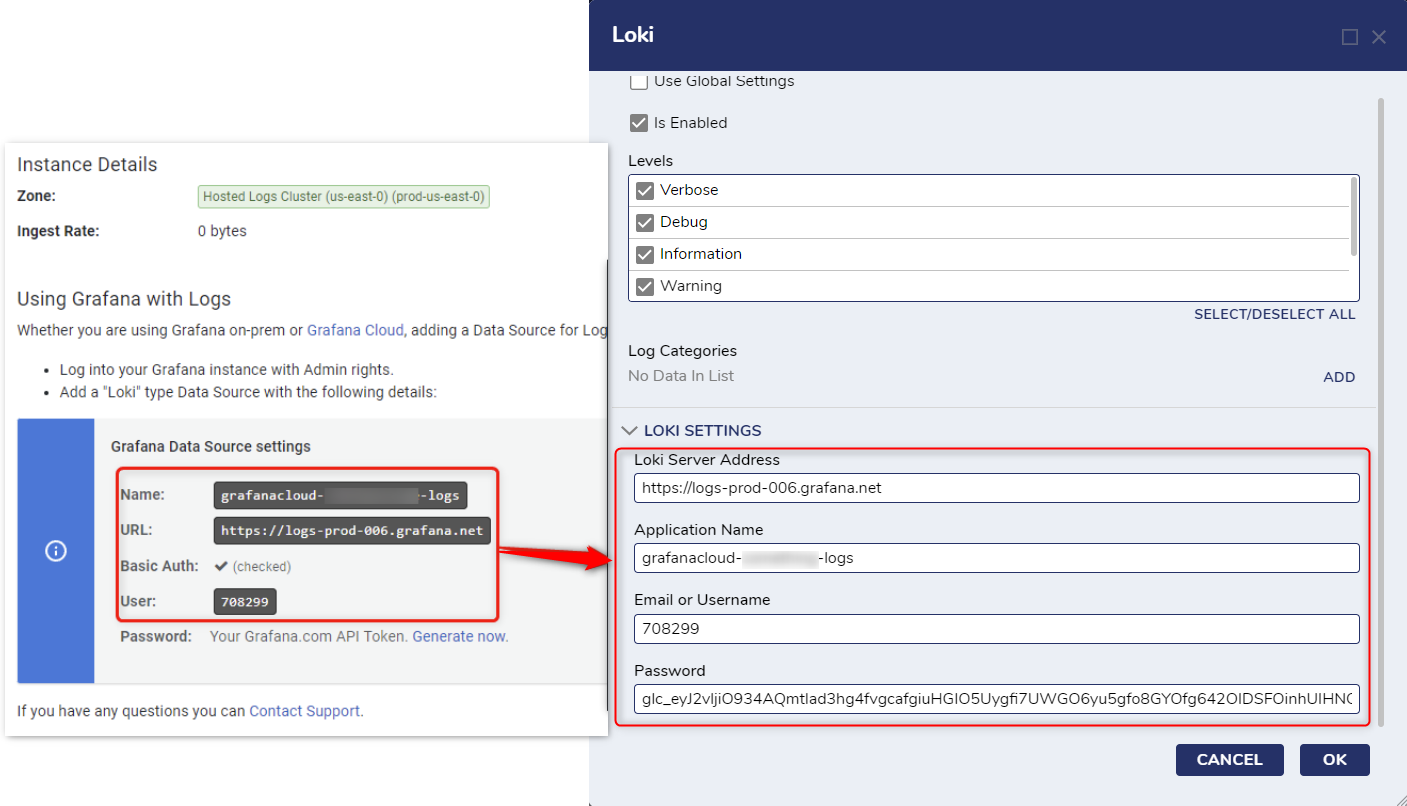
- Configure the following settings from the Loki window.
*Not a compulsory field. If left blank, no authentication is added to the headers.Setting Name Description Use Global Settings This will follow the settings configured under the Global Log settings, located at System > Settings > Logging Settings > Global. Is Enabled Enables the logging to the Loki Server. Levels Allows to select the Log Level. Loki Server Address Enter the Loki Server Address. - If Grafana is hosted on-premises, ensure to use the IP and the port number.
http://[System IP]:[Port Number]. - If using the Loki server on Grafana Cloud, the server address should resemble this format.
https://[Domain Name].
Application Name Enter the name of the application under which you want to store the logs. If no name is given, a new "Decisions" app will be created on the server to store the logs. Email or Username* Enter the User ID, which can be found at Grafana Stack. grafana.com/orgs/yourorganziation/hosted-logs/[User Id]Password* Enter the API Token generated for the access policy that is configured with Write Scope. 
- If Grafana is hosted on-premises, ensure to use the IP and the port number.
Configuring Loki Server in Grafana
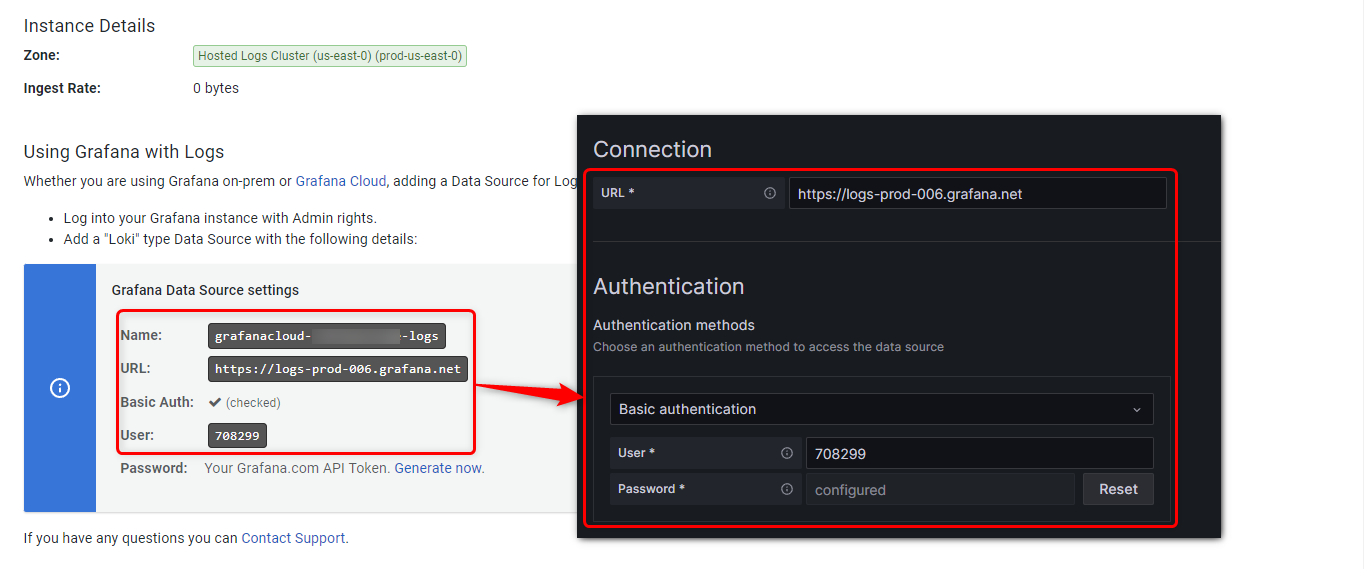
- Navigate to the Grafana server and configure the Loki data source. Refer to the following table for required fields.
Setting Name Description Loki Server Address Enter the Loki Server Address. - If Grafana is hosted locally, ensure to use the IP and the port number. http://[System IP]:[Port Number]
- If using the Grafana Cloud, the server address should resemble this format. https://[Domain Name]
Authentication Methods > Basic authentication Not a compulsory field. If left blank, no authentication is added to the headers. User Enter the User ID, which can be found at Grafana Stack. grafana.com/orgs/yourorganziation/hosted-logs/[User Id]Password Enter the API Token generated for the access policy that is configured with Read Scope. 
- After configuring all the details, click on Save & test.
- The connection should be successful, and the following message should be displayed.

Troubleshooting the Loki Connection
Users might face a connection error with the following message

This validation will pop up when the URL in the Loki server is not the same as in the Decisions Loki settings. Ensure to push the Logs from the Decisions Server by configuring the server URL in Decisions Loki Settings first and then using the same URL in Loki Server so that the Loki database populates with the logs.
Accessing the Logs
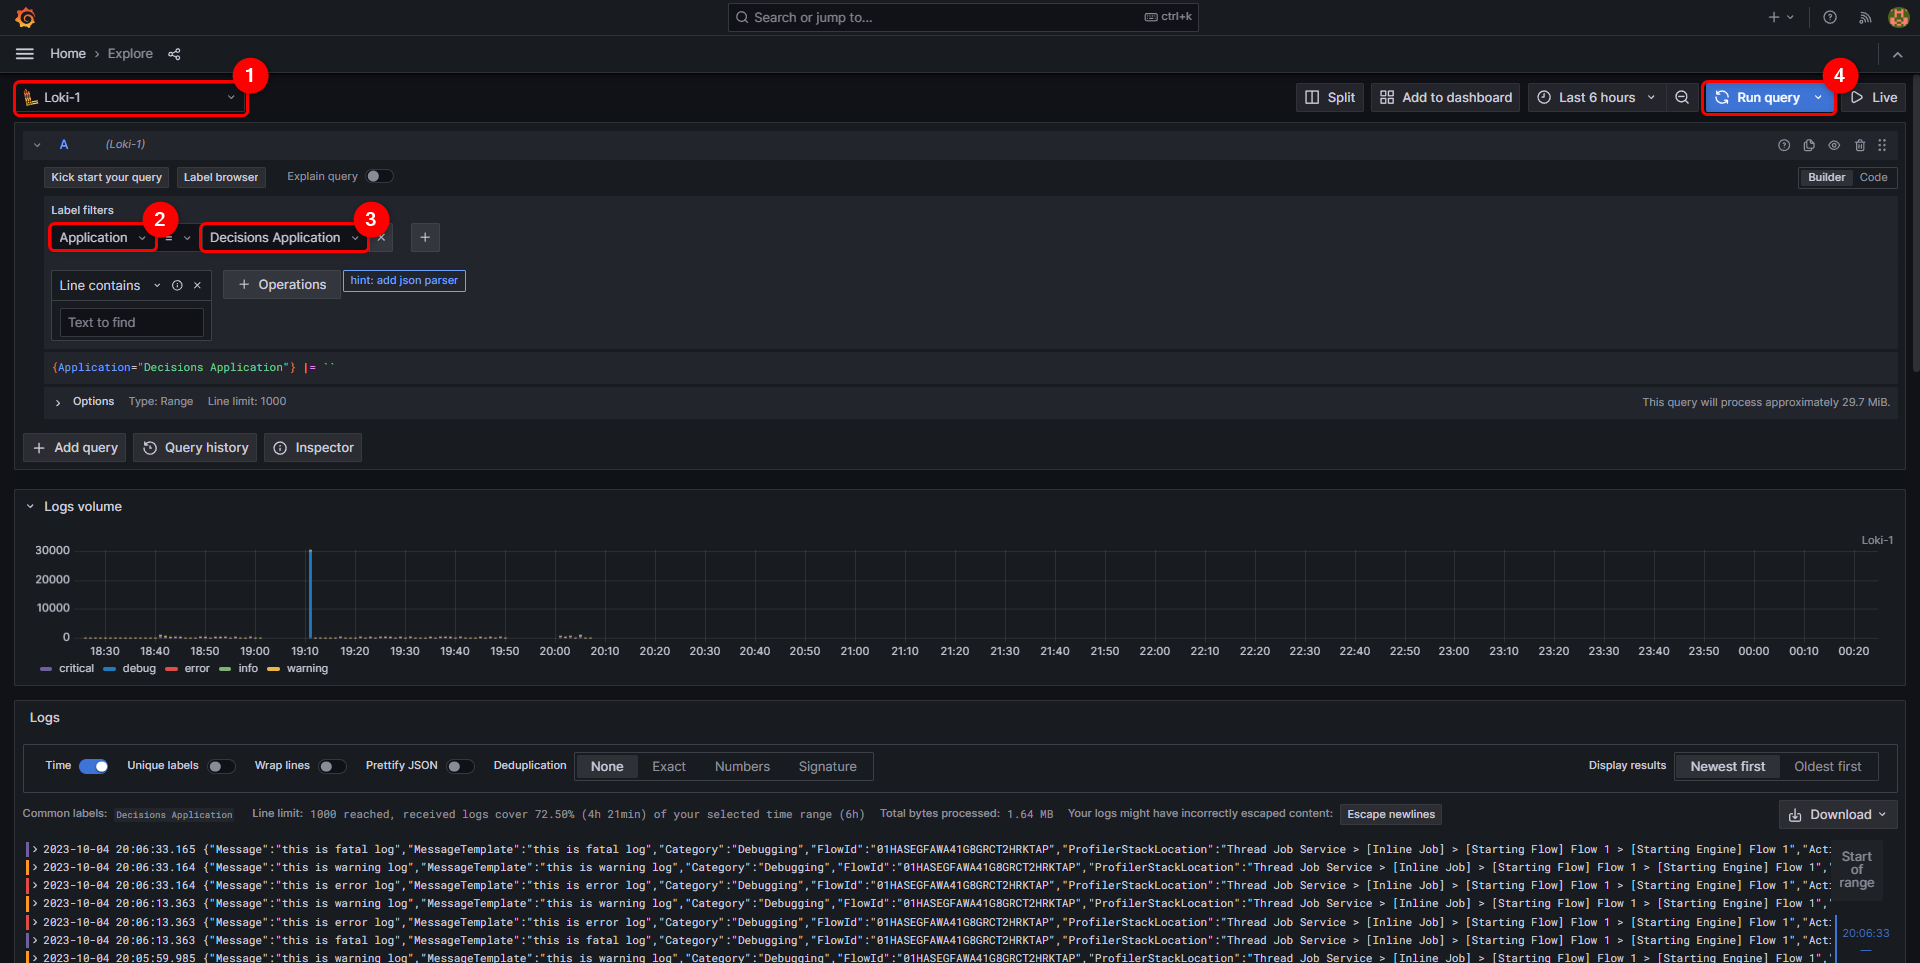
- Navigate to Grafana > Menu (Hamburger Button) > Explore.
- Select the desired Loki from the drop-down.
- Under Label Filters, set Application = [Application Name given in Decisions], and hit Run Query. The Logs will be generated.

Feature Changes
| Description | Version | Date | Developer Task |
|---|---|---|---|
| Add the Ability To Use Authenticated Loki Servers With Decisions | 8.15 | October 12, 2023 | [DT-038823] |