Overview
| Feature Details | |
| Introduced in Version | 9.14 |
| Modified in Version | --- |
The Custom Icons Field is a new Calculated Column type that enhances visual reporting in Reports and Advanced Data Grids. Instead of displaying raw text, this field allows designers to configure one or more icons within a column to visually represent data values. This improves data scan ability and saves space by replacing textual indicators with compact visual cues.
It is especially useful for displaying:
- User or account status
- Flags or warnings
- Data types or categories (e.g., admin vs. user)
- Conditional indicators based on values
Configuration
- In the Report Designer, select the Data Source. (Example: Account Data Source)
- Add any desired columns to the report, such as:
- Email Address
- Department
- User Type (used for logic, not displayed)
- Hidden (used for logic, not displayed)
- Add a CustomIconsField Calculated Column.
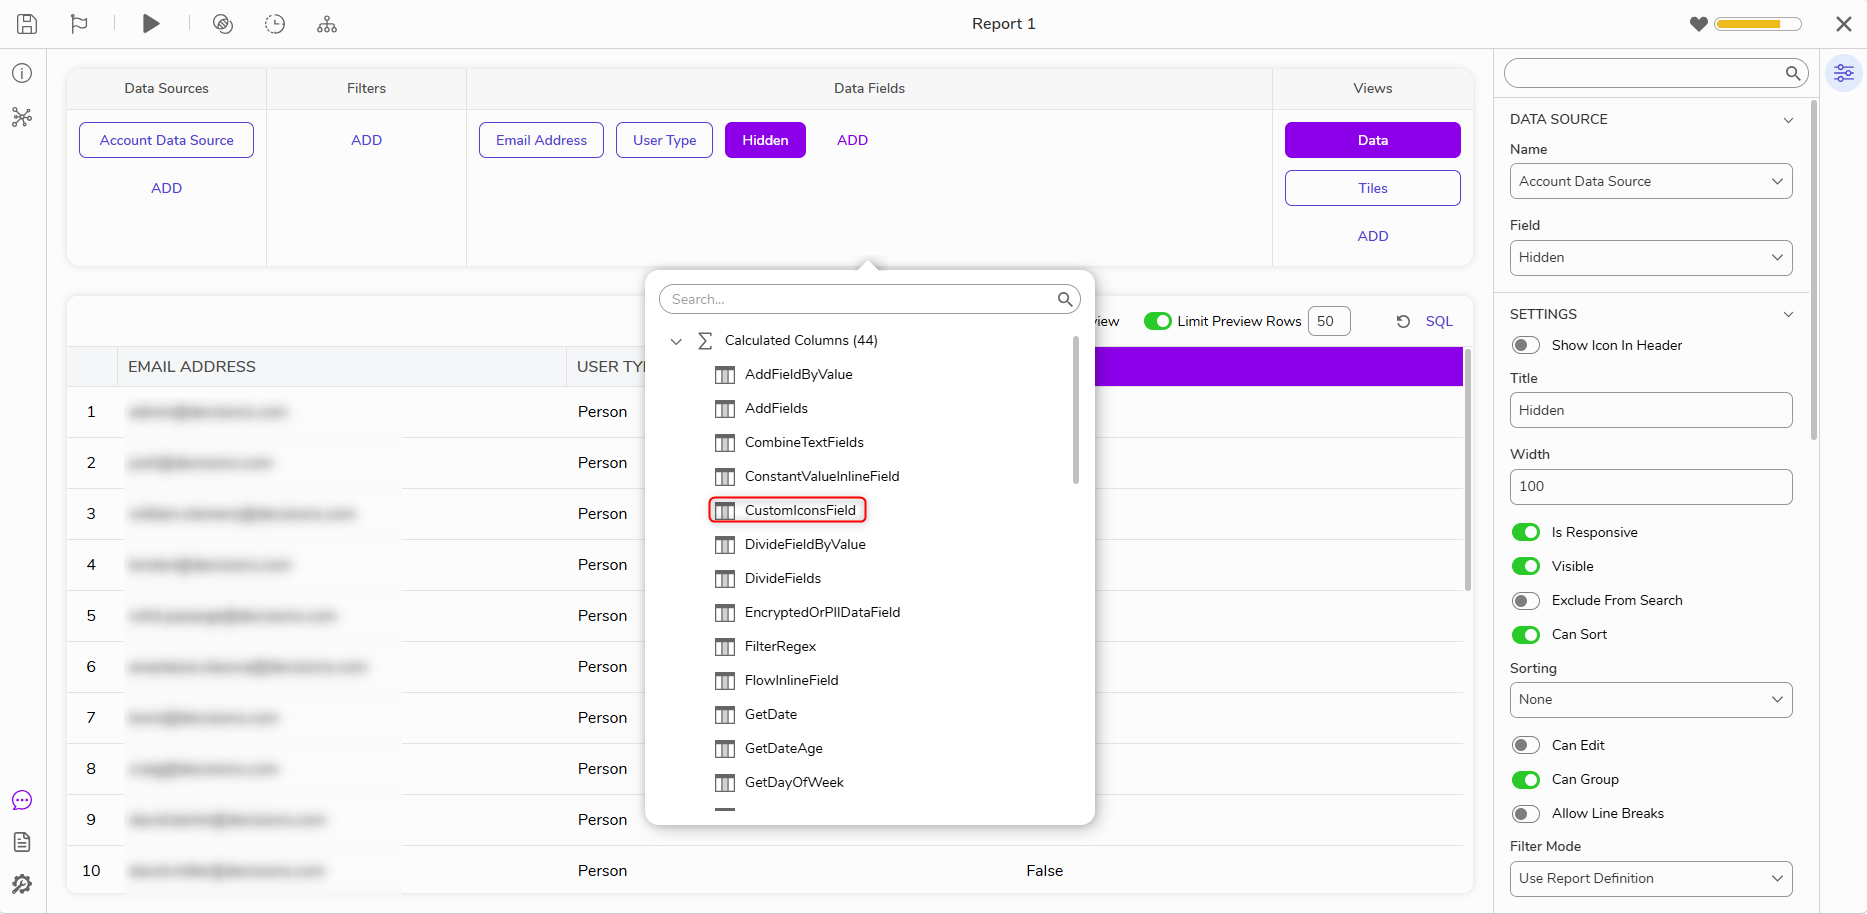
- In the Add Calculated Column dialog, all column properties are available. To configure the conditional icons, open Data > Icons select the plus icon to add an icon.
- For each icon configure:
- Provide a name.
- Select or upload an icon (upload image file, URL, or pick from the Decisions icon library).
- Add a tooltip for accessibility.
- For each icon configure:
- To provide more dynamic capabilities, icons can be conditional based on column values. Select 'Enable Conditional Icon' to show more configuration settings.
- Select a column to evaluate for the condition(s).
- Select the column to evaluate, then add one or more conditions.
- For each condition:
- Specify the icon, conditional logic, value, and tooltip.
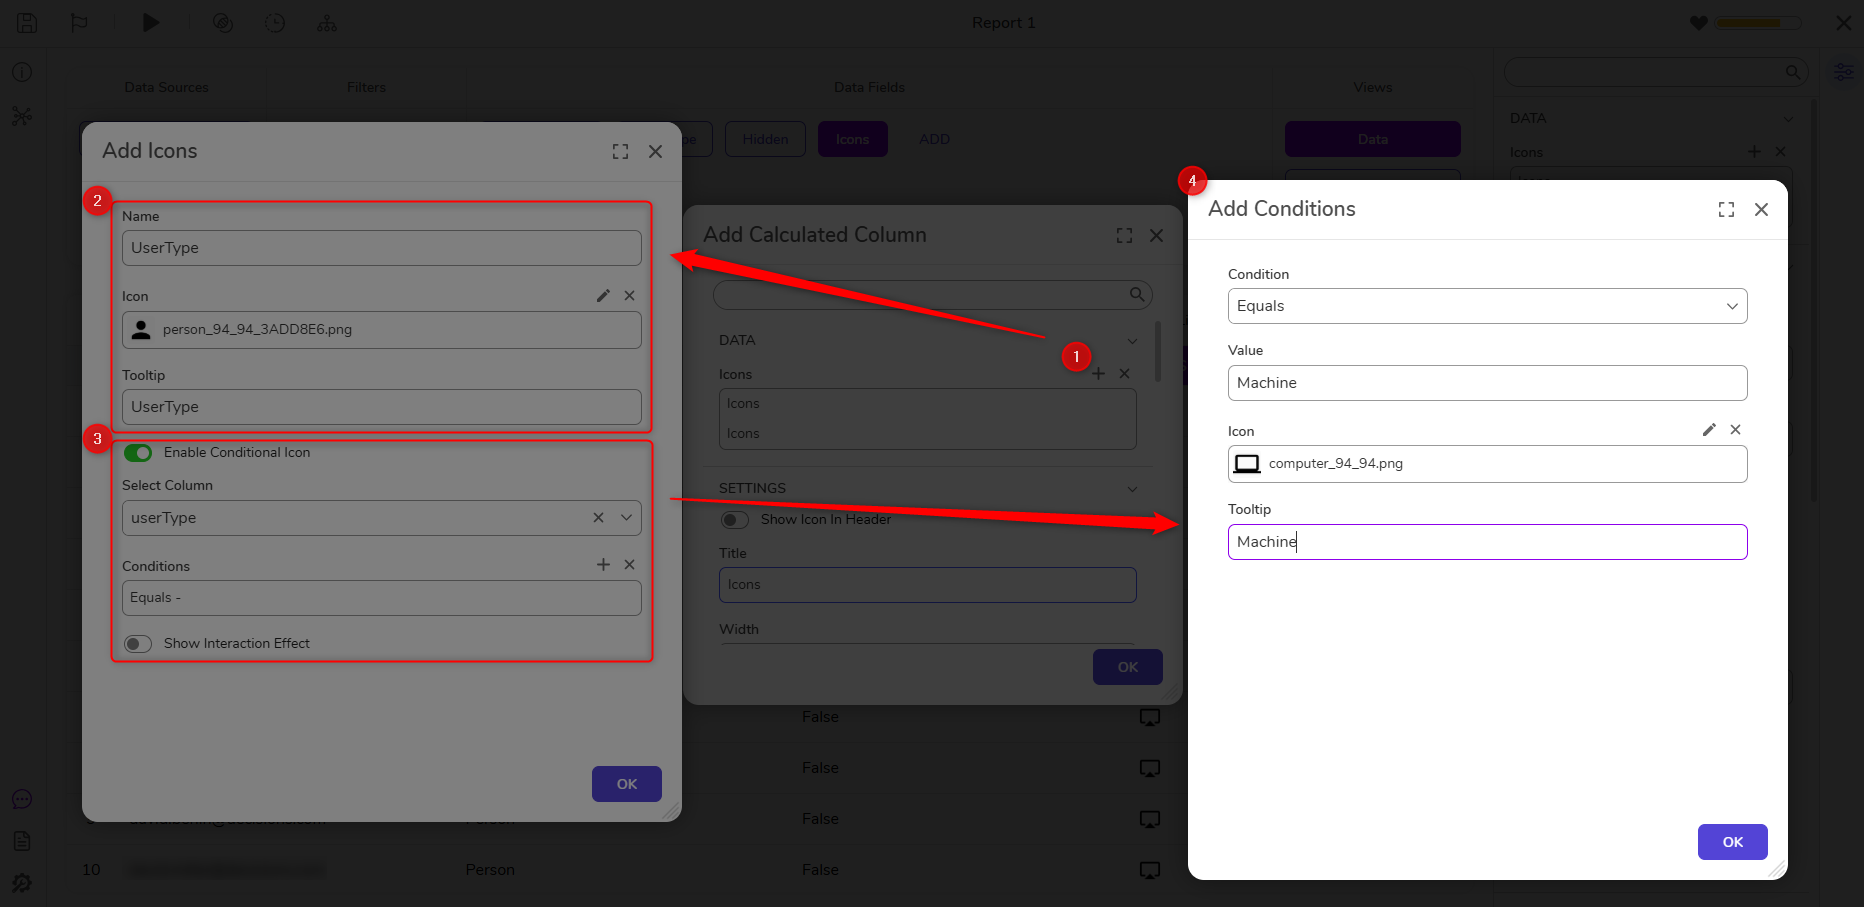
- Specify the icon, conditional logic, value, and tooltip.
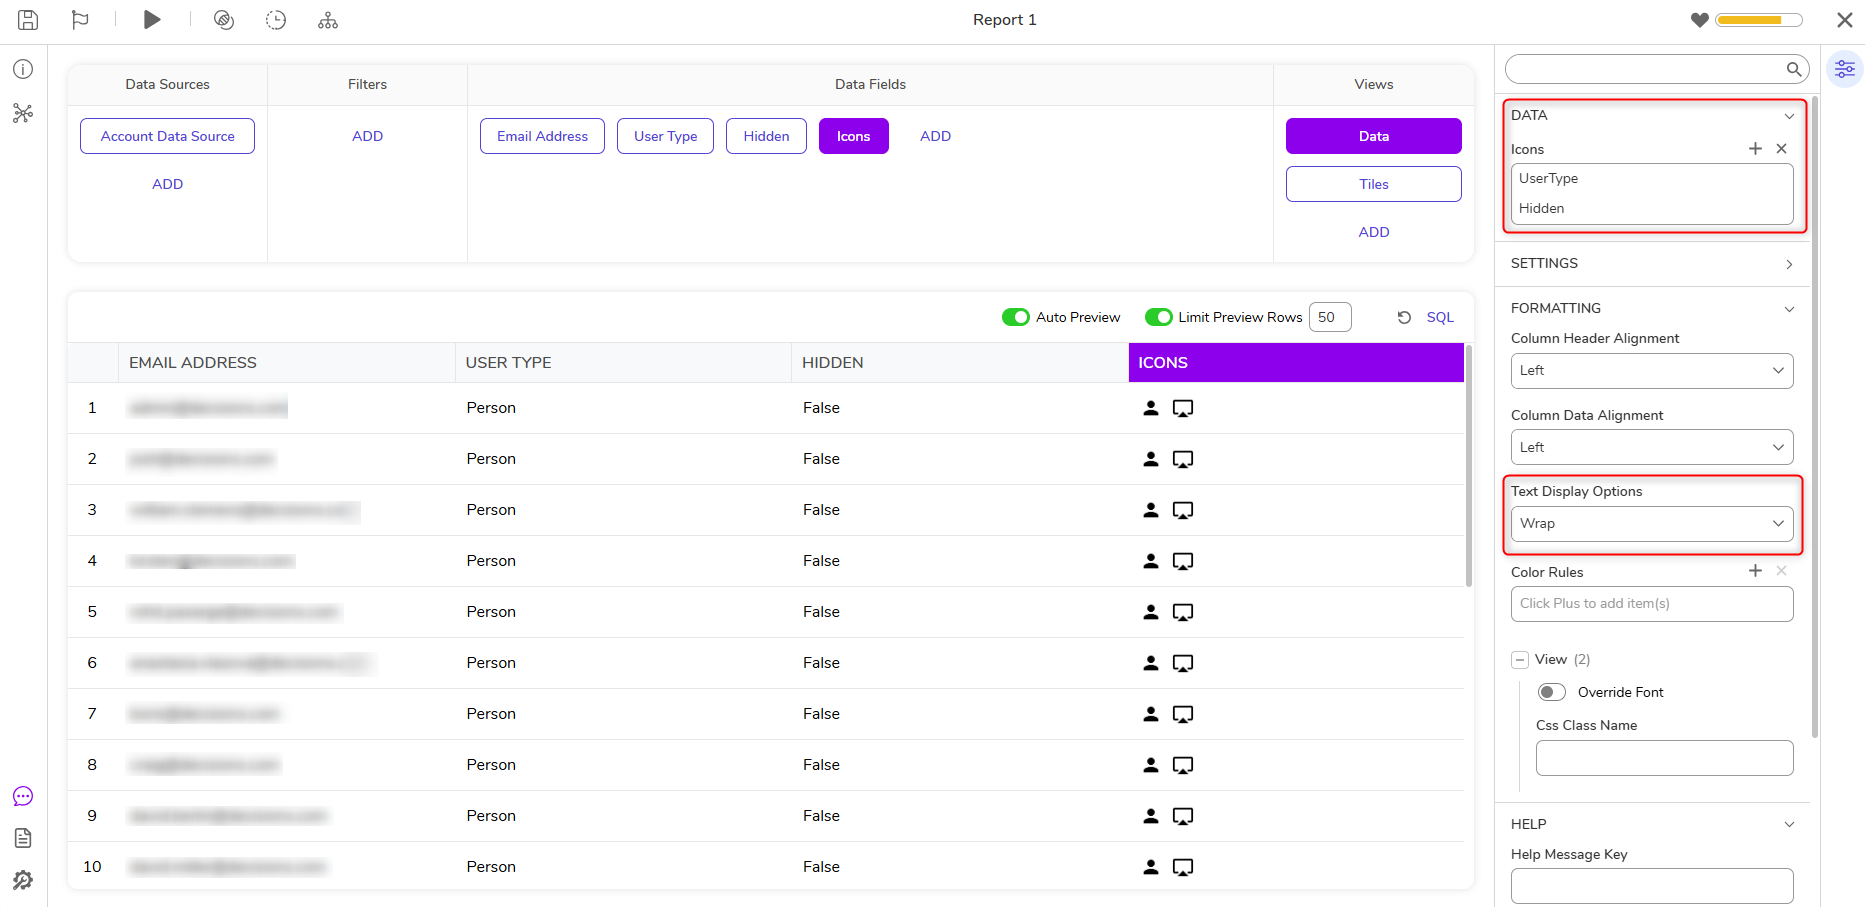
- Configure the order of icons using the up/down arrows within the Actions list.
- If icons exceed the column width, enable text wrap in column settings or expand column width.
Debug
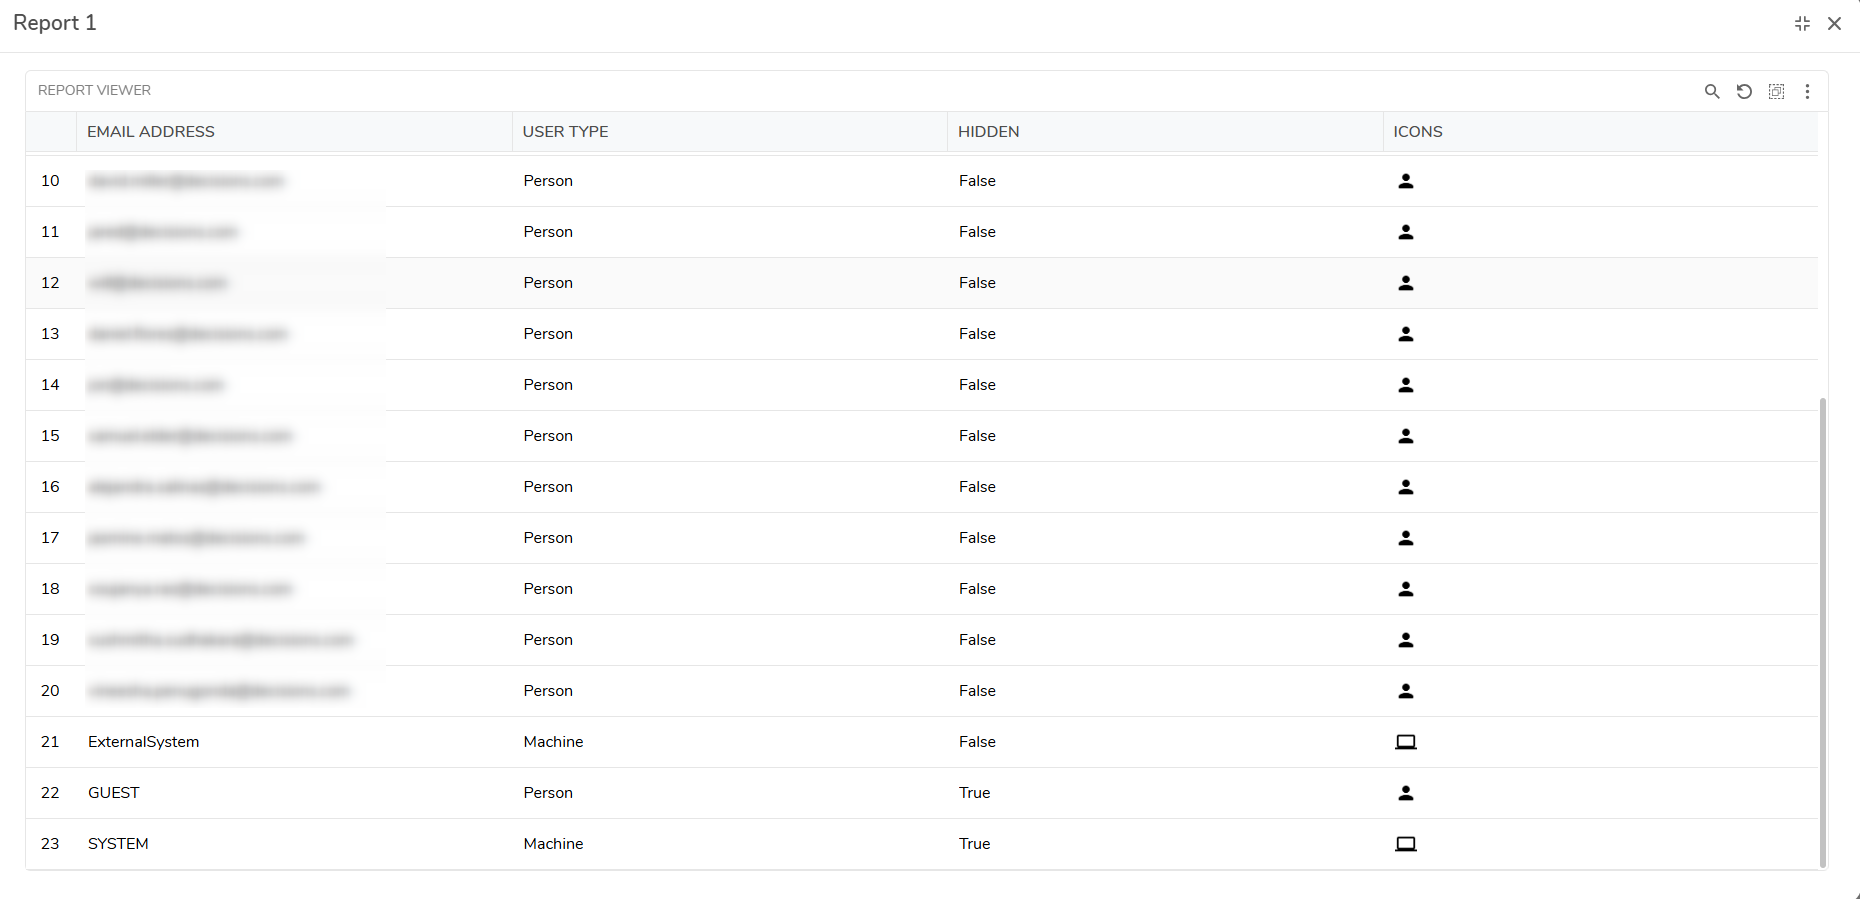
At runtime, the Custom Icons Field displays visual indicators directly within the Report column, as shown below:
- Each row displays icons in the ICONS column based on that user’s attributes.
- Tooltips are shown when hovering over each icon, improving accessibility and clarity.
This compact visual representation allows more space for other report columns while improving readability and scanability, especially for large data sets.