Overview
Charts can be created using the data generated by a Flow. The below article describes how to do this.
Note that starting in v9.5 Chart Flows are Folder aware and their Folder ID can be used in the Flow.
Prerequisites:
- Entity (Folder, Datatype, Database, etc)
Example
The example below will use the following Database Structure:
| Animal | |
|---|---|
| Data Member | Type |
| Name | String [Text] |
| Species | String [Text] |
| Age | Int32 [Number] |
- Create a Page.
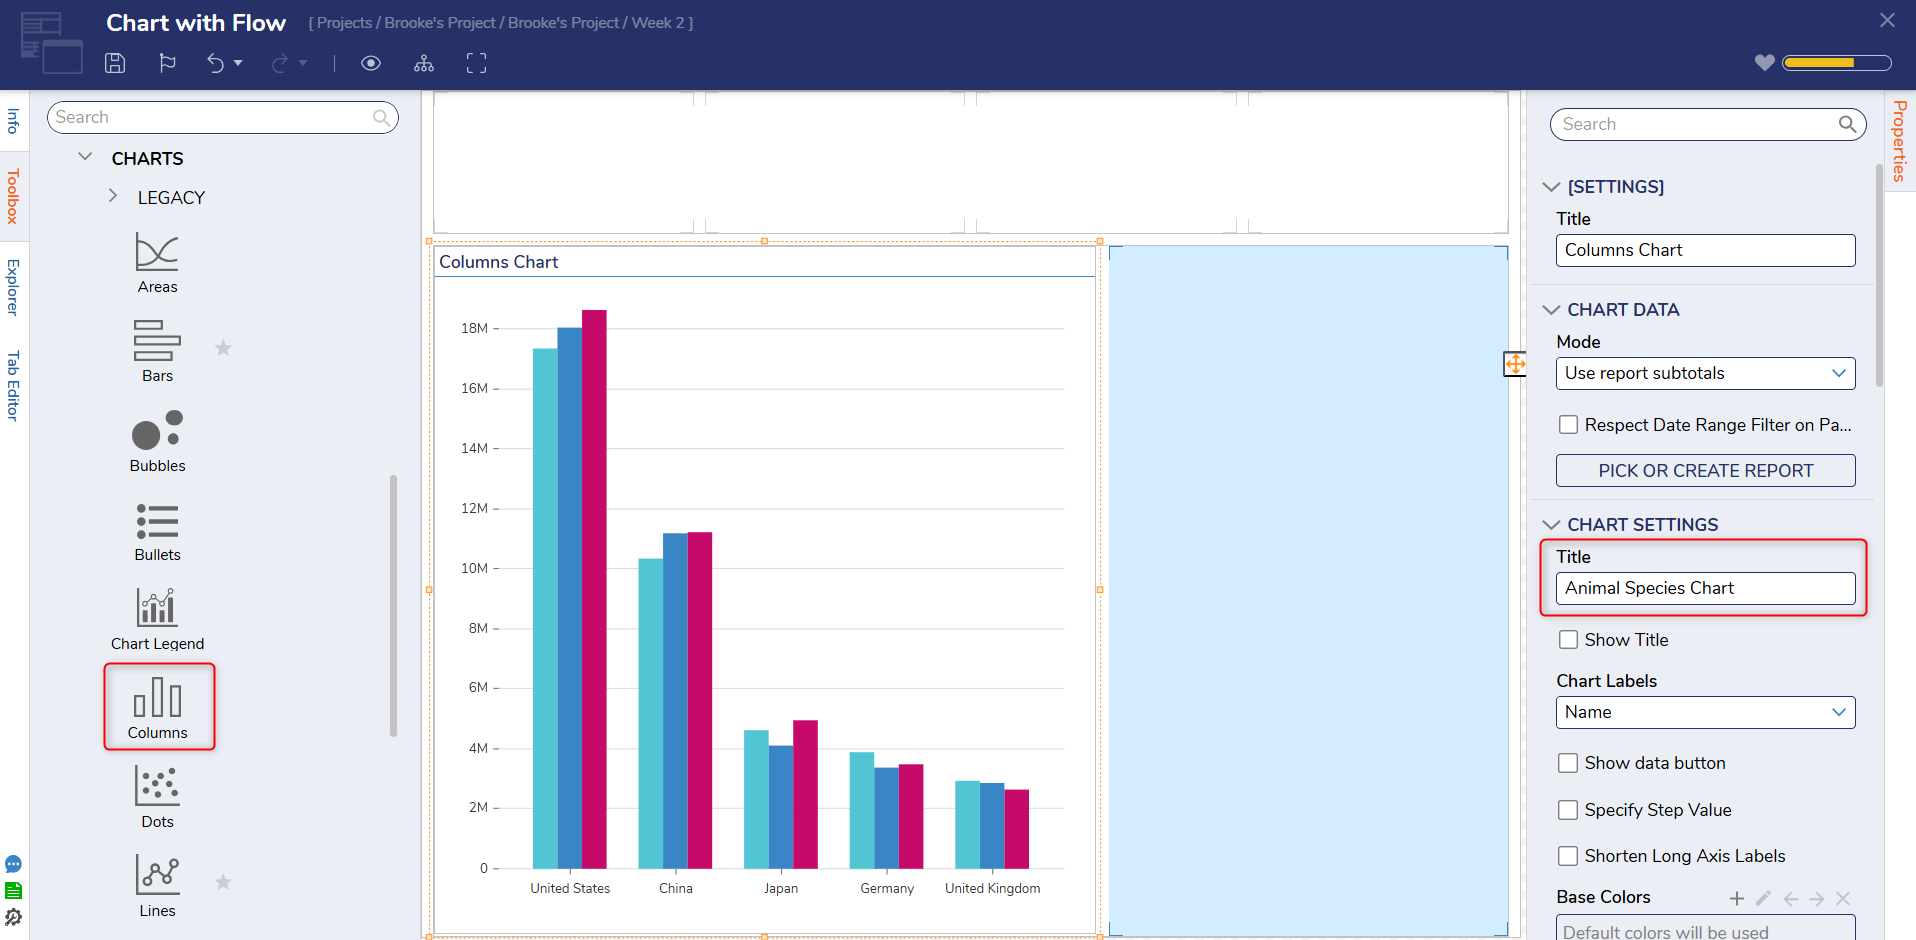
- In the Toolbox panel of the Page Designer, navigate to REPORTS > CHARTS. Select a chart and place it on the Page workspace. This example will use the Columns chart.
- On the Properties panel, enter a Title for the Chart.
- Under the CHART DATA category, click the dropdown menu under Mode and select Use flow.
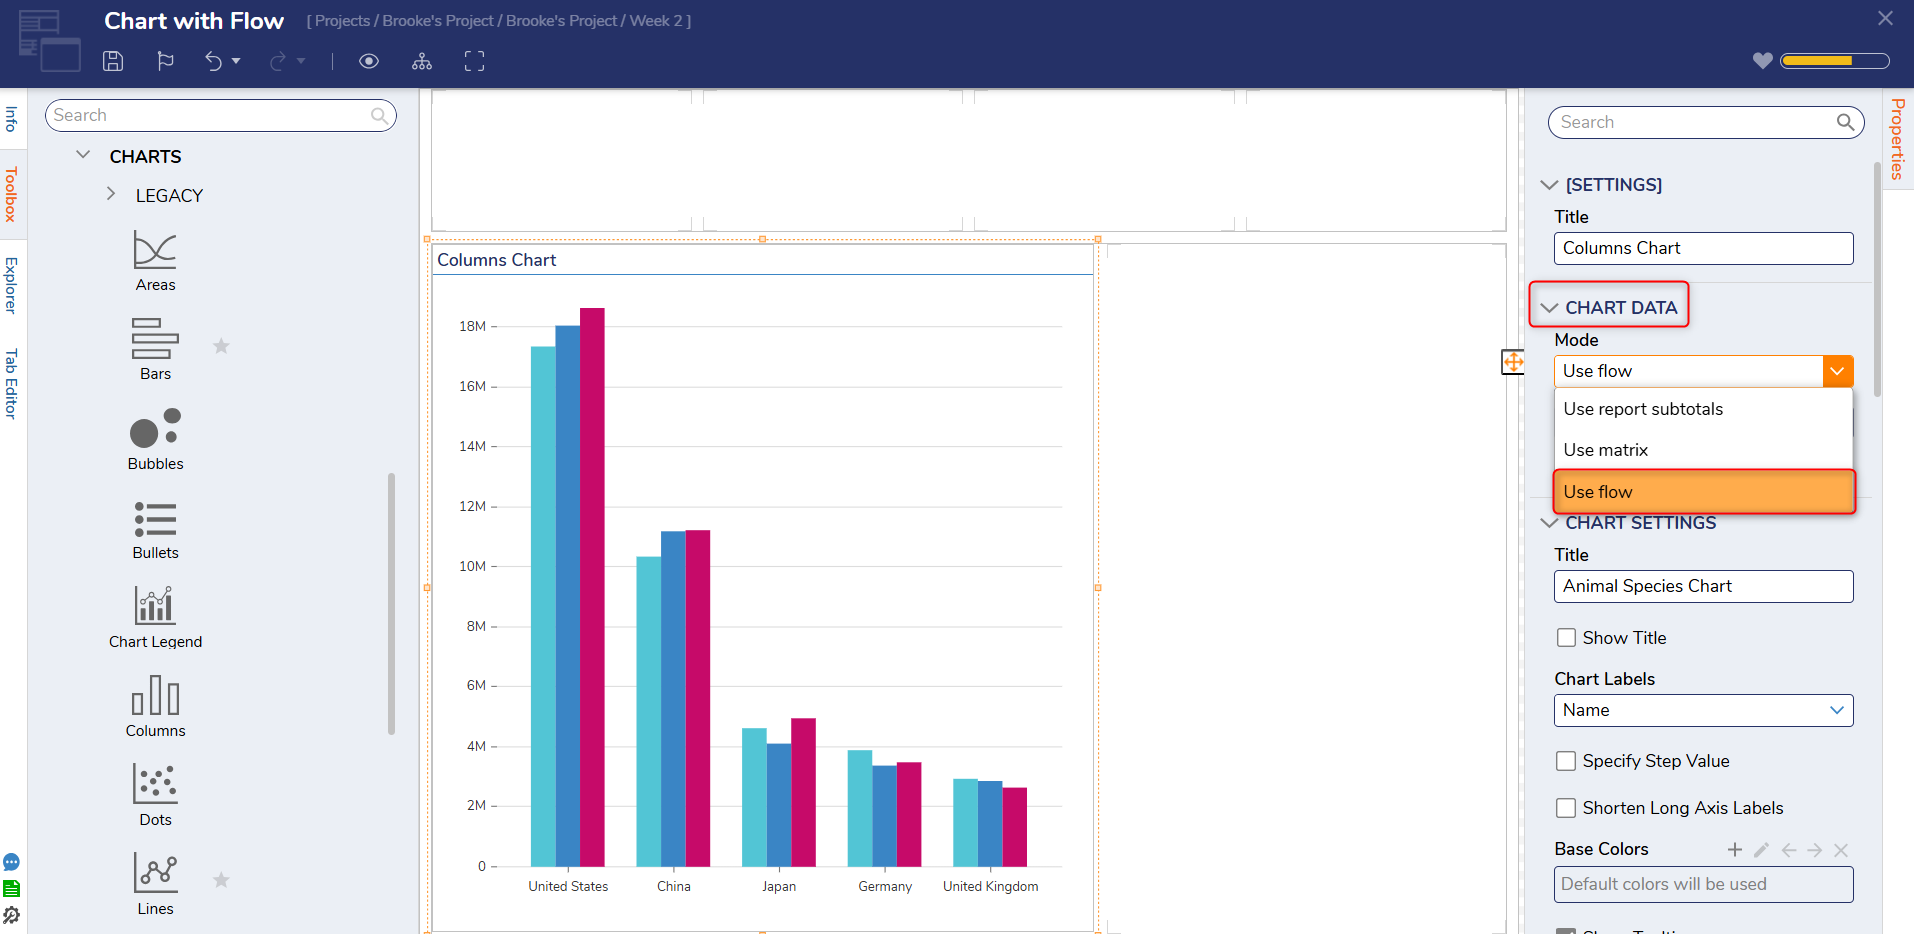
- Click PICK OR CREATE DATA FLOW, select CREATE NEW, click Chart Data Flow, enter a Name and click CREATE.
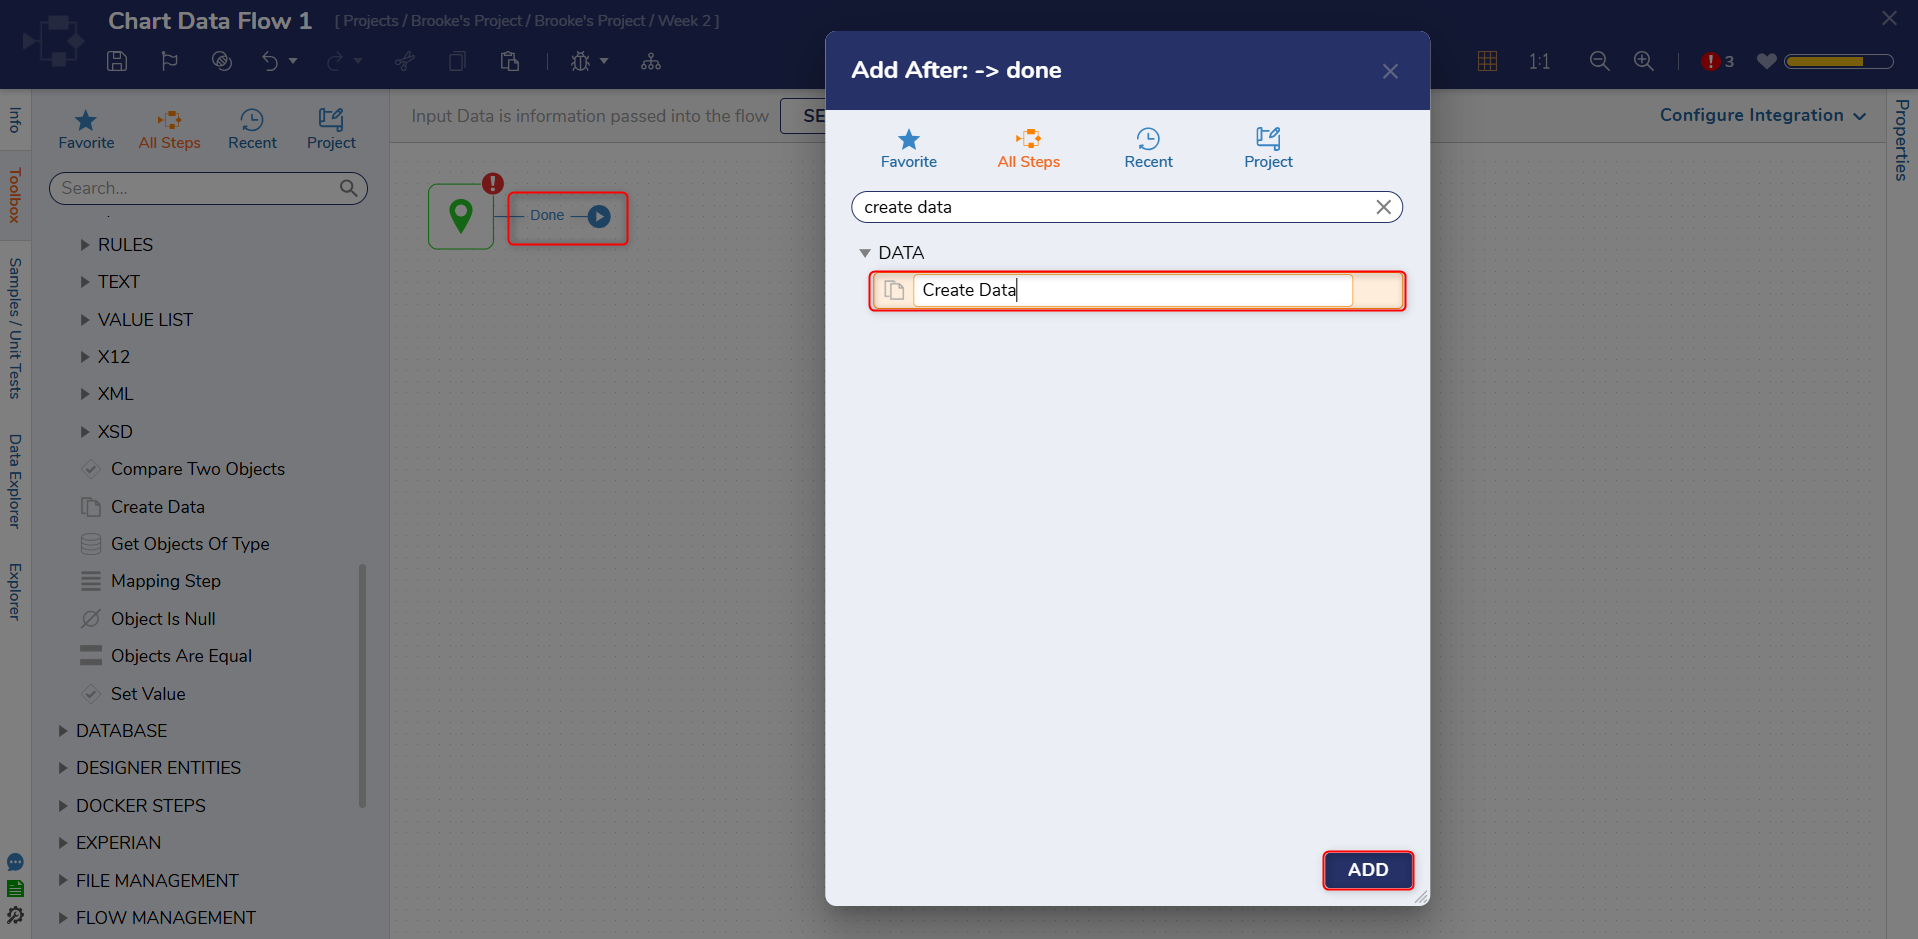
- Click the Done path of the Start step. Navigate to All Steps [Catalog] > Data. Select the Create Data step and click ADD.
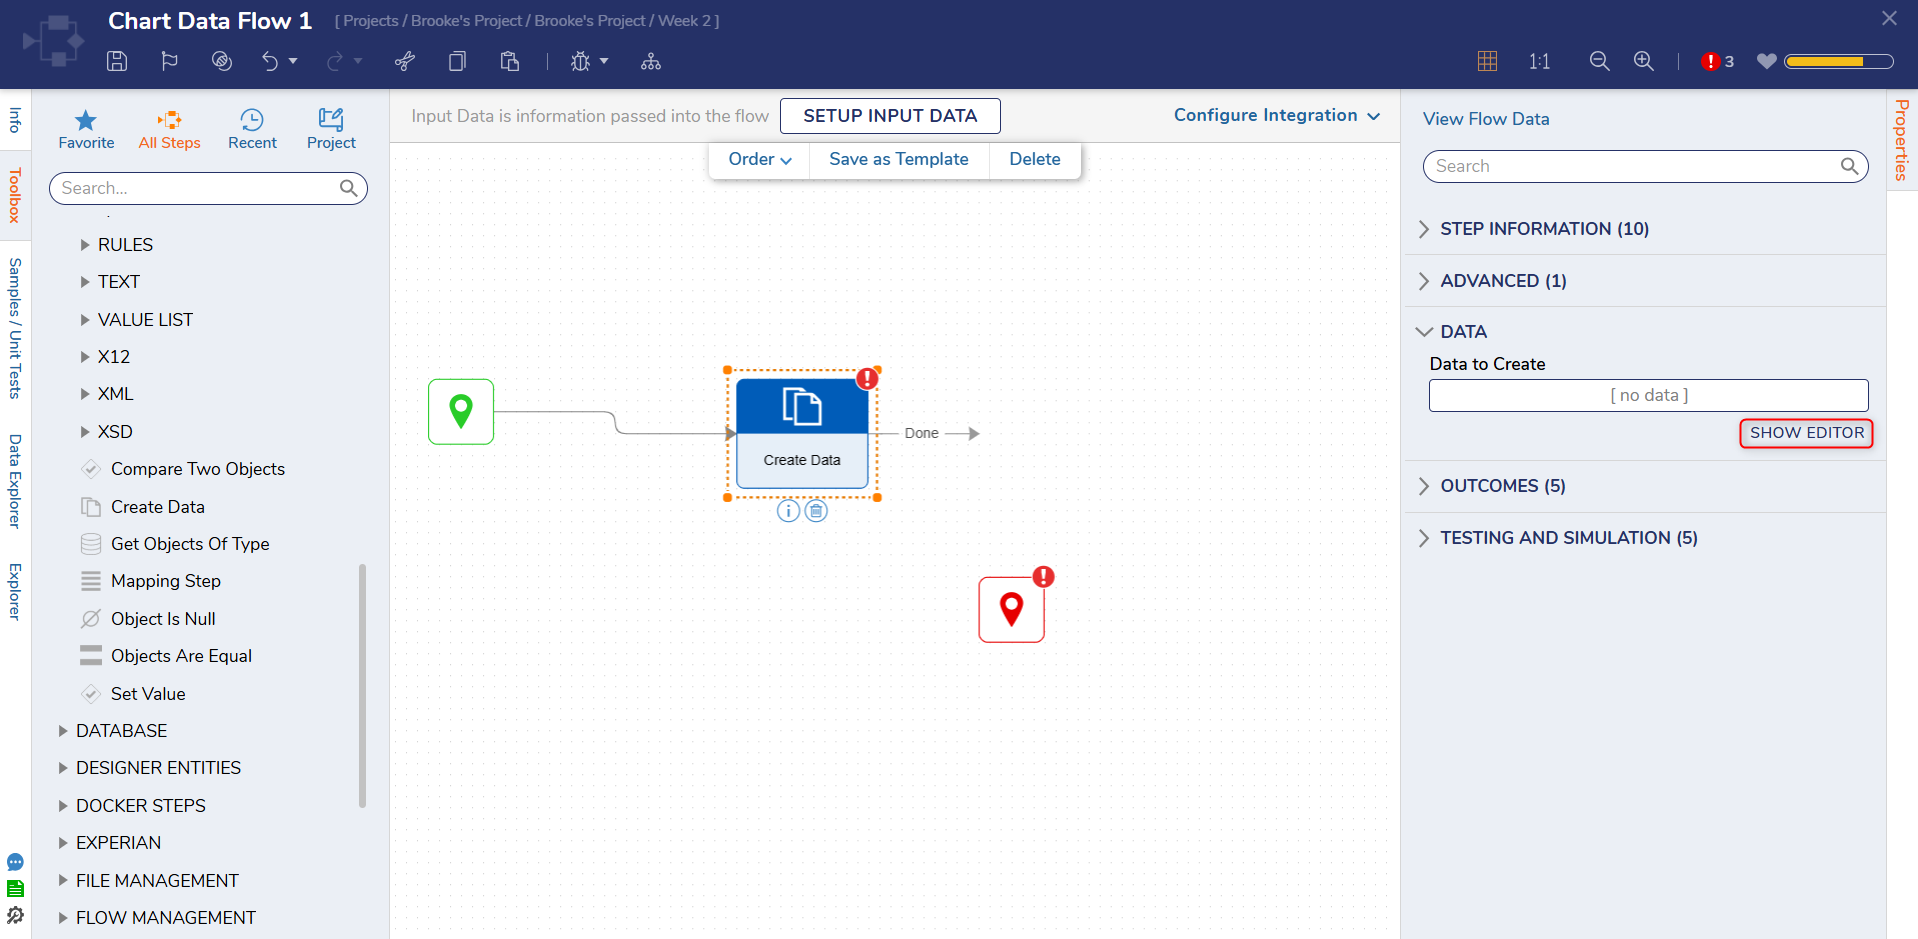
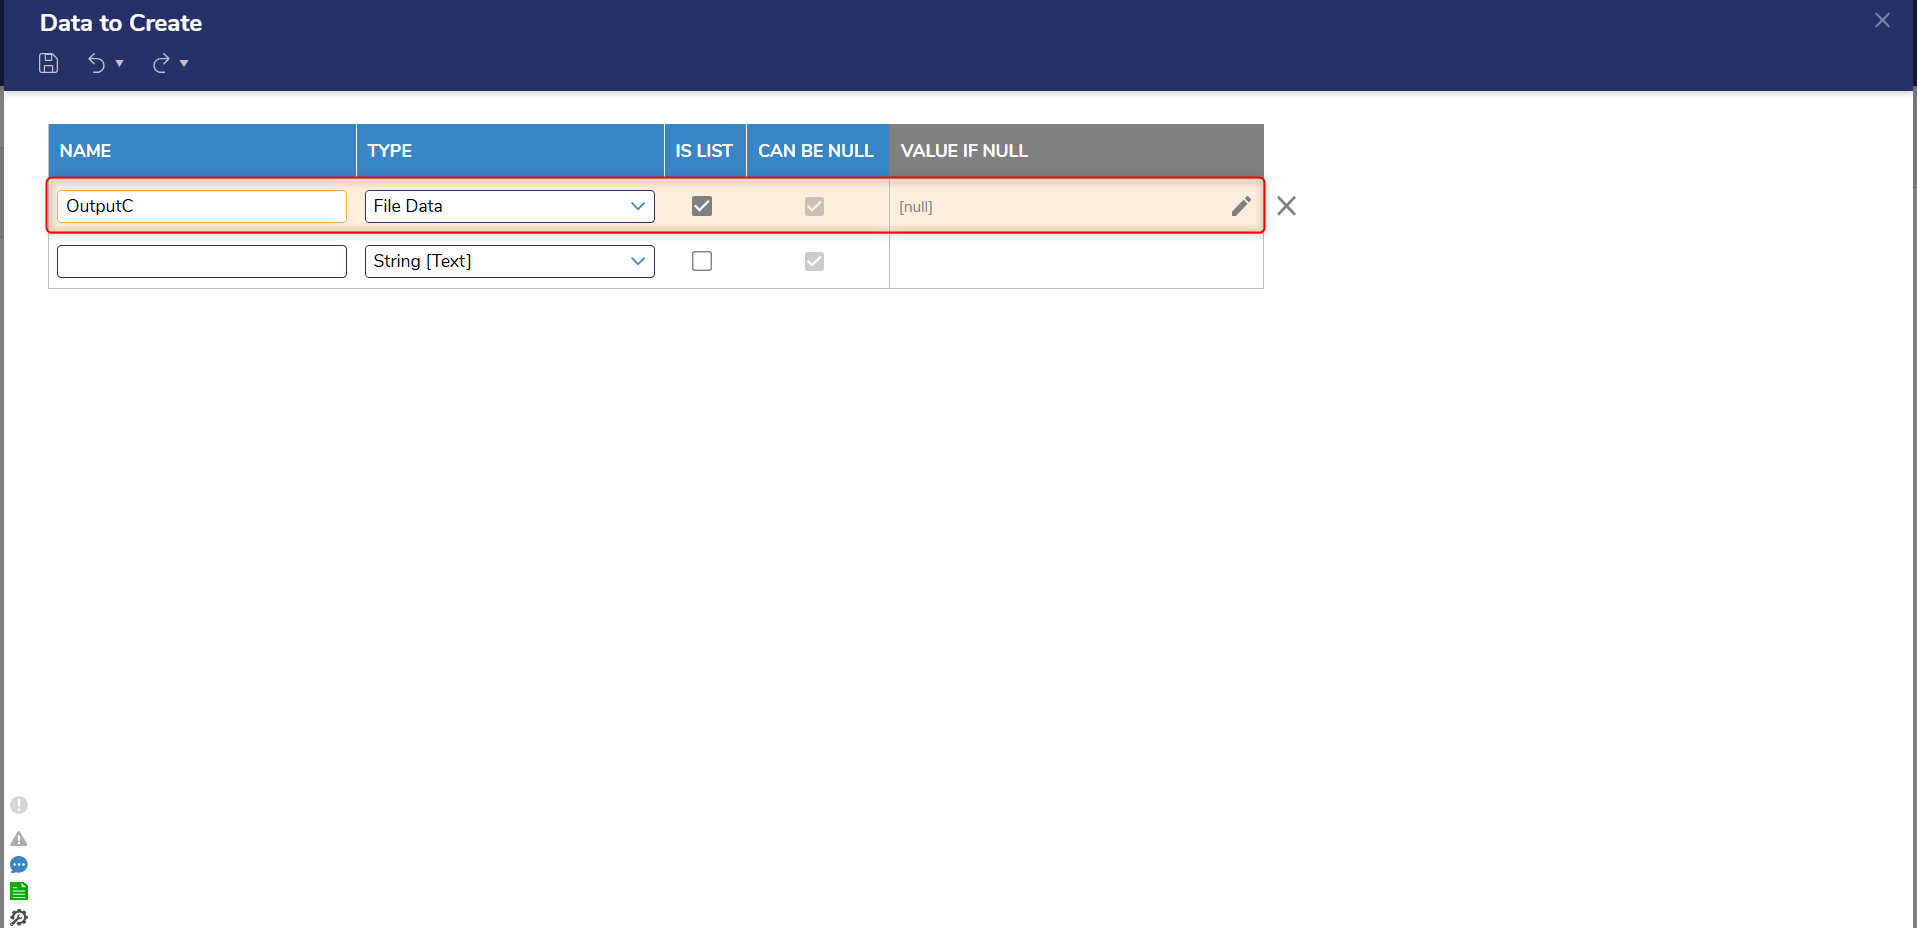
- On the Properties panel, click SHOW EDITOR under Data to Create.
- In the Data to Create window under NAME, enter "OutputC". In the TYPE field, enter "chartrenderdata" and select ChartRenderData [DecisionsFramework...]. Select the IS LIST checkbox. Click Save and close the window.
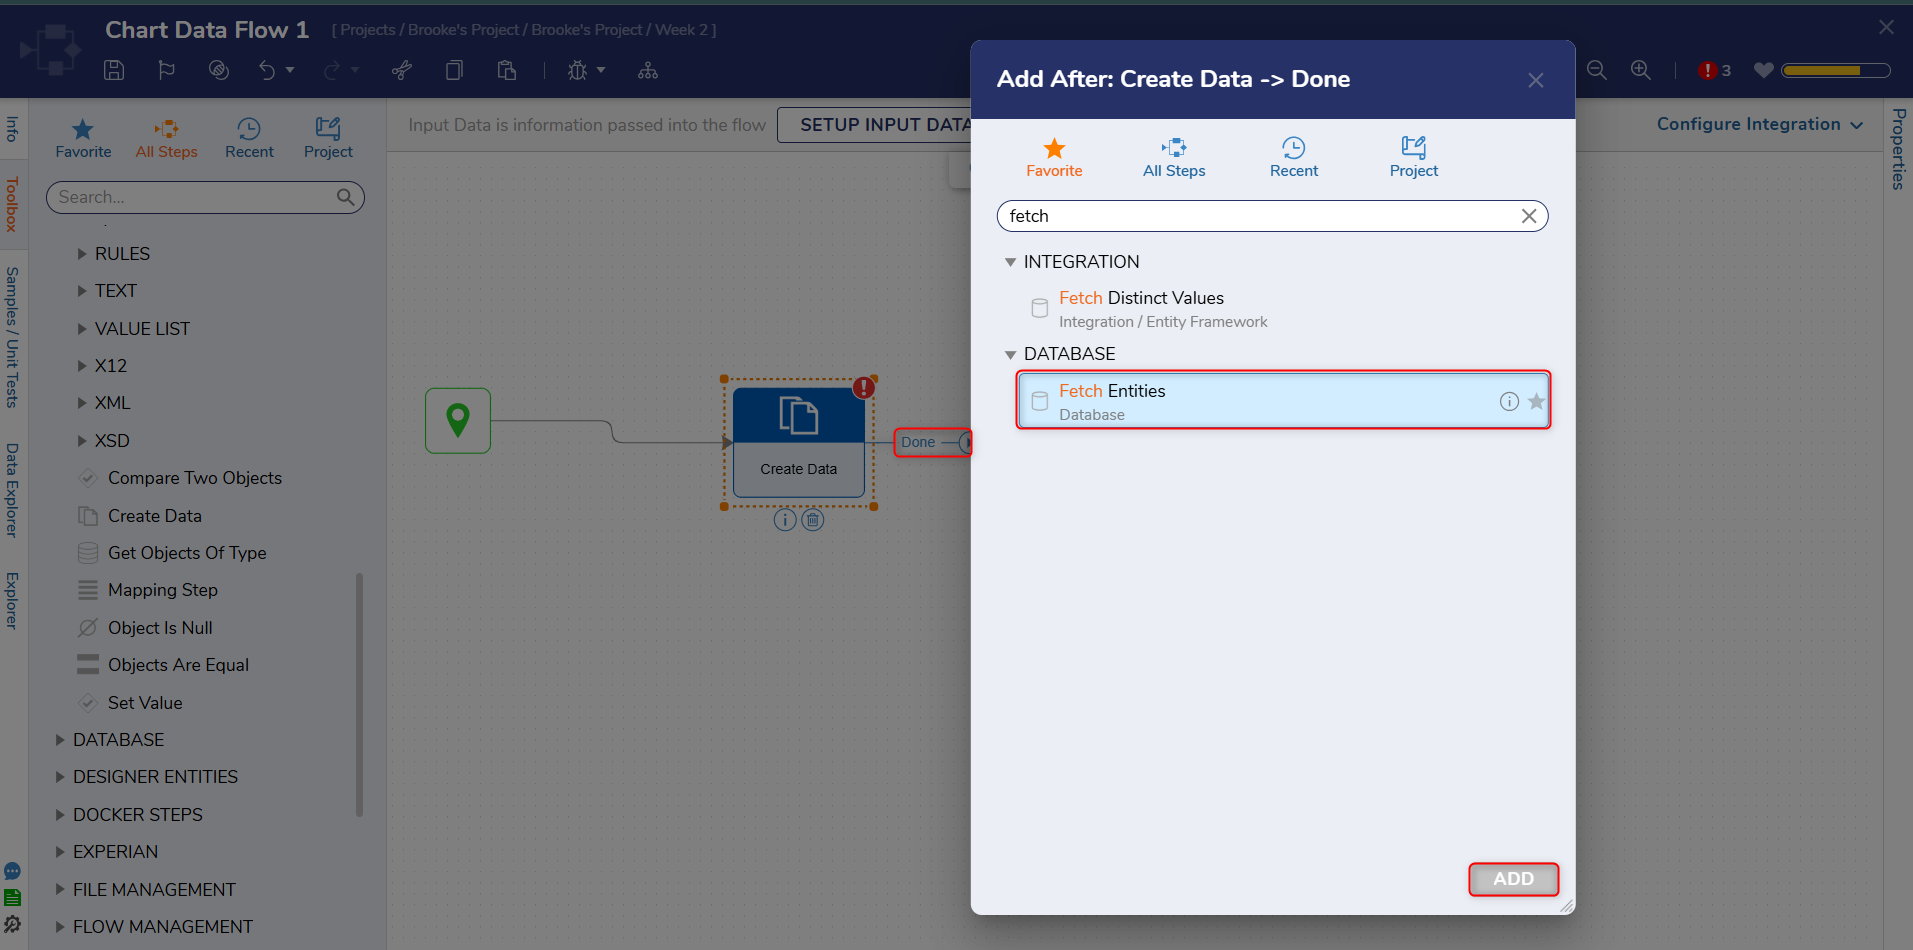
- Click the Done path and navigate to All Steps [Catalog] > Database. Select the Fetch Entities step and click ADD.
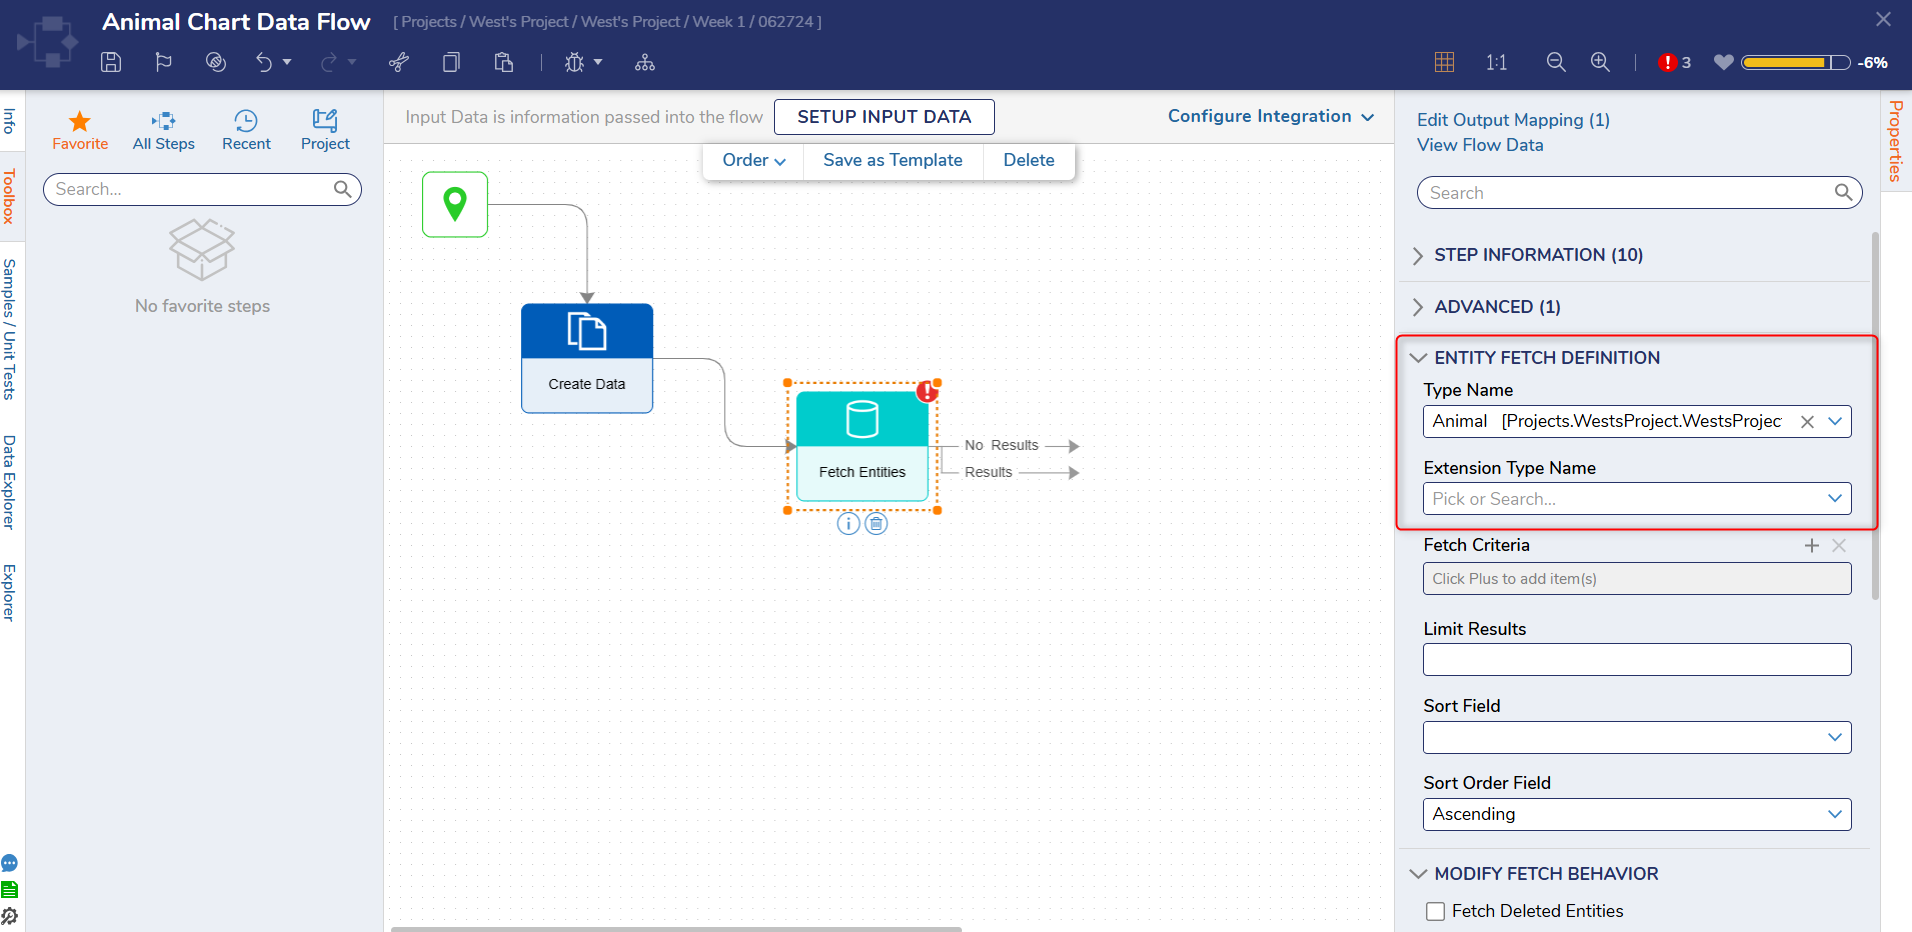
- On the Properties panel, set the Type Name field to the desired Entity type. If using a Case Entity, set the Type Name to Folder [DecisionsFramework...] and Extenstion Type Name to the Case Entity.
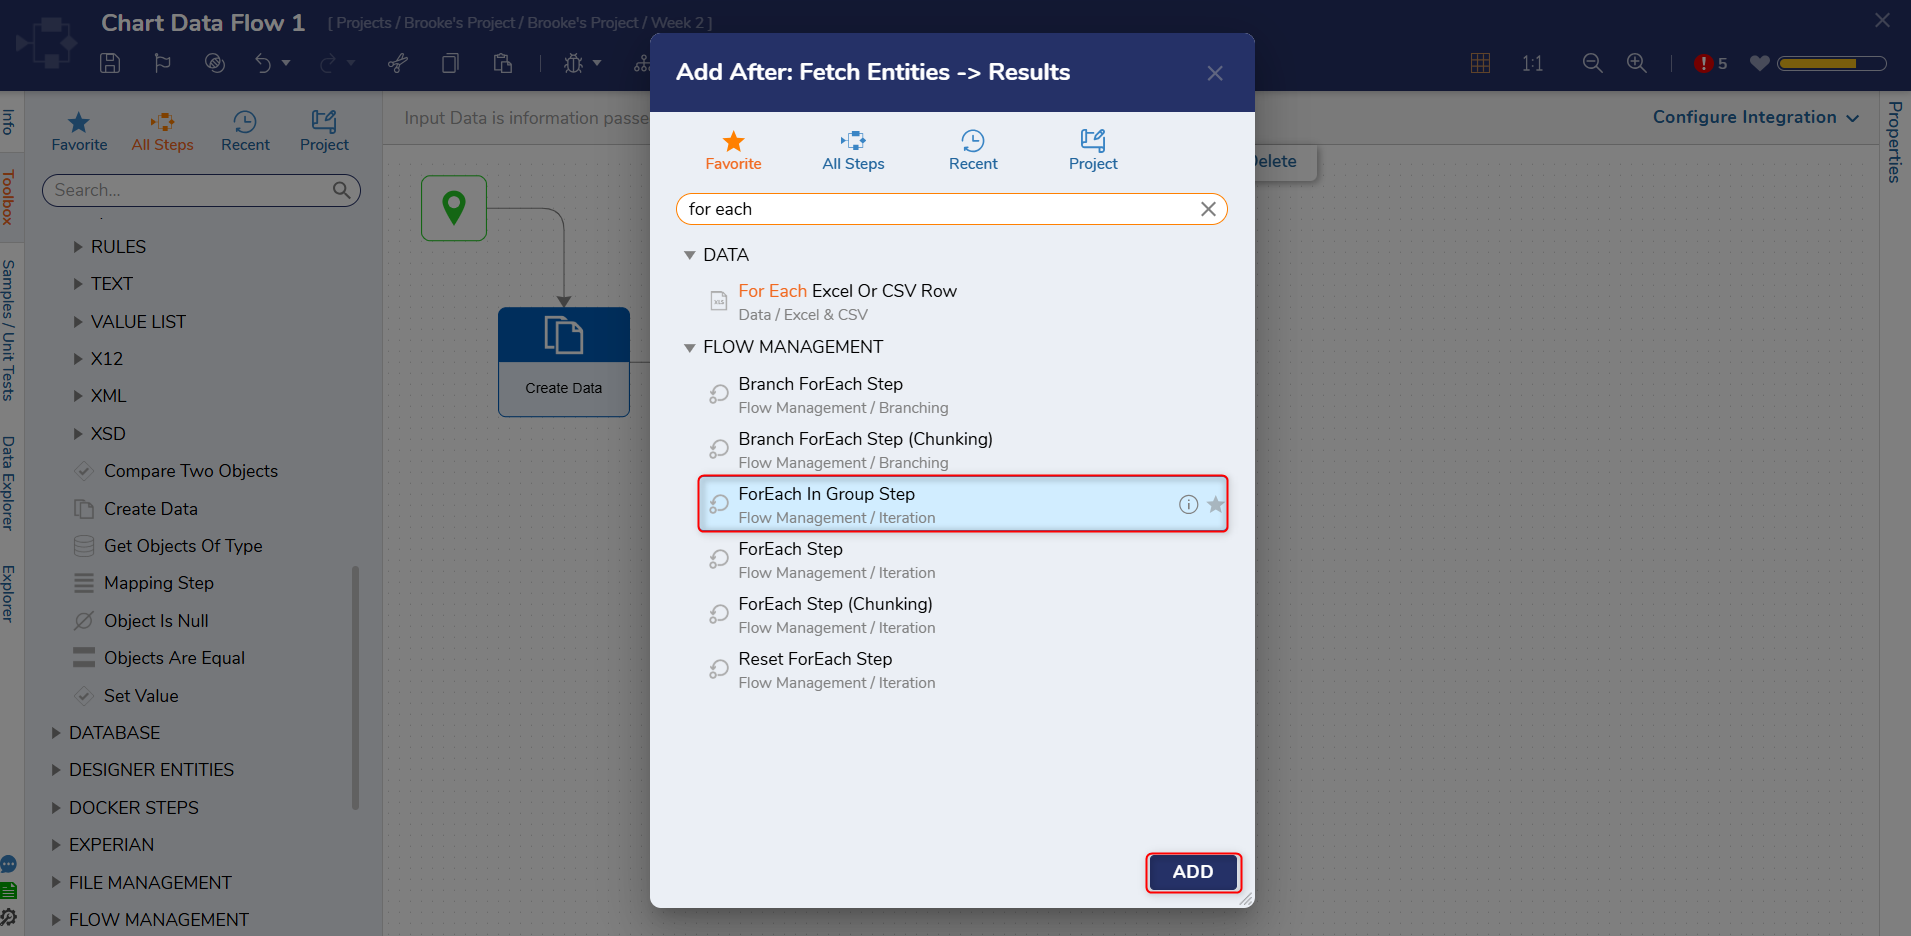
- Click the Results path and navigate to All Steps [Catalog] > Flow Management > Iteration. Select the ForEach In Group step and click ADD.
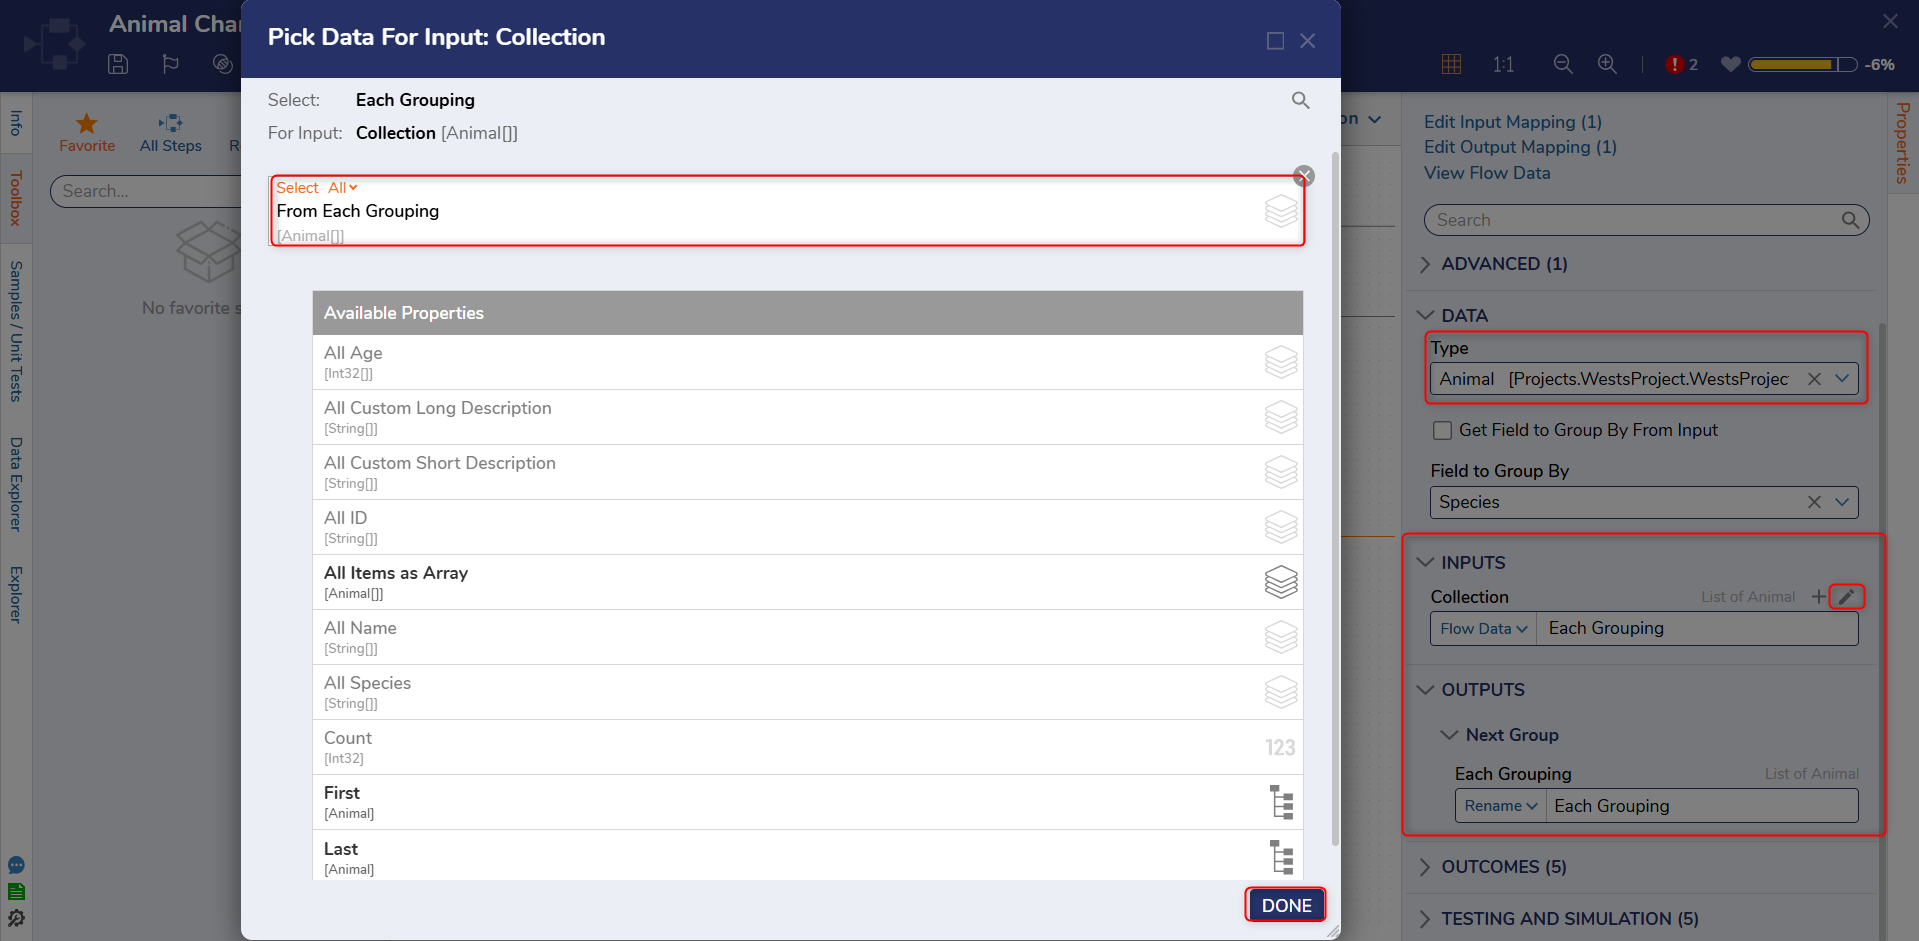
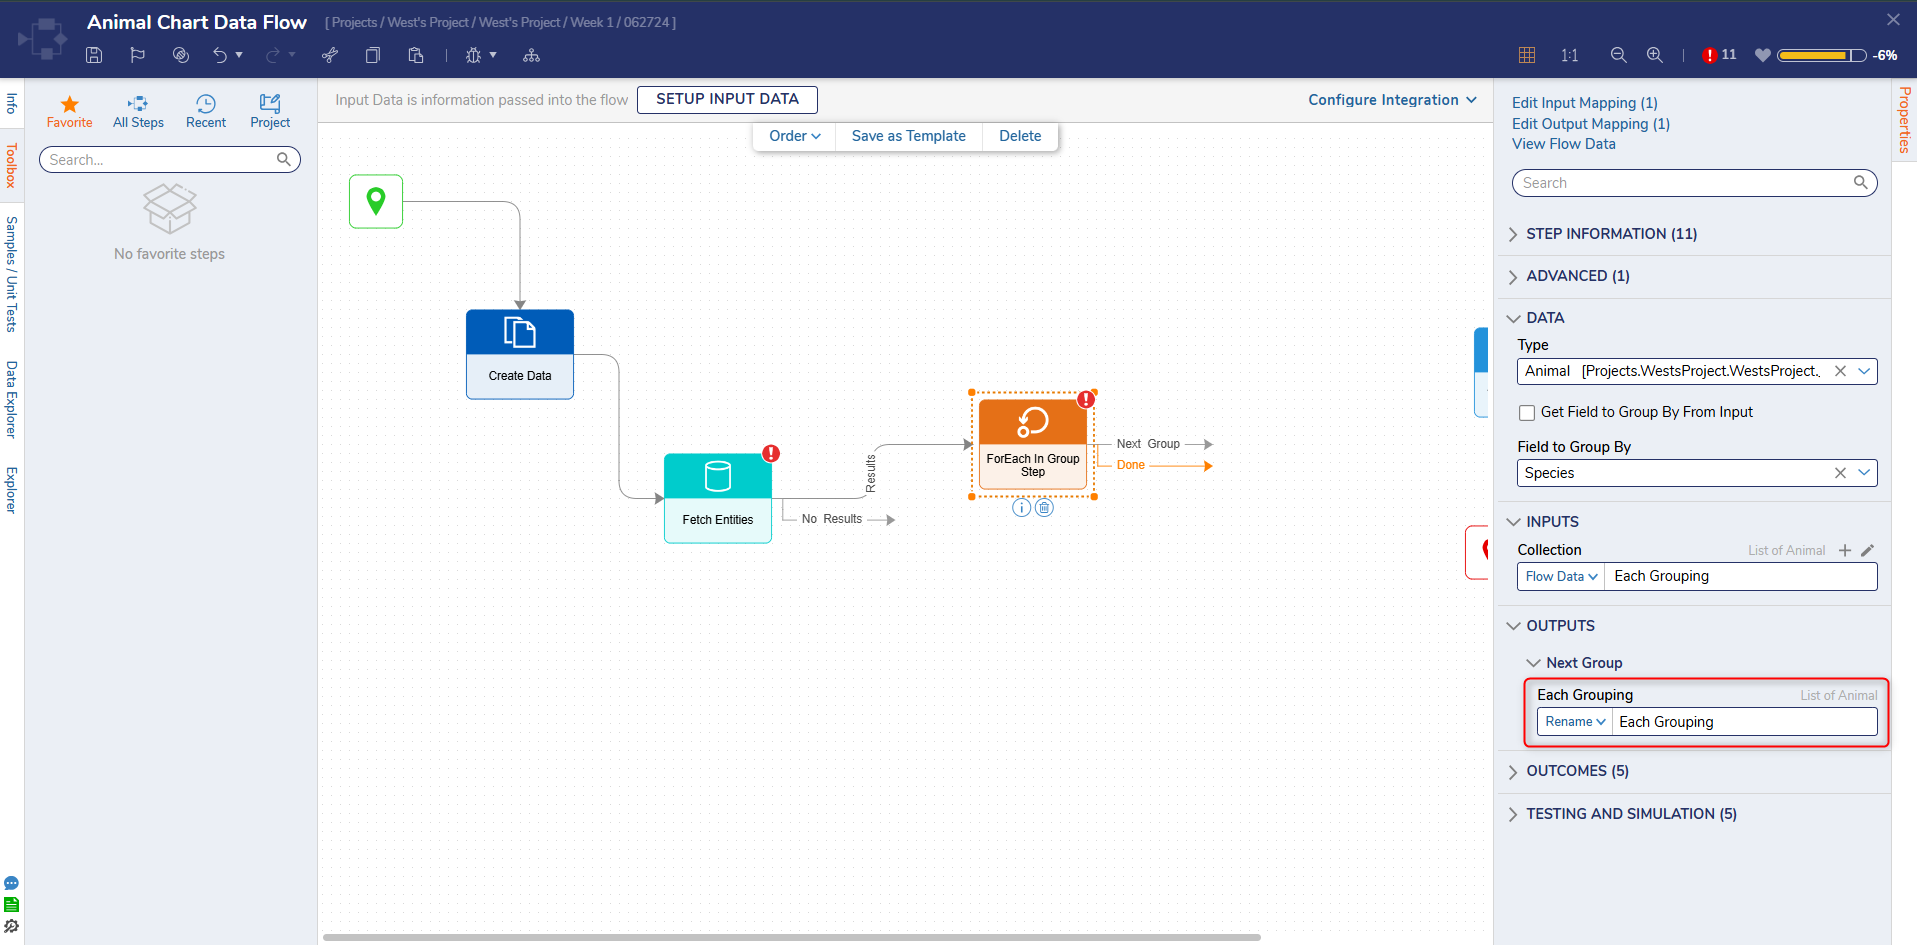
- On the Properties panel, set the Type field under the DATA category to the Type Name used in the Fetch Entities step. Under the INPUTS category, set the Field to Group By to any desired field from the Entity chosen. This example will use Species from the Animal Database Structure. Click EDIT under the Collection field and select EntityResults.
- Under OUTPUTS, set the mapping for Each Grouping to Rename and enter "Each Grouping".
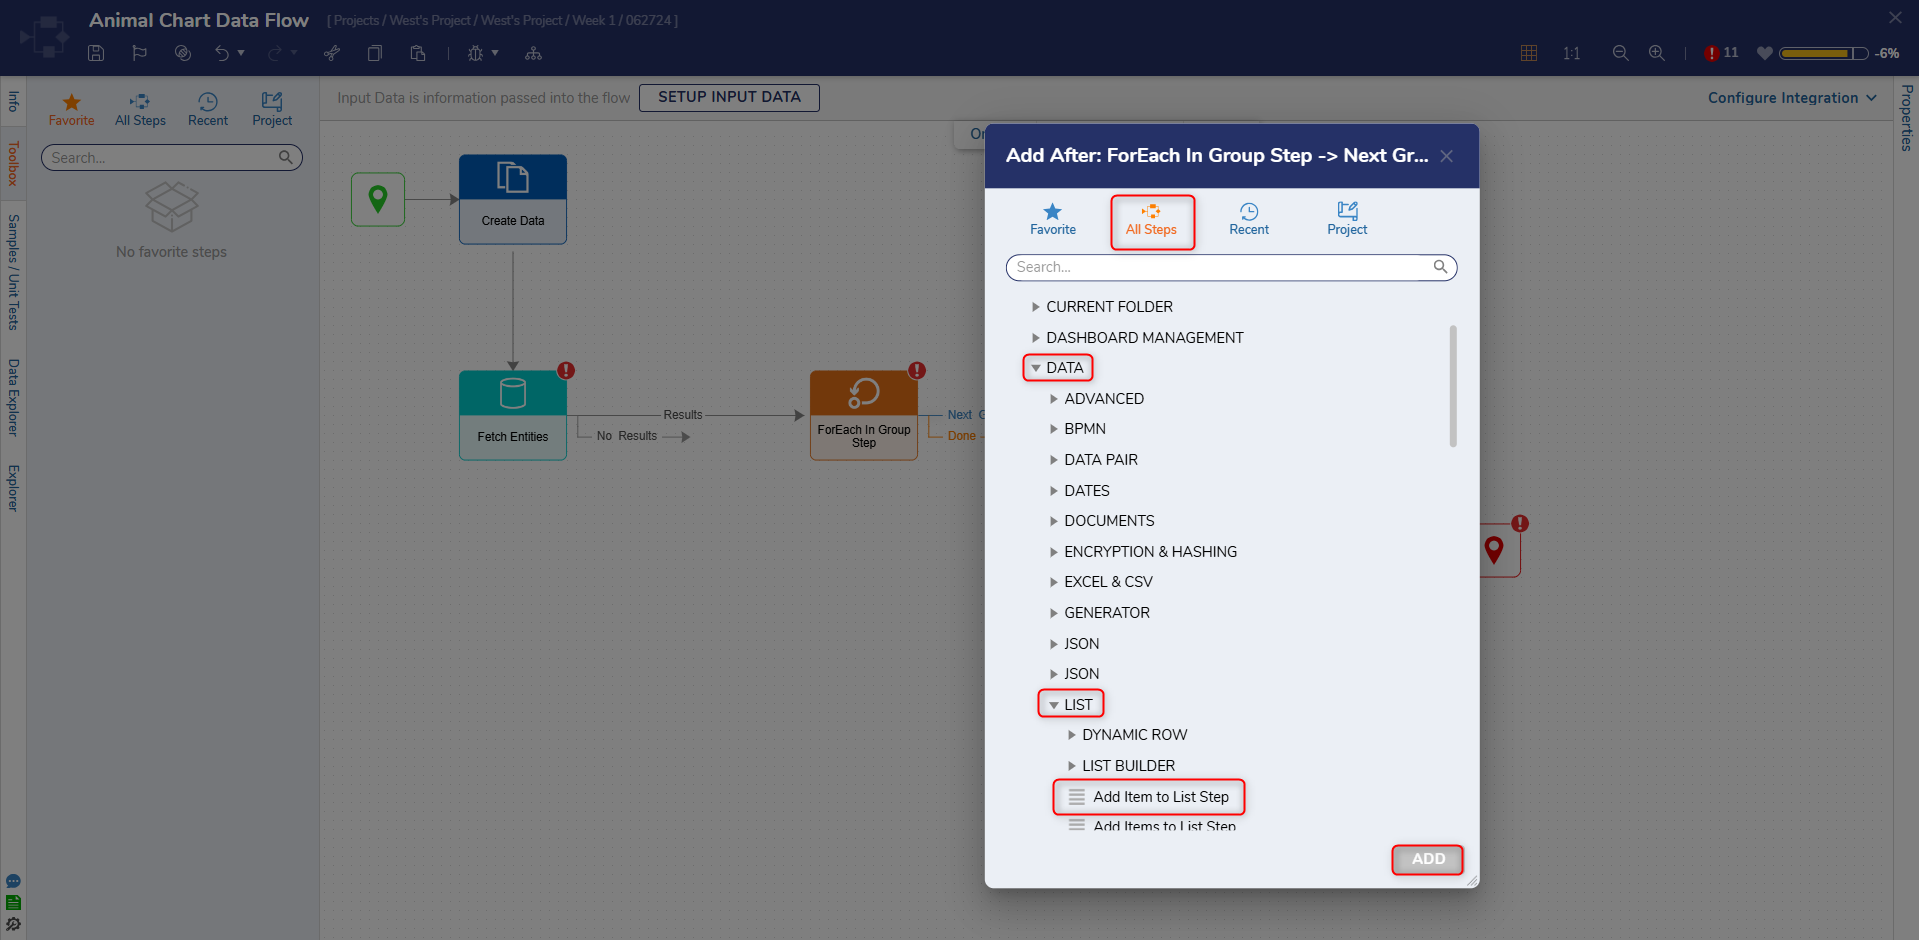
- Click the Next Group path and navigate to All Steps [Catalog] > Data > List. Select the Add Item to List Step and click ADD.
- On the Properties panel under the DATA category, set the ListType to ChartRenderData [DecisionsFramework...].
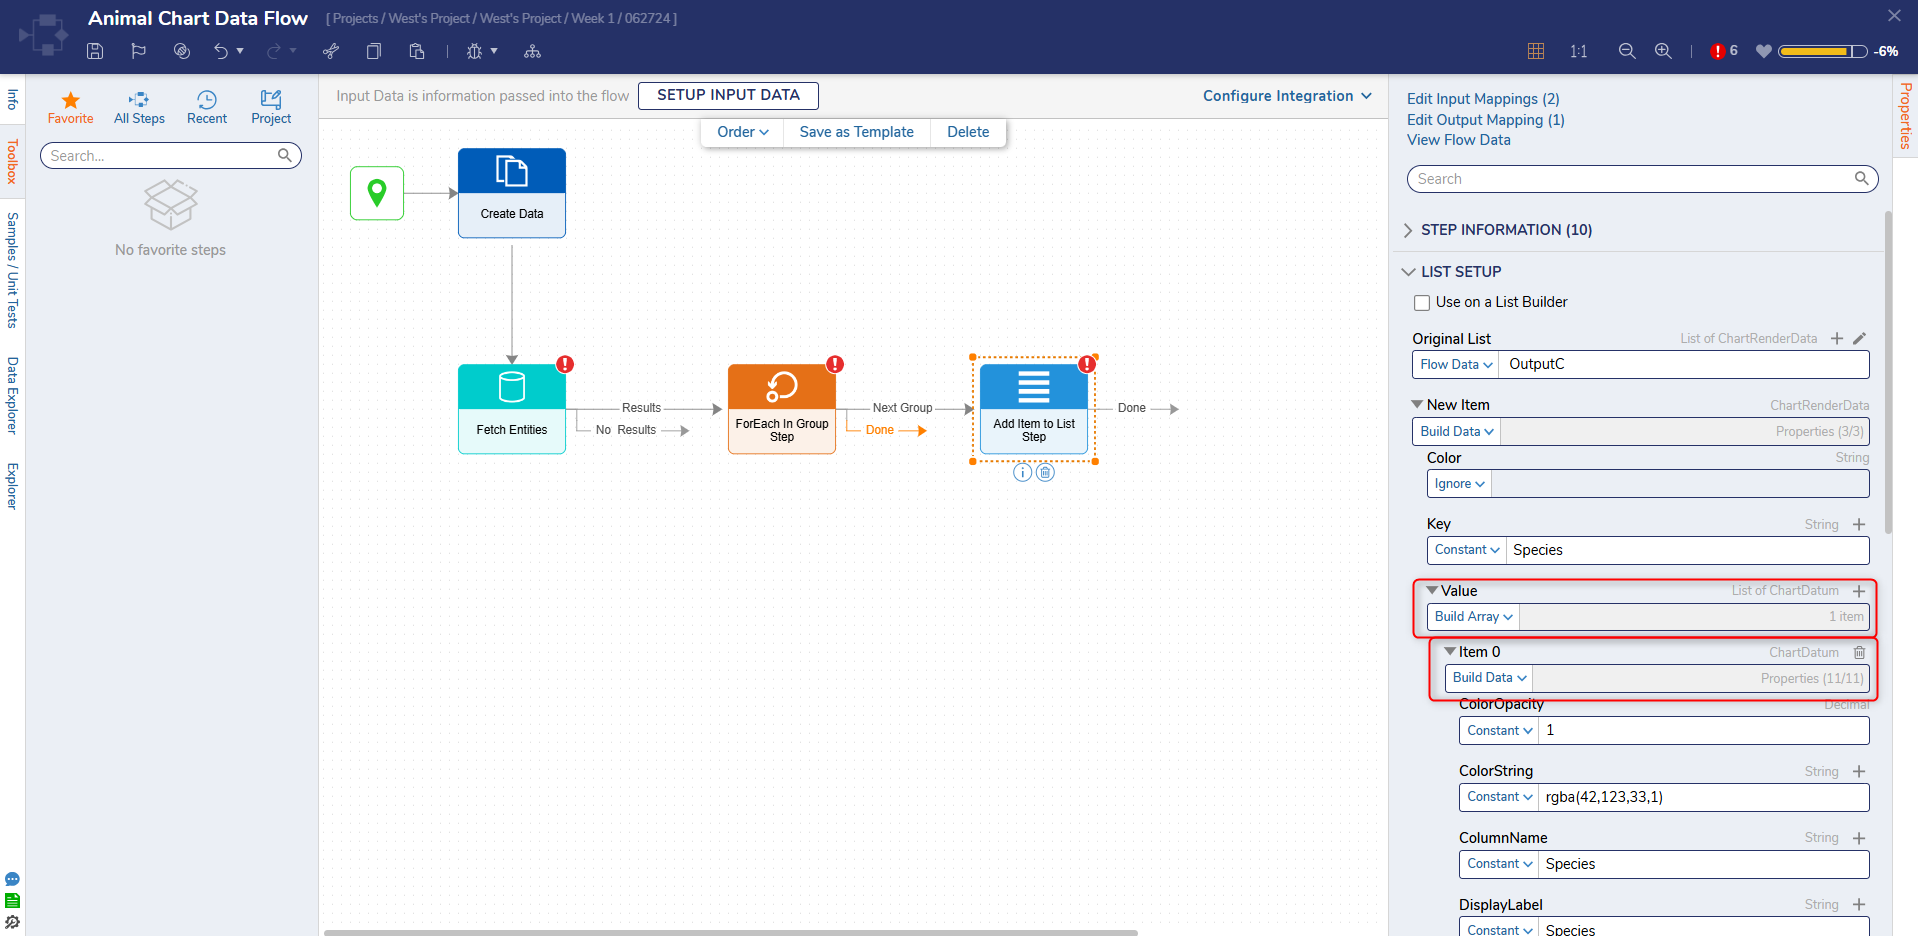
- Set the New Item field mapping to Build Data. Select Ignore next to the Key field and enter "Species".
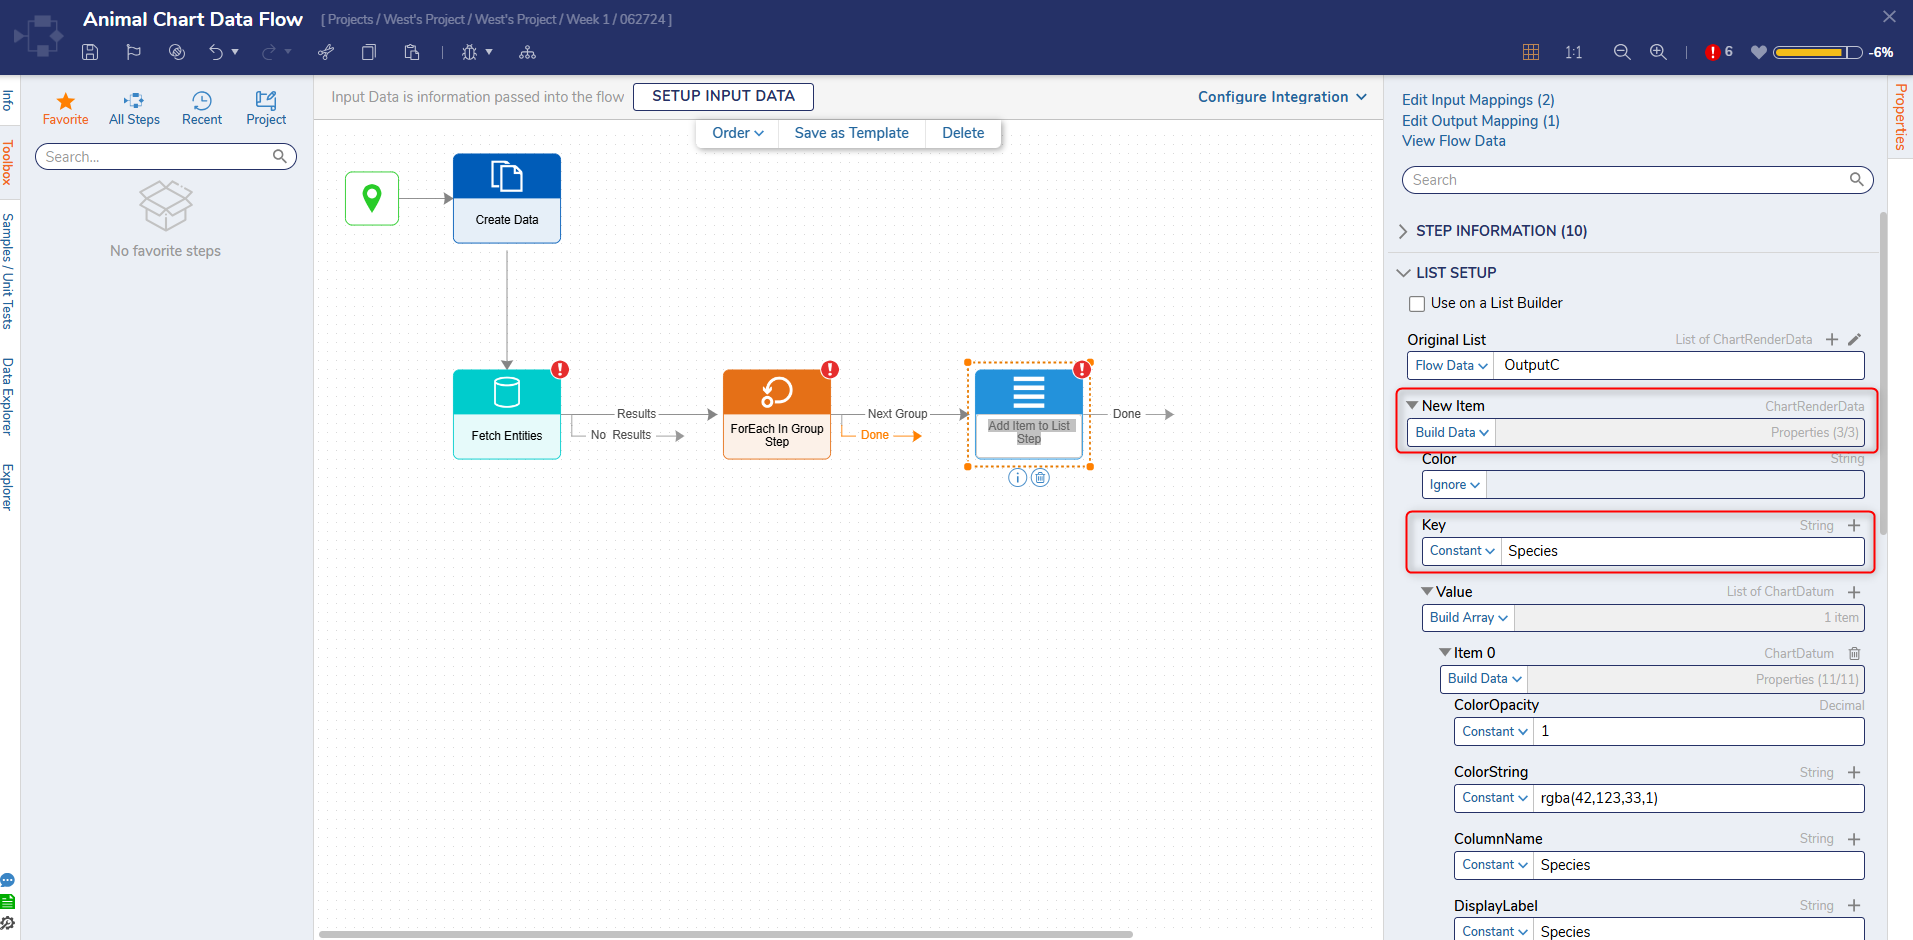
- Change the mapping for Value from Ignore to Build Array. Set the mapping of Item 0 to Build Data.
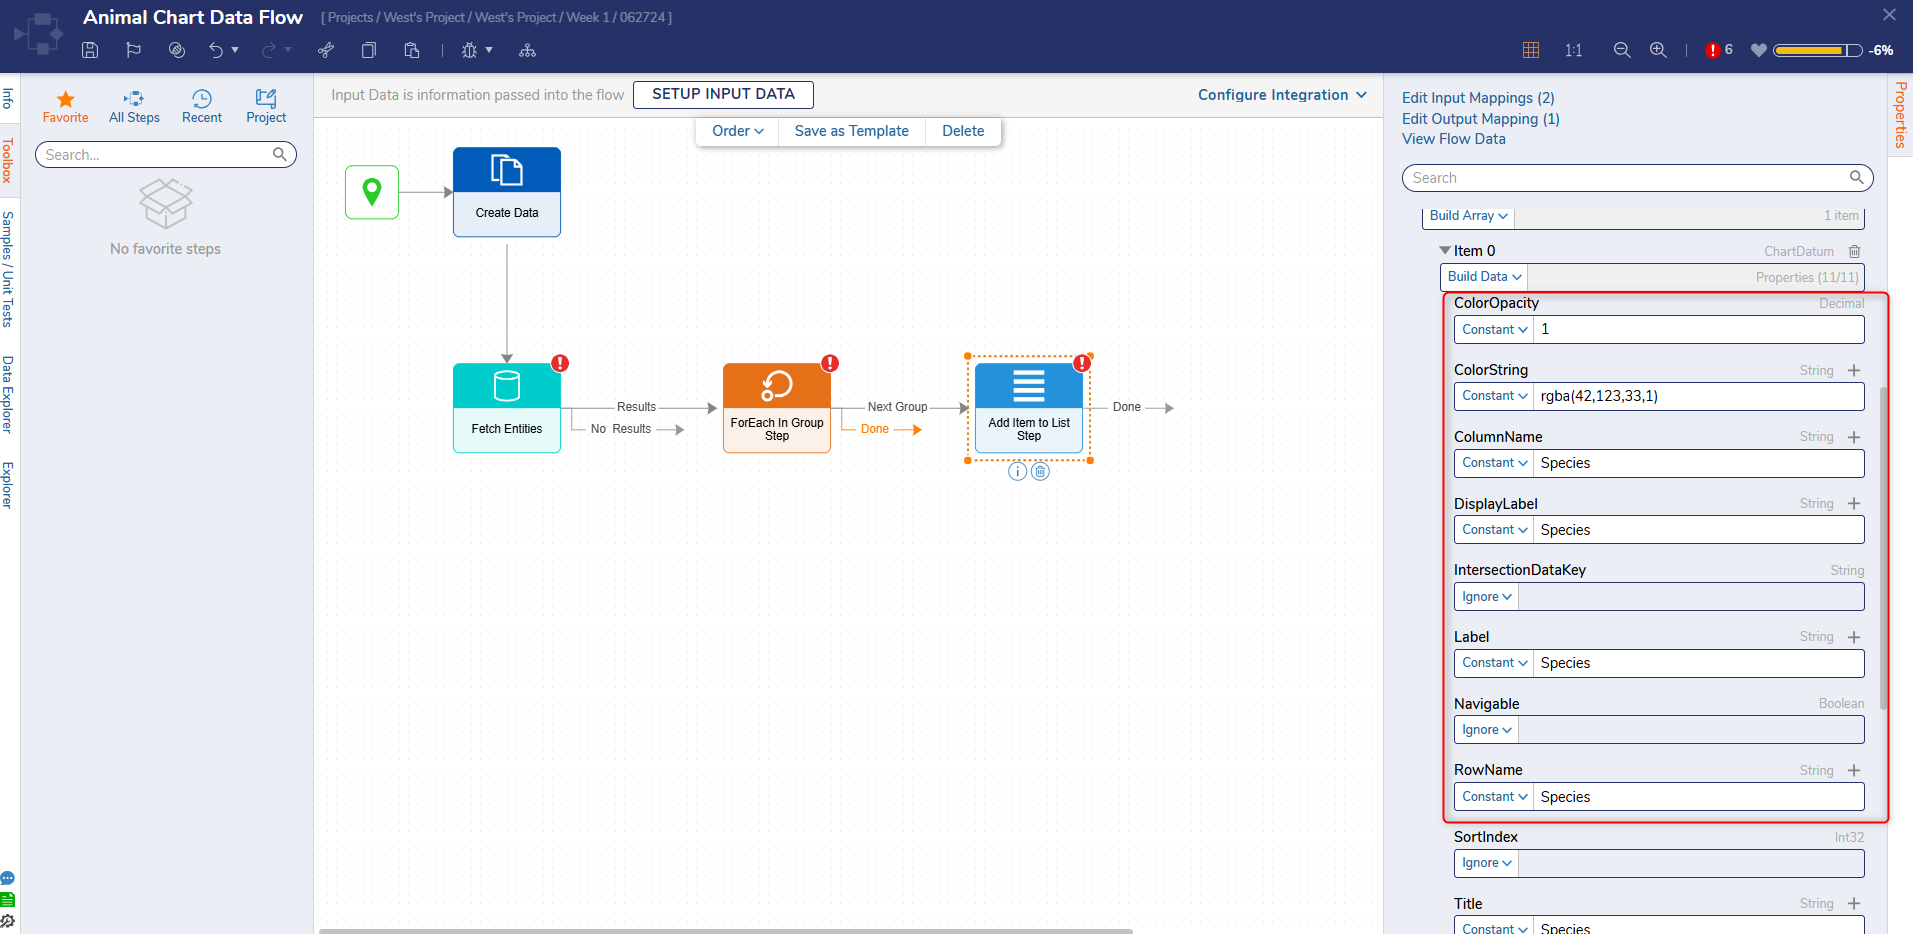
- Change the ColorOpacity mapping to Constant and enter "1".
- For the ColorString field, enter "rgba(42,123,33,1)". Set the values of ColumnName, DisplayLabel, Label, RowName, and Title to "Species".
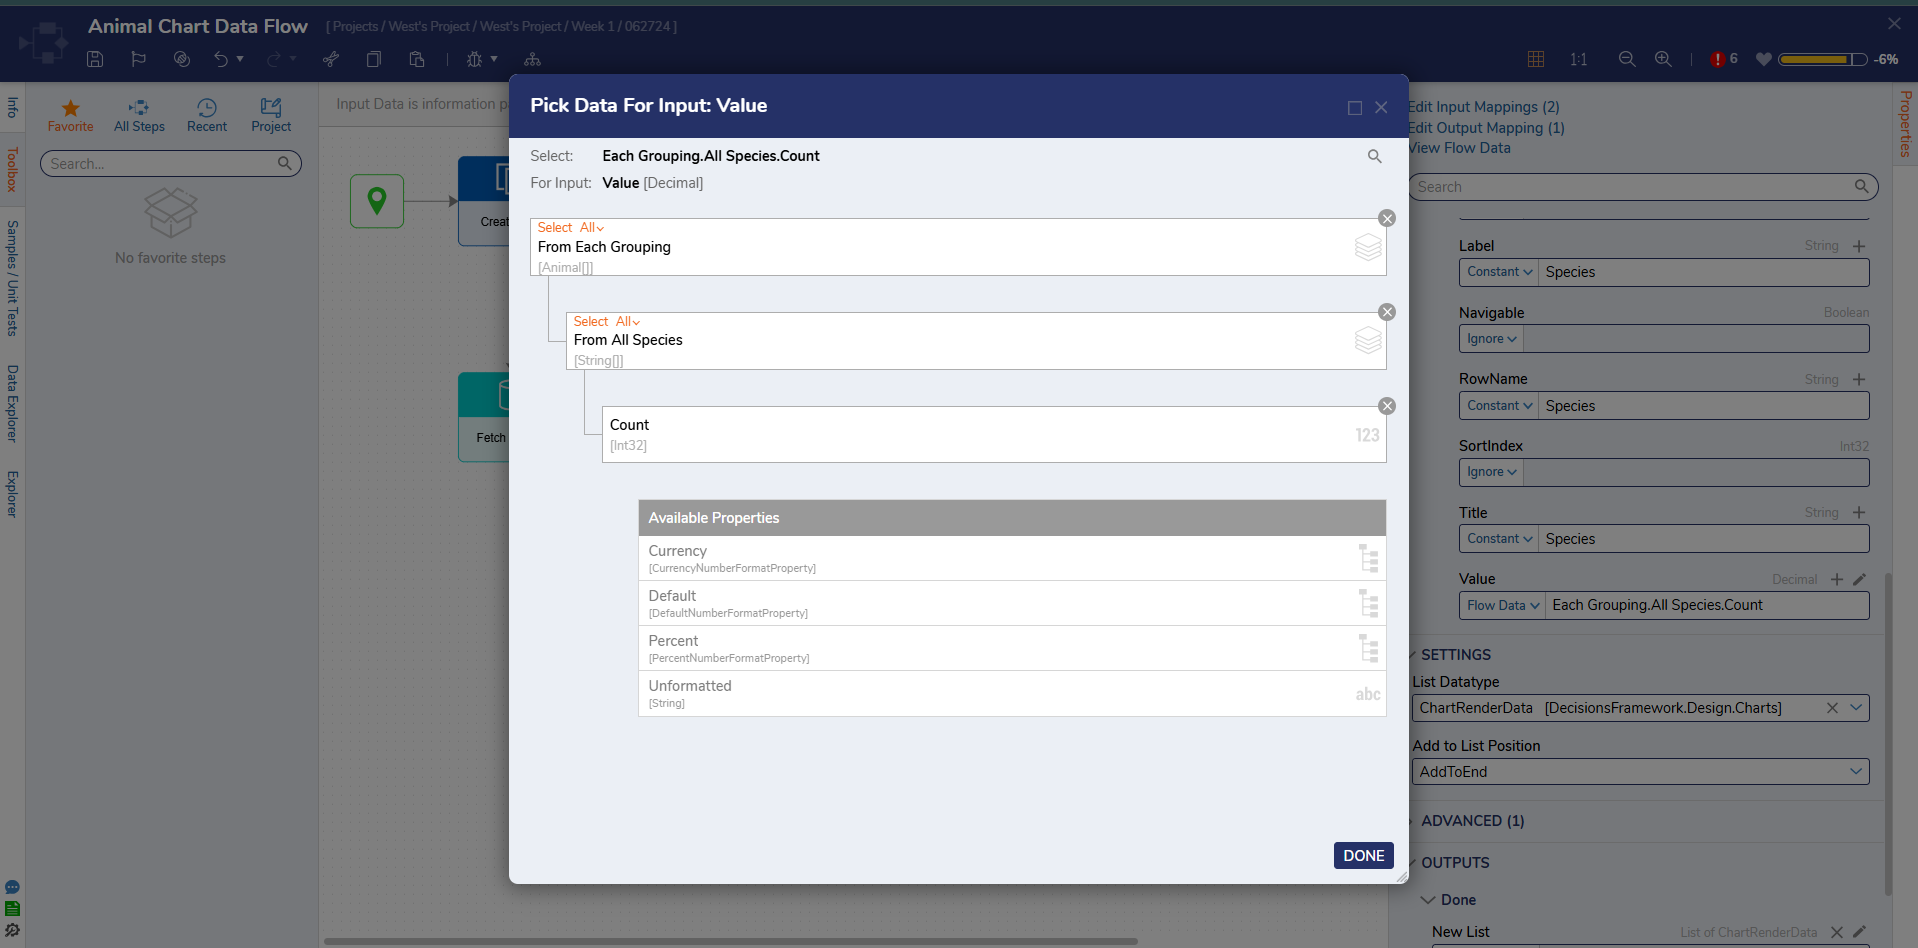
- Change the mapping of Value to Select from Flow. Select Each Grouping > All Species > Count and click DONE.
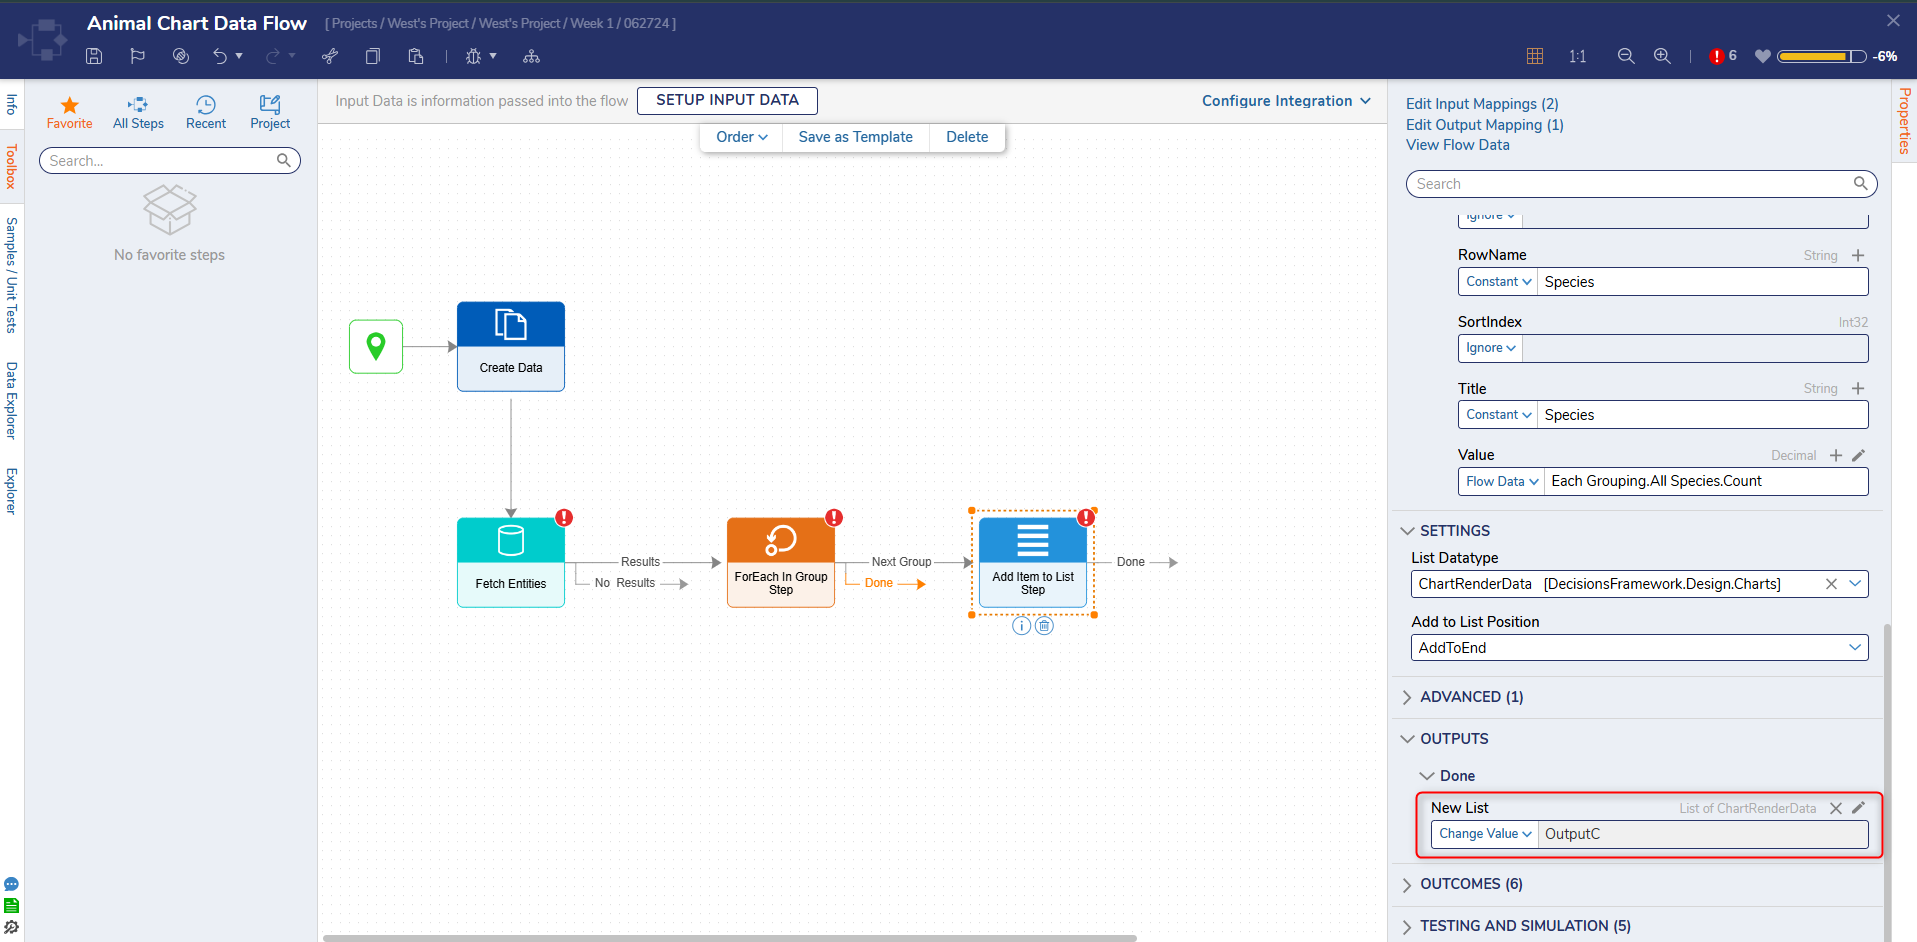
- Change the mapping of Original List to Select From Flow and select OutputC.
- Under the OUTPUT category, map the New List field to Change Value and pick OutputC.
- Connect the No Results path and the Done path of the ForEach In Group step to the End Step. Connect the Done path of the Add Item to List step to the ForEach In Group step.
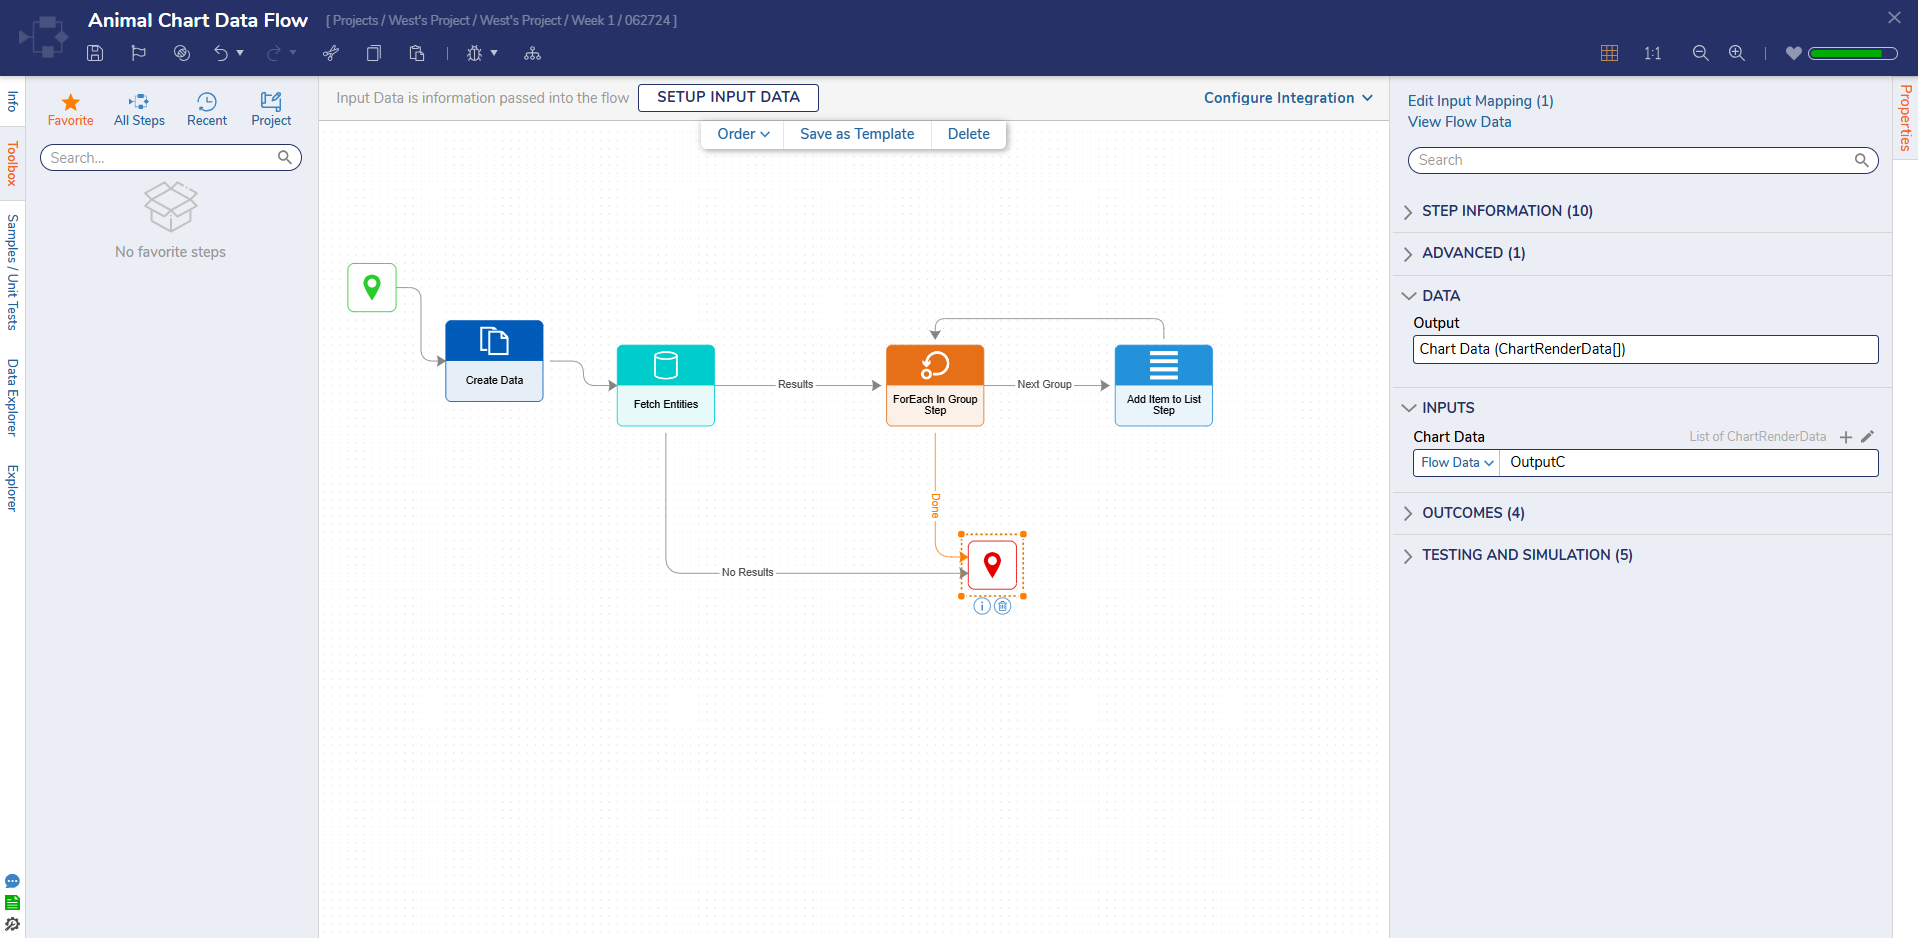
- Select the End step and map the Chart Data to OutputC.
- Click Save and close the Designer.
- Click Save and close the Page Designer.
- Add the Page to a Designer Folder to see the chart created.
Feature Changes
| Description | Version | Release | Developer Task |
|---|---|---|---|
| Chart Flows are now Page Aware | 9.8 | March 2025 | [DT-043315] |
| Chart Flows are now Folder aware. | 9.5 | November 2024 | [DT-042016] |
For further information on Pages, visit the Decisions Forum.