Overview
A user can add a chart to display the Report's data in a different format when viewing a Report. There are many chart types, including Pie, Bars, and Columns. A Report must have grouping established to add a chart at runtime.
Example
- On an existing Page, select the Report Viewers Settings
 icon. Under Actions, select the Add an Ad-hoc chart
  icon.
icon.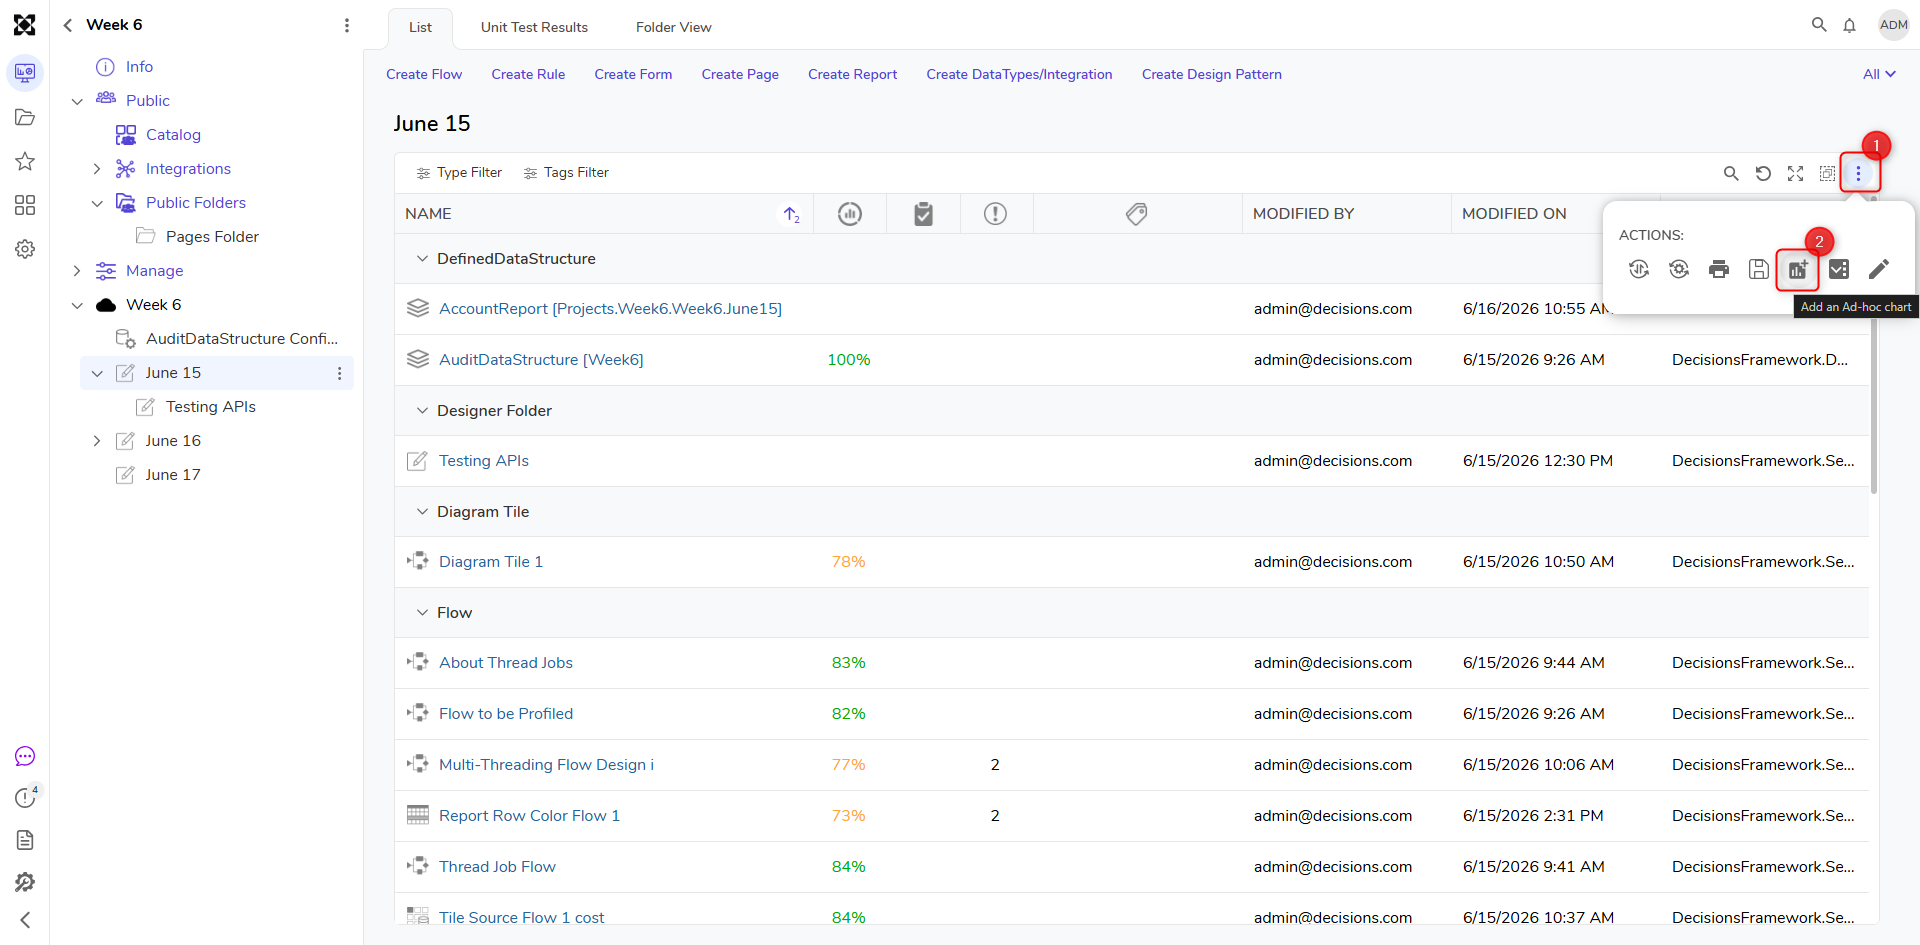
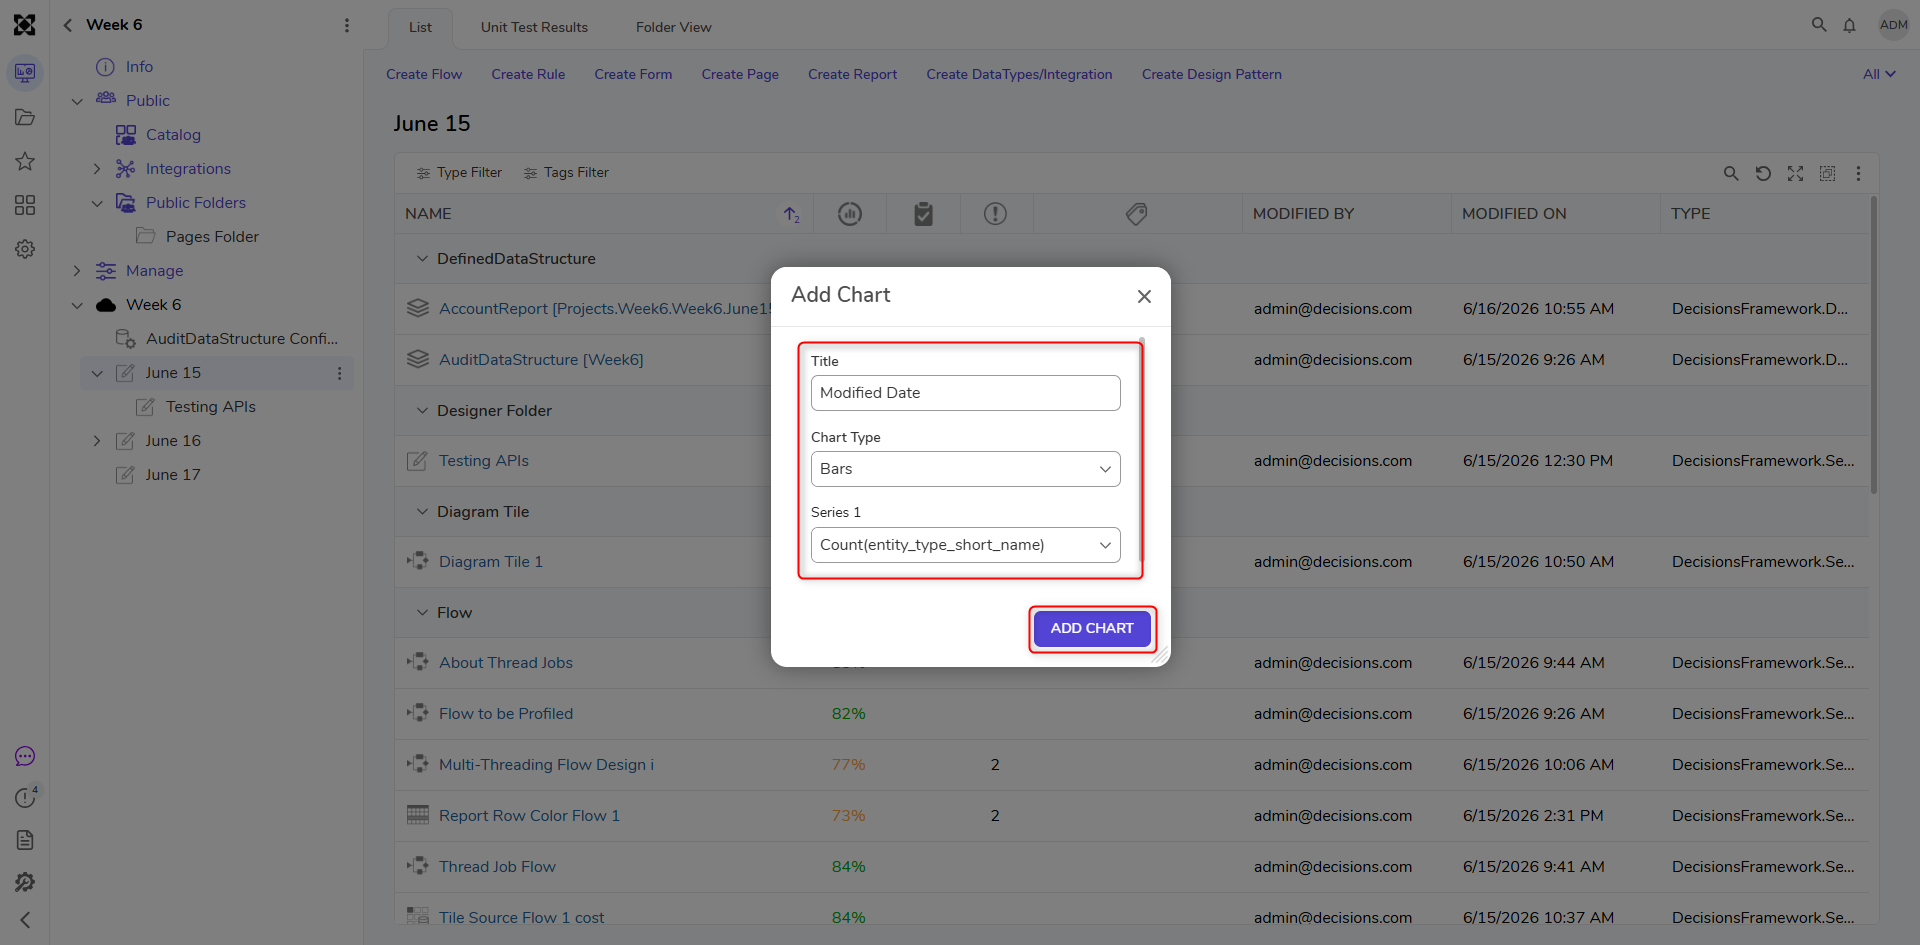
- In the Add Chart dialog, select the Chart Type and give the Chart a Title. If multiple groupings exist on the Report, pick the specified grouping in the Field drop-down.
- Select ADD CHART.
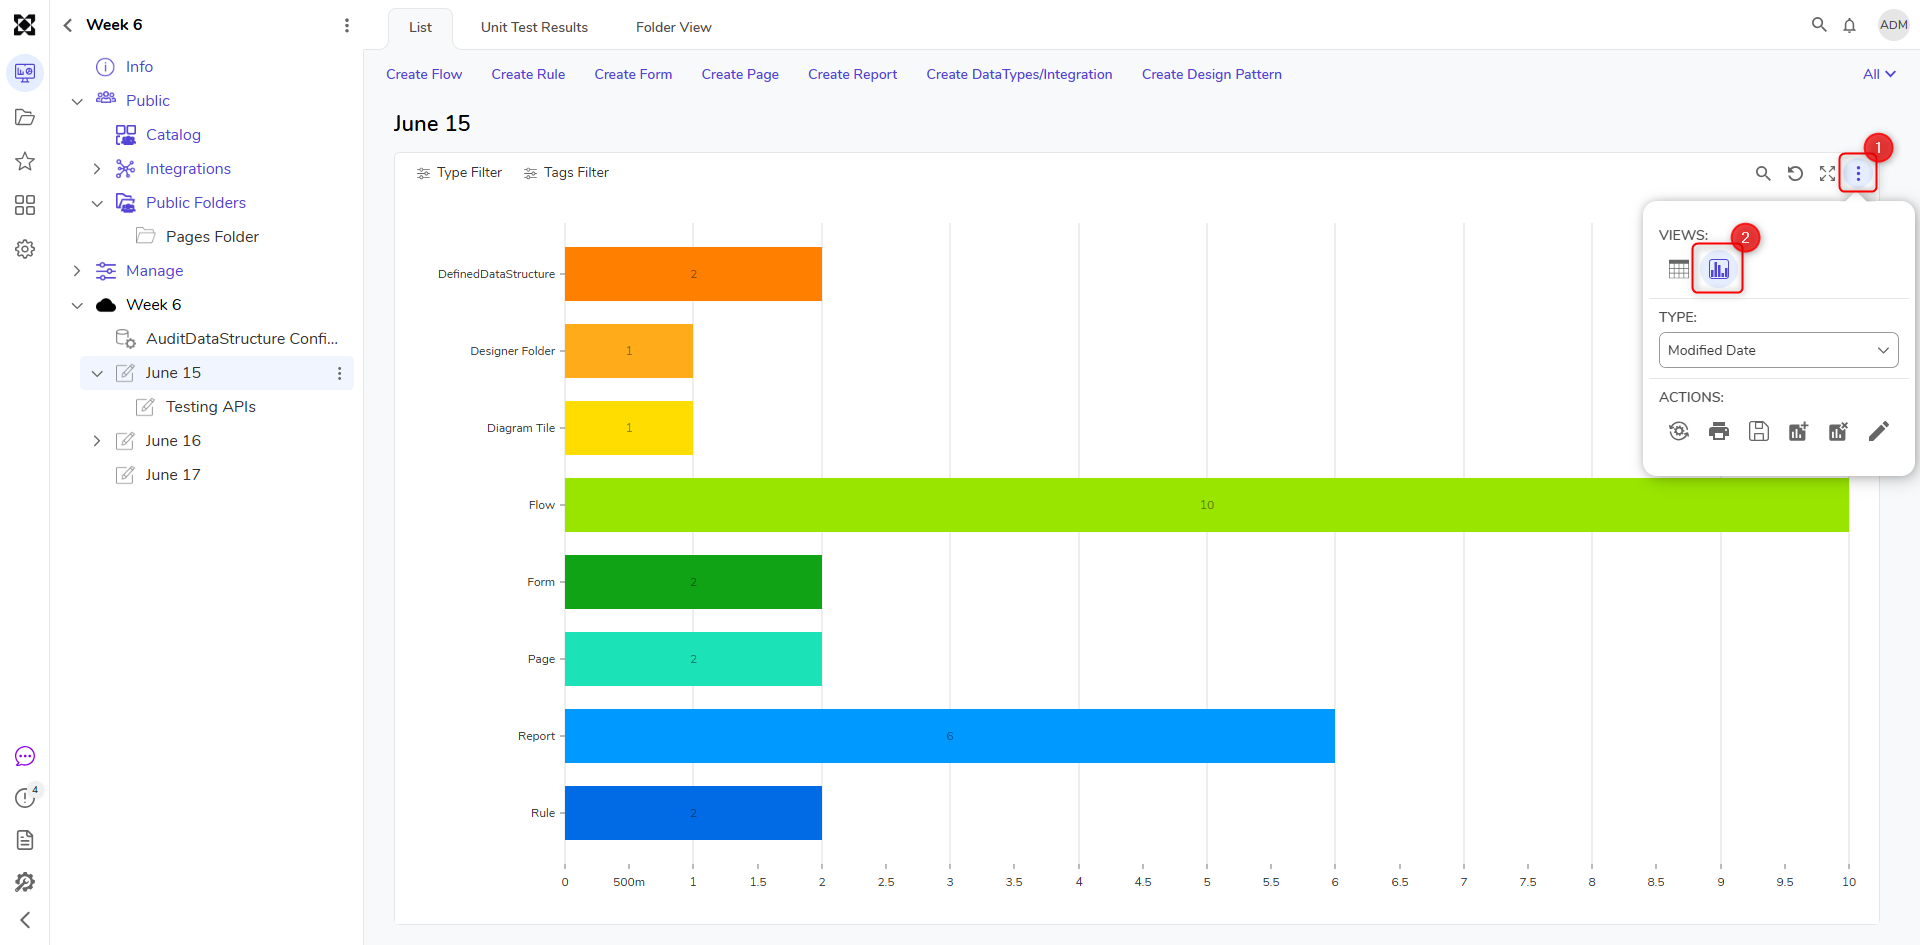
- The ad-hoc chart will appear under Views. To remove the ad-hoc chart, click the Remove Ad-hoc Chart
 button.