Overview
The Color Rules feature empowers users to apply icons and colors intelligently and dynamically within Reports. This enables users to define complex logic, allowing the application of different icons to specific rows and/or columns within the Report based on predefined conditions.
| Potential Use Cases | Description |
|---|---|
| Account Status Indicators | In financial services, Reports often display a multitude of accounts with varying statuses, such as active, pending, or closed. Financial institutions can strategically assign different icons to represent each account status by utilizing Color Rules. For example, an account eligible for online banking may be indicated by a checkmark icon, while a pending application may be marked with an hourglass icon, providing instant visual recognition of account statuses to bank staff and clients alike. |
| Risk Assessment Icons | Within financial analysis Reports, risk assessment is a crucial aspect. Financial analysts can implement icons representing different risk levels by utilizing Color Rules. For instance, a low-risk investment opportunity may be denoted by a green thumbs-up icon, while a high-risk investment is represented by a red caution icon. This feature allows stakeholders to quickly assess risk profiles, aiding in better decision-making and portfolio management. |
| Supply Inventory Management | Healthcare administrators can utilize the Color Rules feature to manage supply inventory efficiently. By assigning different colors to items based on stock levels, administrators can quickly identify critical supplies running low. For example, items with a red color could indicate low stock levels, prompting immediate reordering, while items with a green color signify sufficient stock. |
| Budgetary Control | Administrators can leverage Color Rules to keep a close eye on supply expenditures. Depending on costs or budget allocation, different colors can be assigned to supply items. For example, high-cost items may be represented by red, drawing attention to potential budgetary concerns, while lower-cost items may have neutral colors. |
Example
- In a Designer Project, create a Report. The example Report will use the Account Data Source. The Data Fields for the Report are Email Address, Account ID, and Account Type.
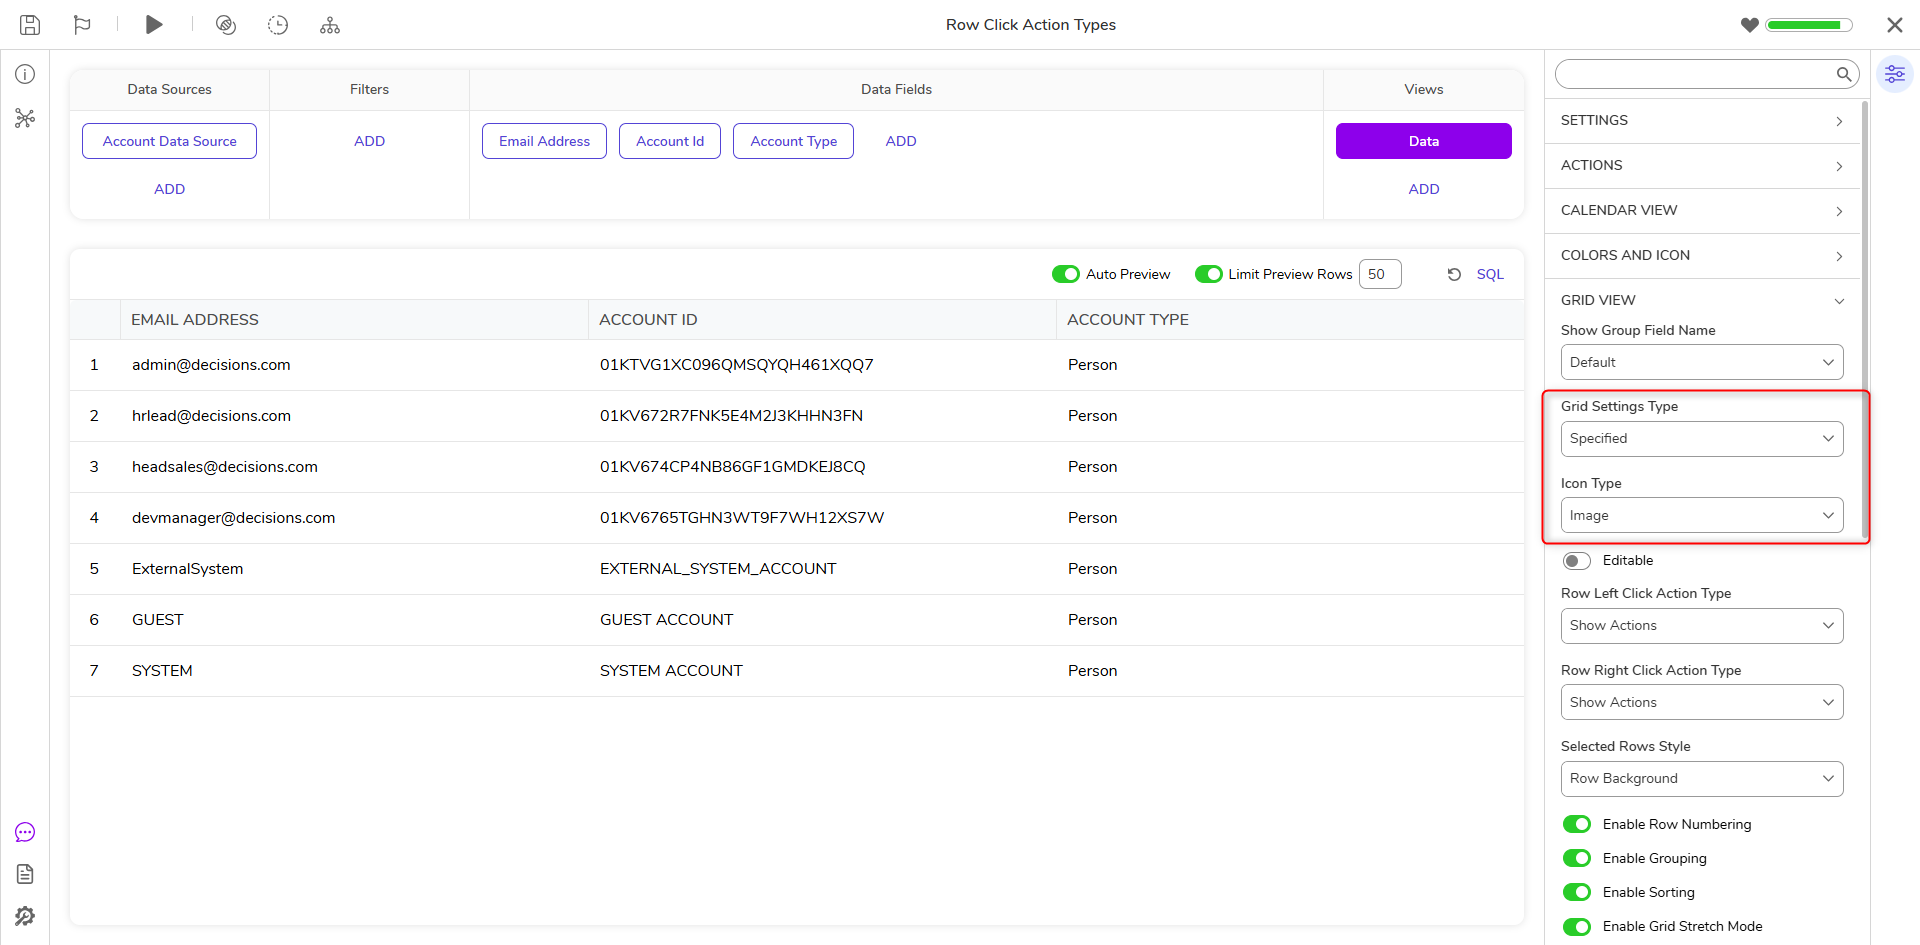
- Adjust the Report Grid View so the Icons will show up. Expand the Grid View section in the Properties panel. In the Grid Type drop-down, select Specified. This selection will provide additional options for configuring the Grid Settings. Selecting Specified also automatically adjusts the columns to their specified width; this can be adjusted within each Data Field Properties panel.
- From the Icon Type drop-down, select Image.
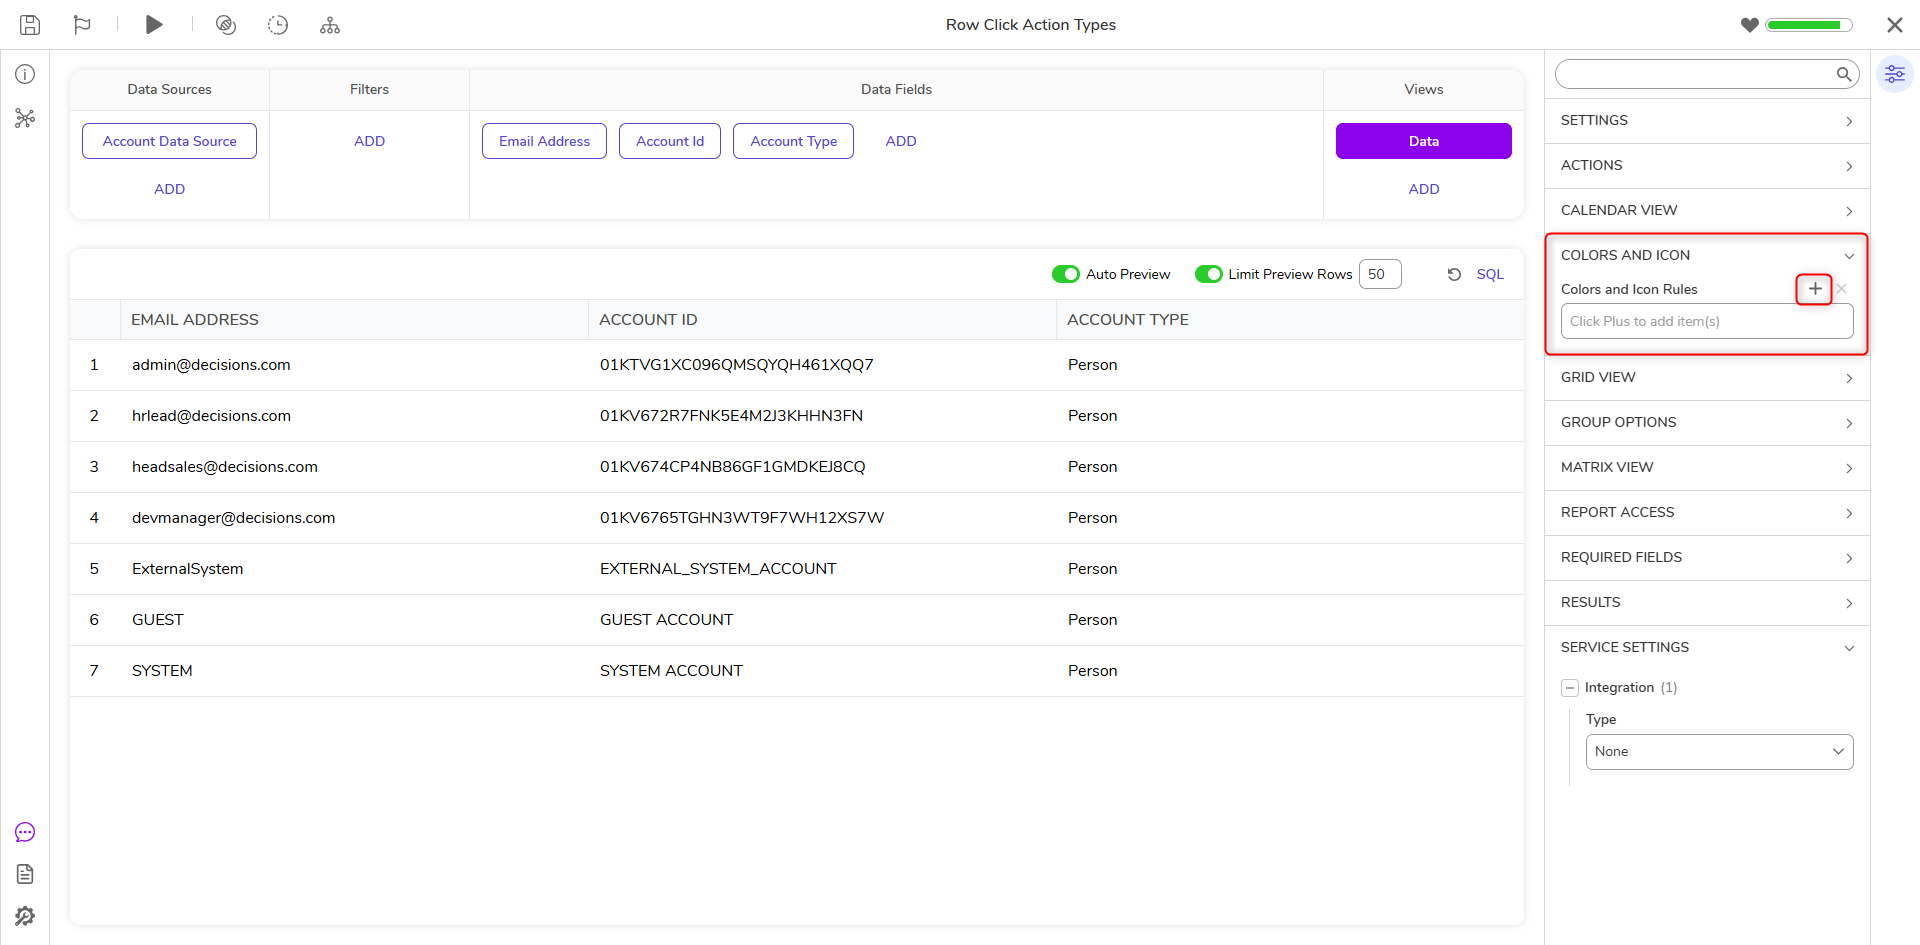
- In the Is Active Column Properties, expand the Colors and Icon section in the Properties panel and select +.
- In the resulting dialog, locate the Rule Source drop-down, choose Icon Flow, then select 'PICK ICON FLOW'. Name the Flow, then select 'Create'.
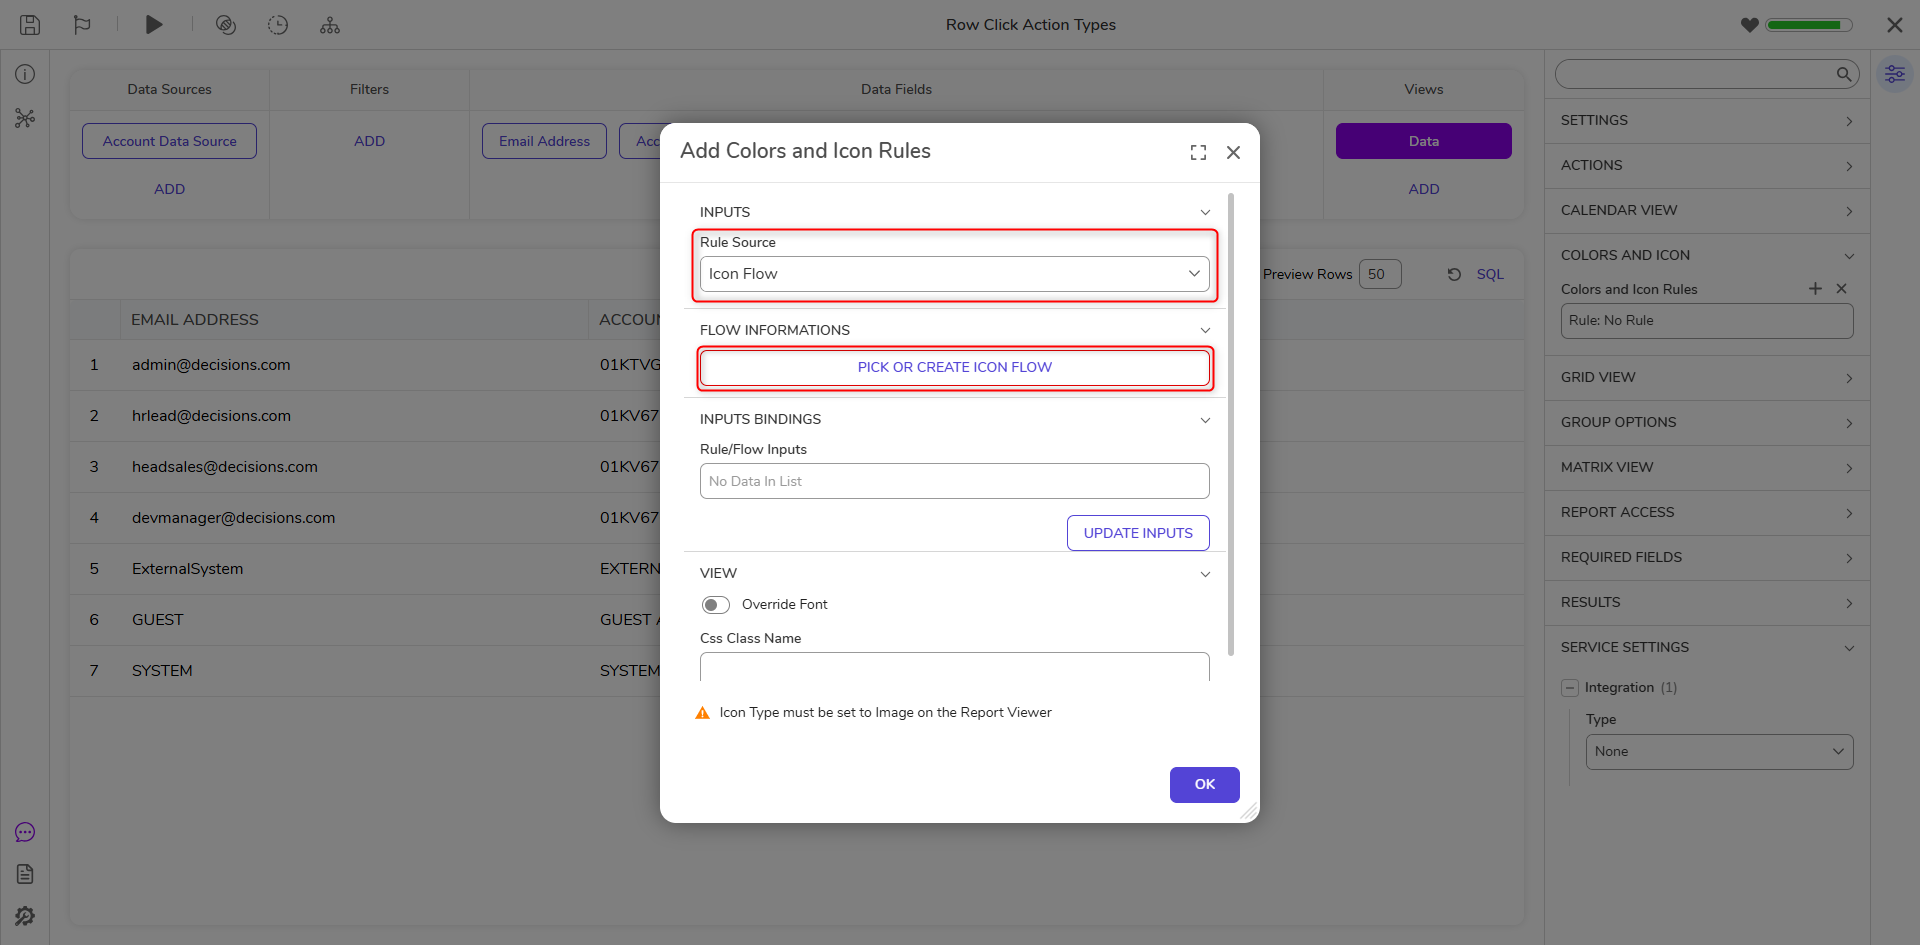
- Please refer to our example lab article for more detailed information on building out Icon Flow logic: Using Icons on Reports Icon Flow Logic.
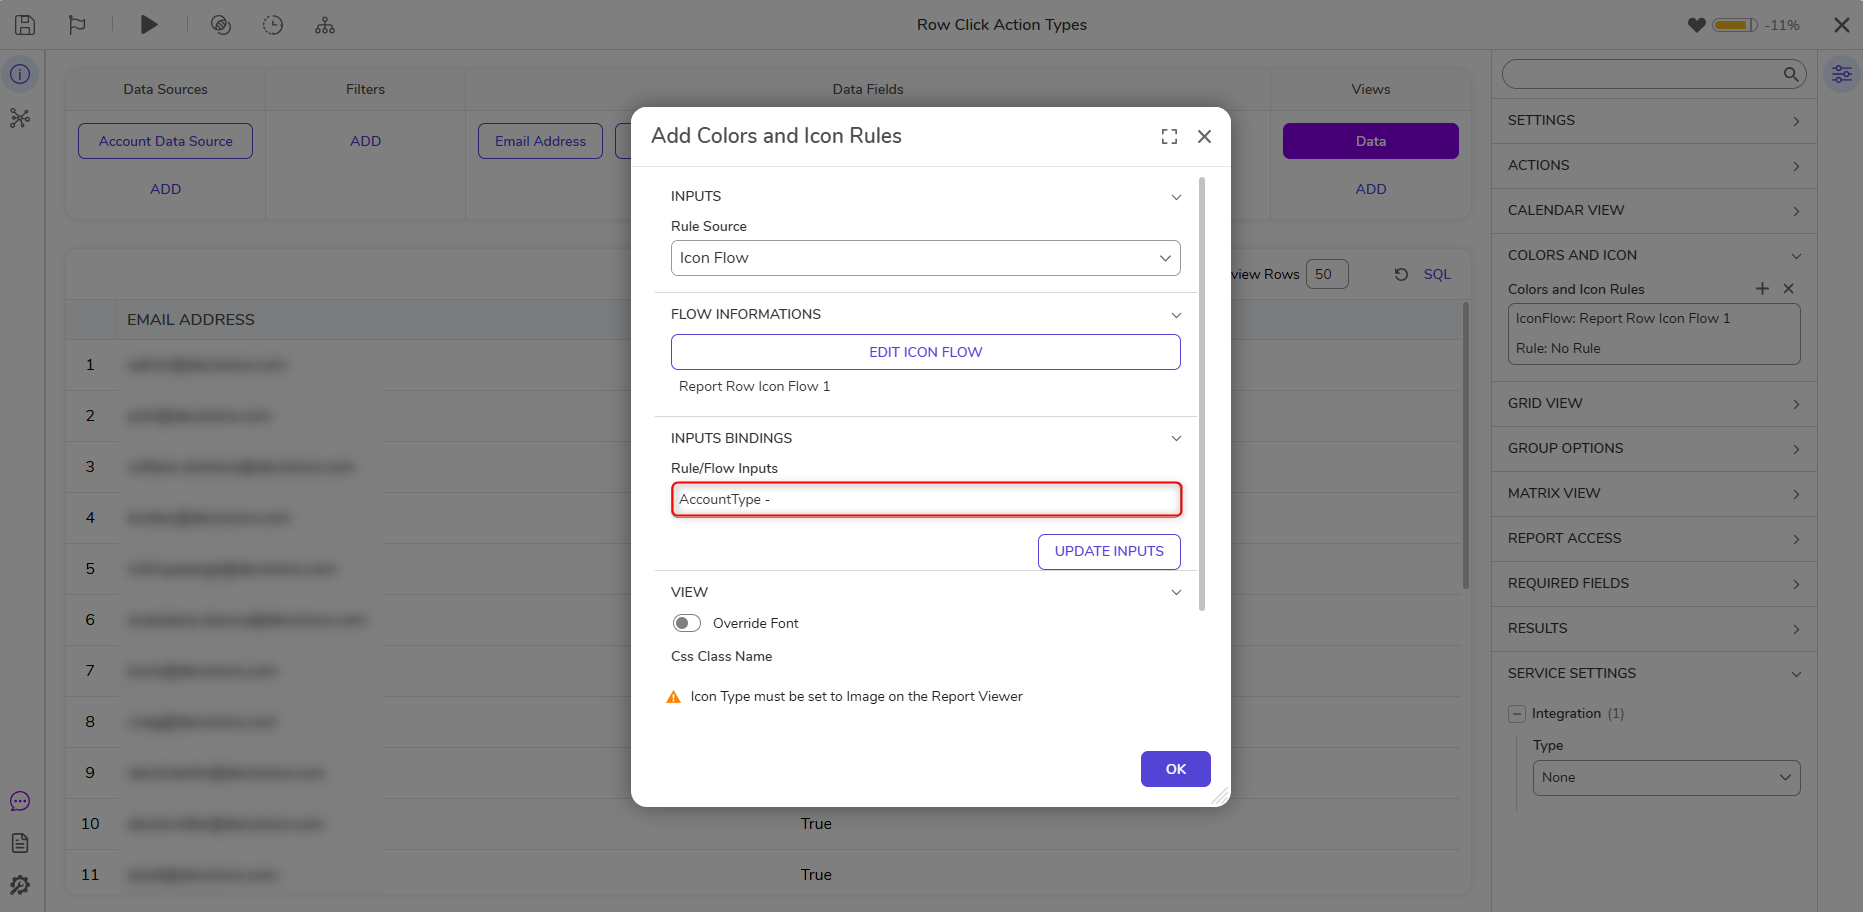
- Back in the Report Designer, select Update Inputs in the Add Colors and Icon Rules dialog. This will populate the Flow/Rule Inputs Data Grid; select the pencil icon next to the IsActive input.
- In the resulting window, in the Report Field drop-down, choose AccountType and select OK.
- The Report will now display icons according to the data within the specified column.
- Additionally, in the Column Properties, set "Hide Column Text" to true to display the icon attached to the column.