Upon opening an event log in Decisions Process Mining, a Dashboard tab is automatically generated alongside an Analyzer tab. By default, the Dashboard opens a standard Dashboard tab housing several key points of information all in one location for easier monitoring of Decisions Process Mining's results within the event log. However, if wishing to monitor additional and/or different KPIs, users may instead construct a custom Process Dashboard. The following explains all data within each tab of the Dashboard.
Dashboard Tabs
Data within most of the Dashboard's tabs may be exported as a CSV with the icon button above the graph view on the right. However, the Cases/Activities over Time, Work-In-Progress, and Resource tabs cannot export as a CSV.
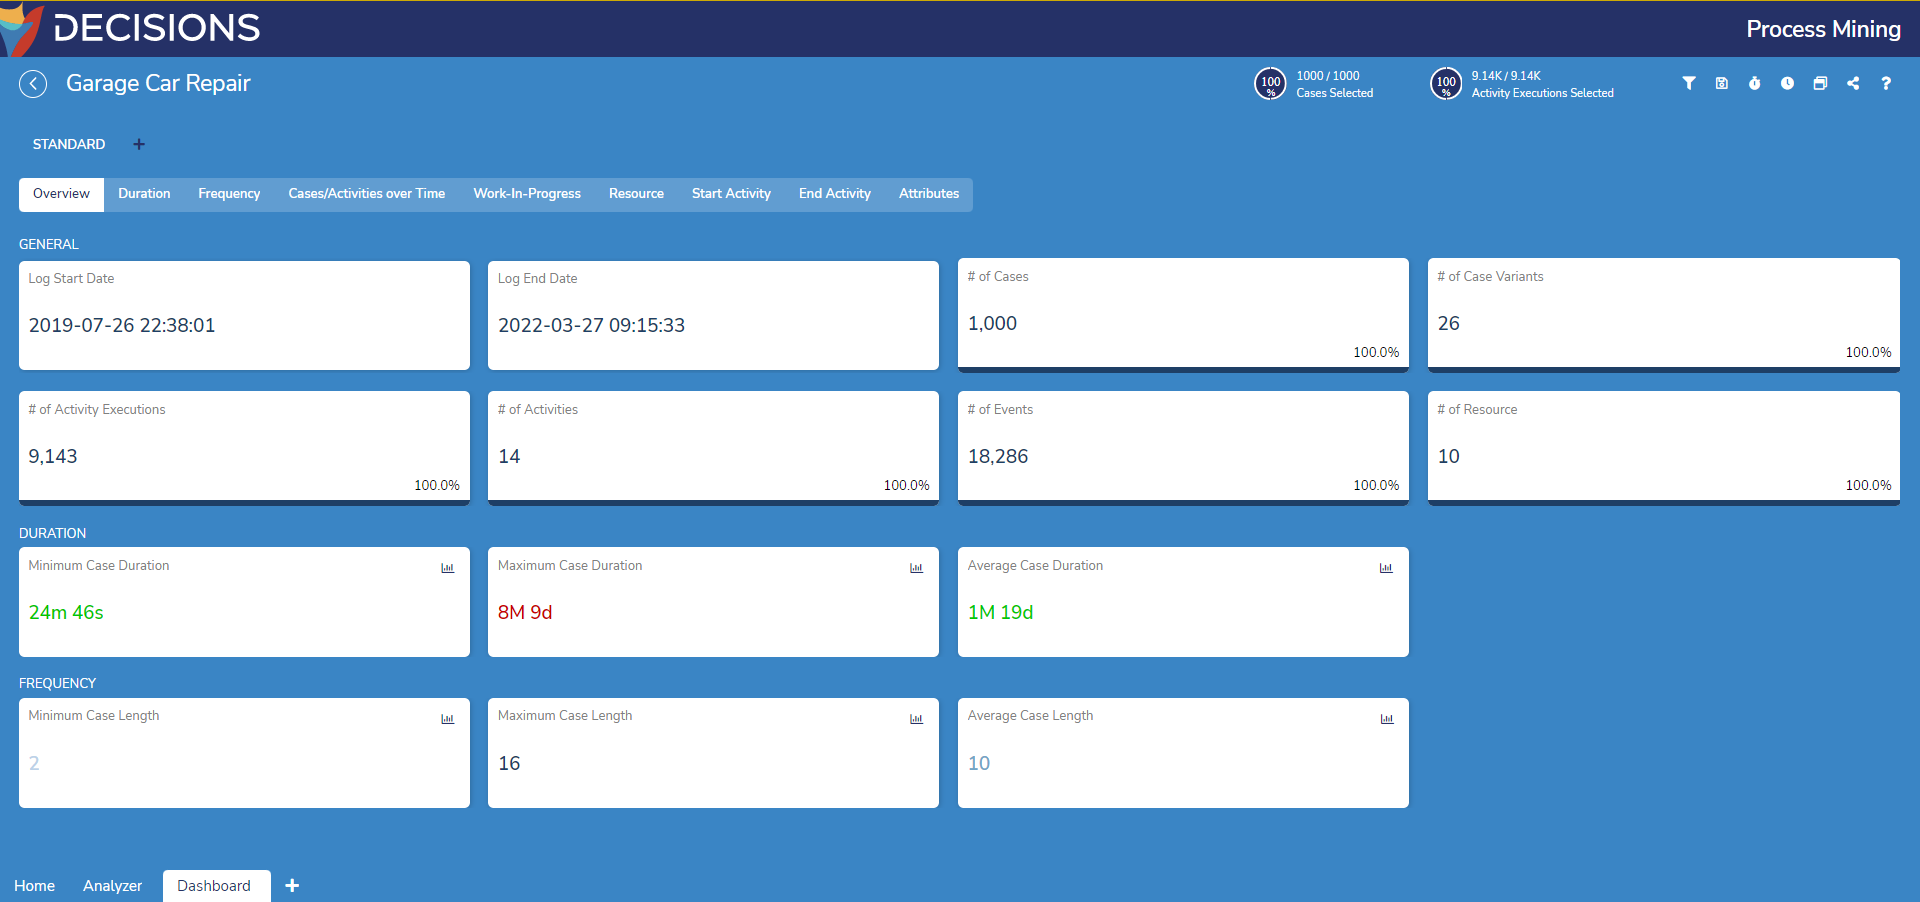
Overview Tab
The Dashboard main tabs offers an basic information of the event log at a glance such as:
- The time-frame within which the data recorded occurred.
- The number of cases, cases variants, event, activities, and resources recorded.
- The minimum, maximum, average, and median duration of a case.
- The minimum, maximum, average, and median number of activities executed.
Duration Tab
The Duration tab provides information regarding the amount of time required to perform each case recorded in the event log and the waiting times cases are subject to while being performed. Moreover, it also provides information about average, median, minimum, maximum, and total amount of time elapsed as part of the execution of each activity or resource and handover. Furthermore, users may configure the Duration tab to display duration statistics for cases, case waiting time, activities, and handovers. When displaying activities or handovers, the view changes to a report table displaying the activities/handovers' frequency and duration. SLA may also be configured by changing the time count and providing a number. After selecting Apply, the pie chart to the right changes along with the percentage of cases within the provided SLA specifications.
Frequency Tab
The Frequency tab presents information relating to the number of activities performed in each case recorded in the event log. Furthermore, it also details the average, median, minimum, and maximum number of times each activity or resources and handover. Users may select between the frequency statistics of case length, activities, and handovers. When viewing activities and handovers, the view changes to a report table displaying frequency and frequency per case.
Cases/Activities Over Time Tab
The Cases/Activities Over Time tab shows the distribution of the number of cases and activities performed on a daily, monthly, or yearly basis. In addition to viewing case distribution, users may also view the distribution of activity executions.
Work-In-Process Tab
The Work-In-Process tab provides for each activity information about the distribution of the number of instances of that specific activity being performed on a daily, monthly or yearly basis. Each line on the graph represents an activity as the graph depicts its number of activity executions over time. Users may add or remove activities on the graph by expanding the Activities dropdown menu.
Resource Tab
The Resource tab provides statistical information on the following:
| Information View | Description |
|---|---|
| Resource Utilization | Visualizes the amount of time a resource is busy performing work during a case. |
| Resource Performance | Visualizes the performance of each resource when performing different activities within a case. |
| Activity Performers | Visualizes the fastest and the slowest resources for performing each activity. |
Start Activity / End Activity Tab
The Start Activity and End Activity tabs detail which activities are the first/last ones performed in a execution as well as how often they are performed at the start/end of a process instance.
Attributes Tab
The Attributes tab displays information about all the attributes contain in the event log. Users may select which attribute to analyze via the left side menu. Each attribute then illustrates the distribution of its values as either a bar chart or a table.
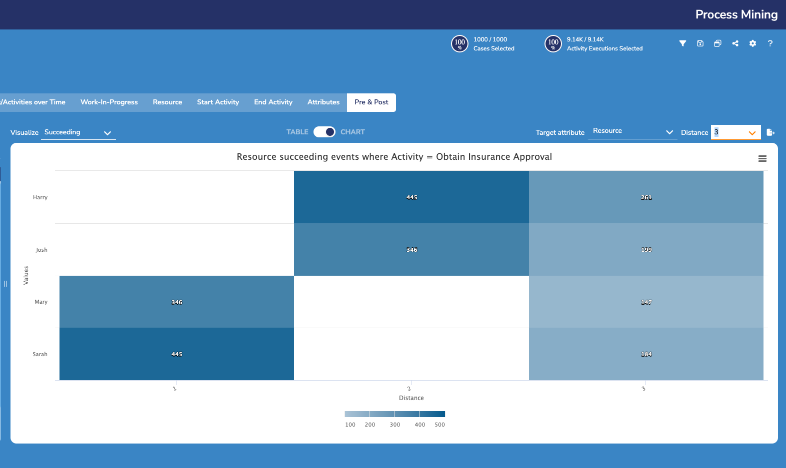
Pre & Post Tab
The Pre & Post tab displays the preceding, succeeding, and current data depending on the selected reference attribute and target attribute. The user can specify a number for the Distance of attributes from the selected reference attribute.