Setting Min and Max on Charts
- 24 Jun 2021
- 1 Minute to read
- Print
- DarkLight
Setting Min and Max on Charts
- Updated on 24 Jun 2021
- 1 Minute to read
- Print
- DarkLight
Article Summary
Share feedback
Thanks for sharing your feedback!
Overview
Charts on Reports can have a set minimum and maximum number for data displayed. In this example, display the data in a Report with a Bars chart, then adjust the minimum and maximum settings.
Example
- In an existing Report, select the Column Settings icon, and under Group By, select Created On Date.
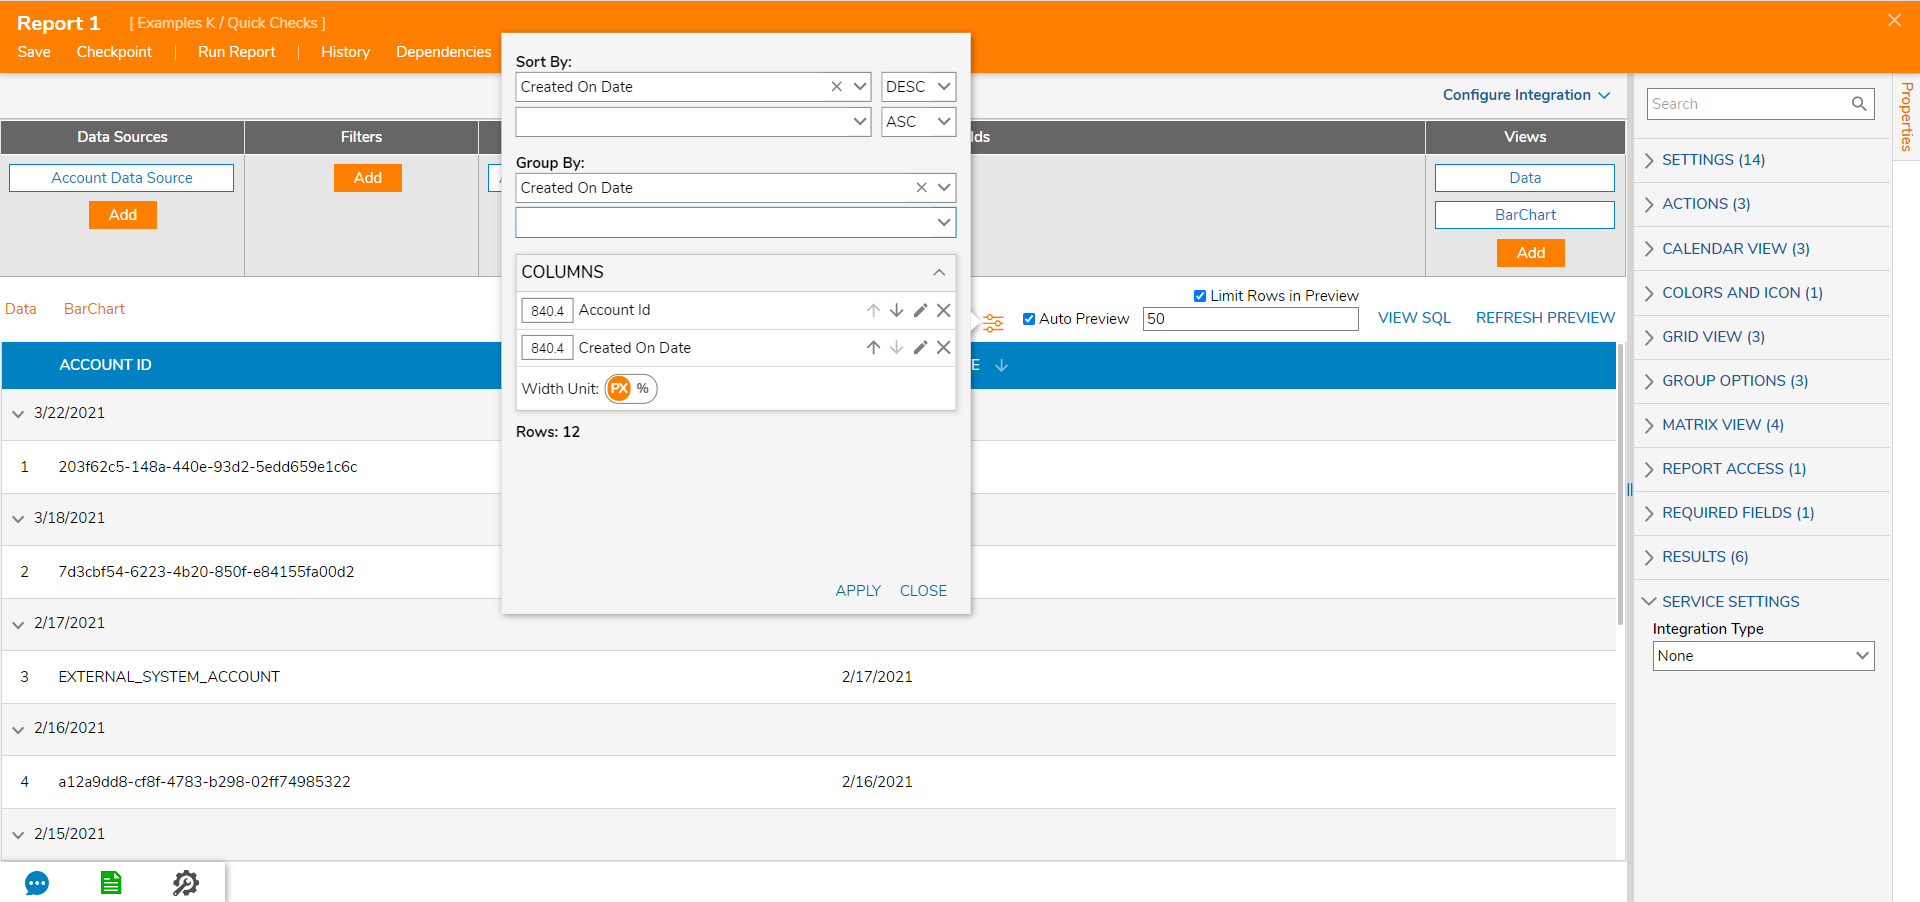
- Under Views, select Add > Charts > Bars.
.png)
- In the Add Bars Chart dialog, name the chart and select OK.
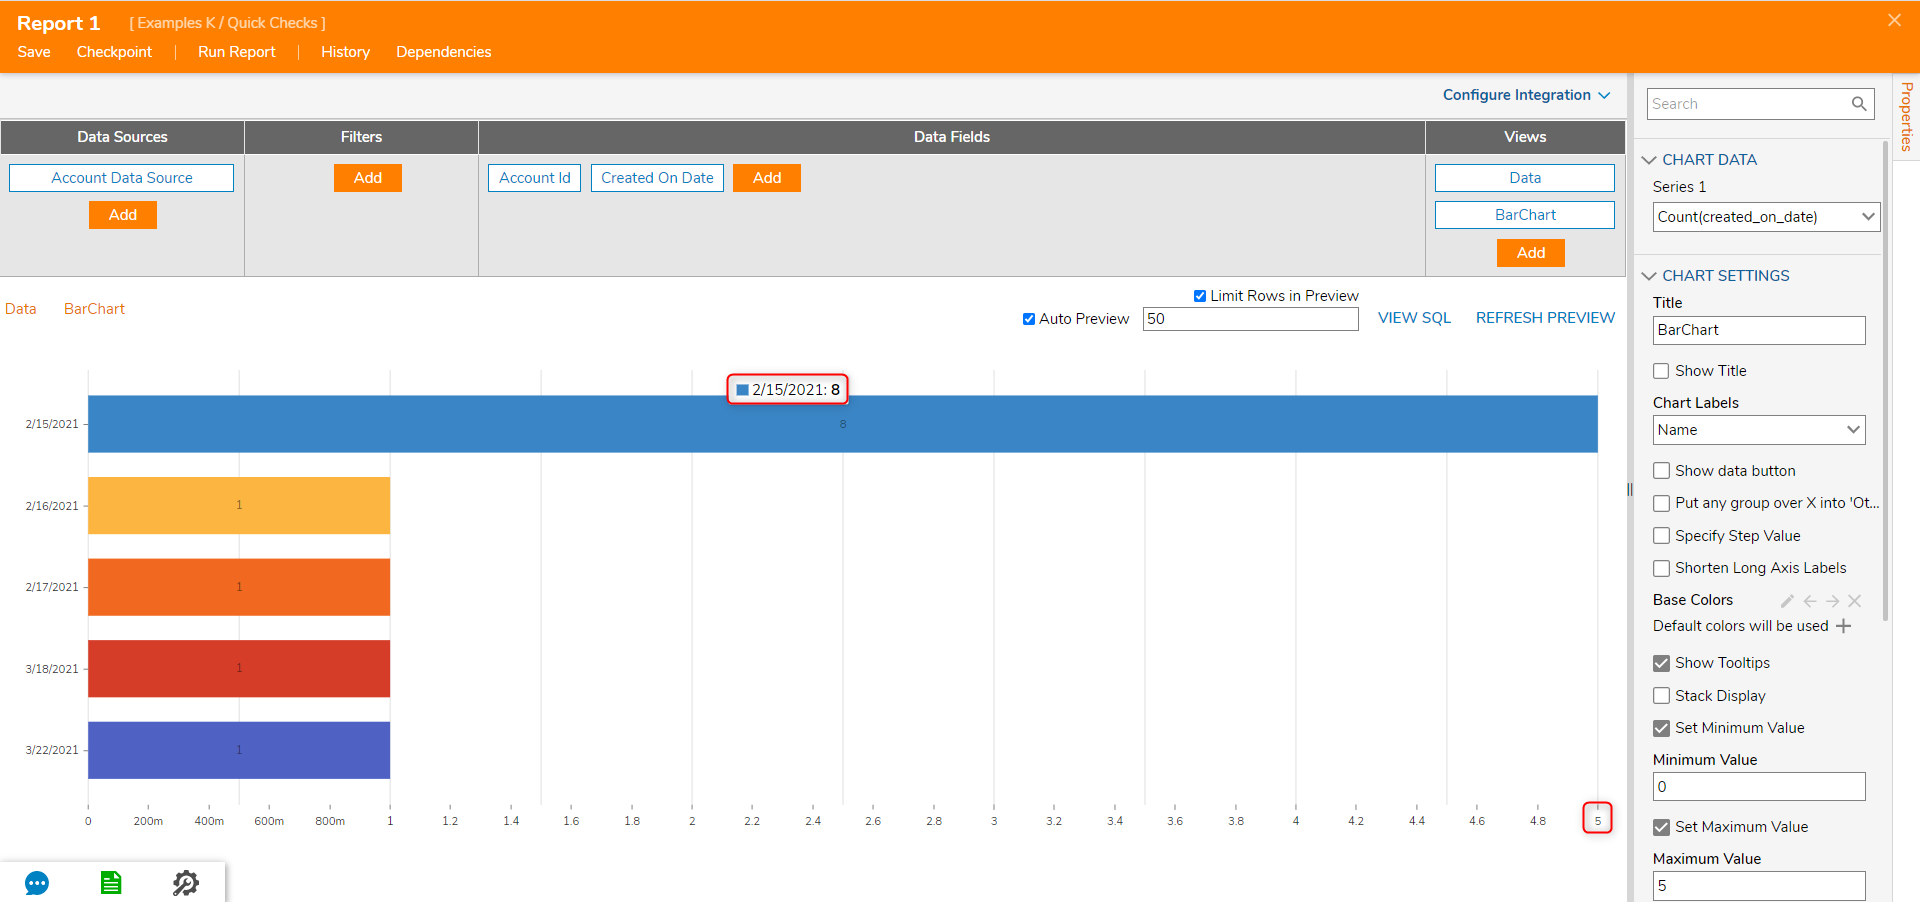
- Set the Set Maximum Value and Set MinimumValue to true. Then set the value below.
.png)
- Notice that the Report adjusts the chart to respect the maximum value while still displaying each bar's total value in the chart.

.png)
.png)

Was this article helpful?