Configuring Charts with a Diagram Tile
- 10 Aug 2021
- 2 Minutes to read
- Print
- DarkLight
Configuring Charts with a Diagram Tile
- Updated on 10 Aug 2021
- 2 Minutes to read
- Print
- DarkLight
Article Summary
Share feedback
Thanks for sharing your feedback!
Overview
In a Page Designer, a Diagram Tile component can be used to create a quick infographic to be displayed on a Dashboard. While Diagram Tiles have a multitude of uses and customizations, this tutorial focuses on the Line Graph component. Line graphs are used to track changes over a period of time.
The following example will demonstrate how to configure a Line Chart, however, all Diagram Tiles using charts can be configured similarly.
Example
- To begin, navigate to a Designer Project and select CREATE FORM from the Global Action Bar.
- In the Create Form window, select Page. Name the Page and click CREATE.

- In the Page Designer, from the Toolbox > TILES section, drag a Diagram Tile component to the Page.

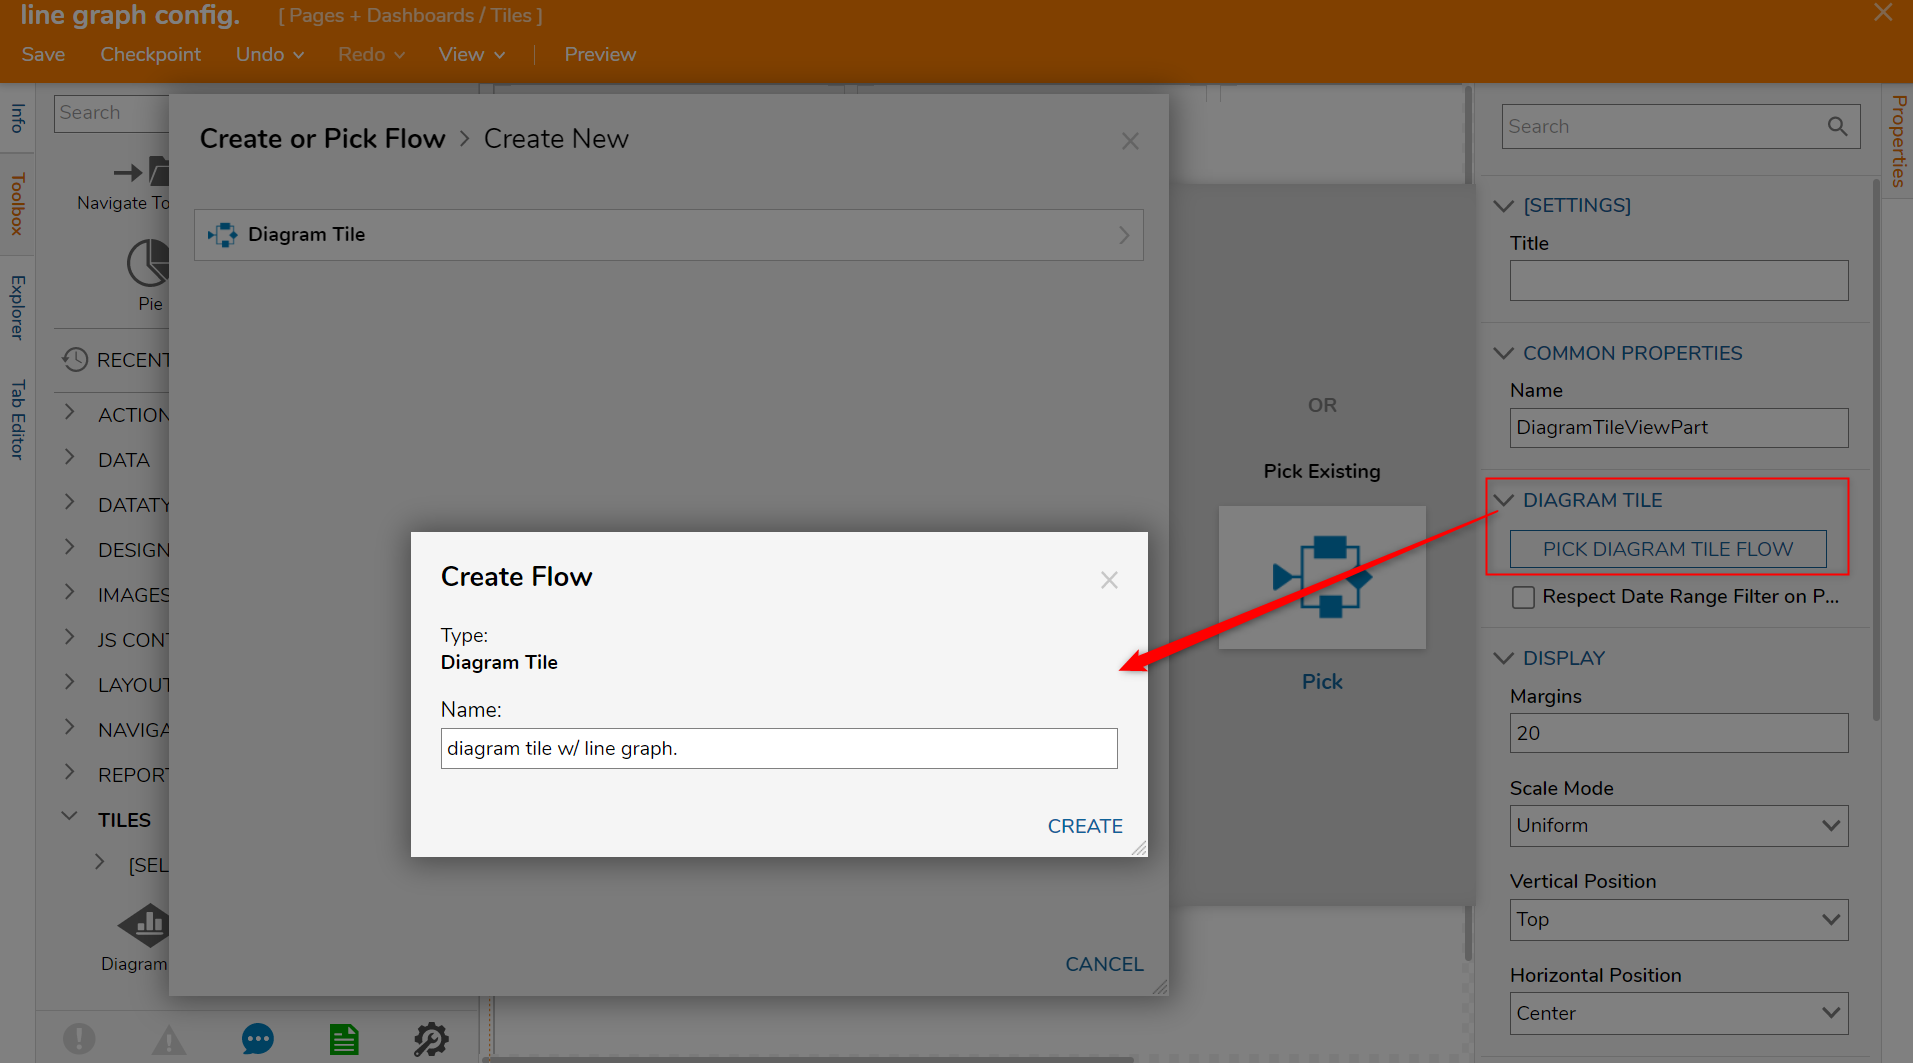
- From the Properties panel of the Diagram Tile component, under DIAGRAM TILE select PICK DIAGRAM TILE FLOW.
- In the Create or Pick Flow window, select CREATE. Then, click Diagram Tile and give the Flow a name.
- In the Flow Designer, locate the Toolbox > CHARTS section and drag a Lines component to the workspace.
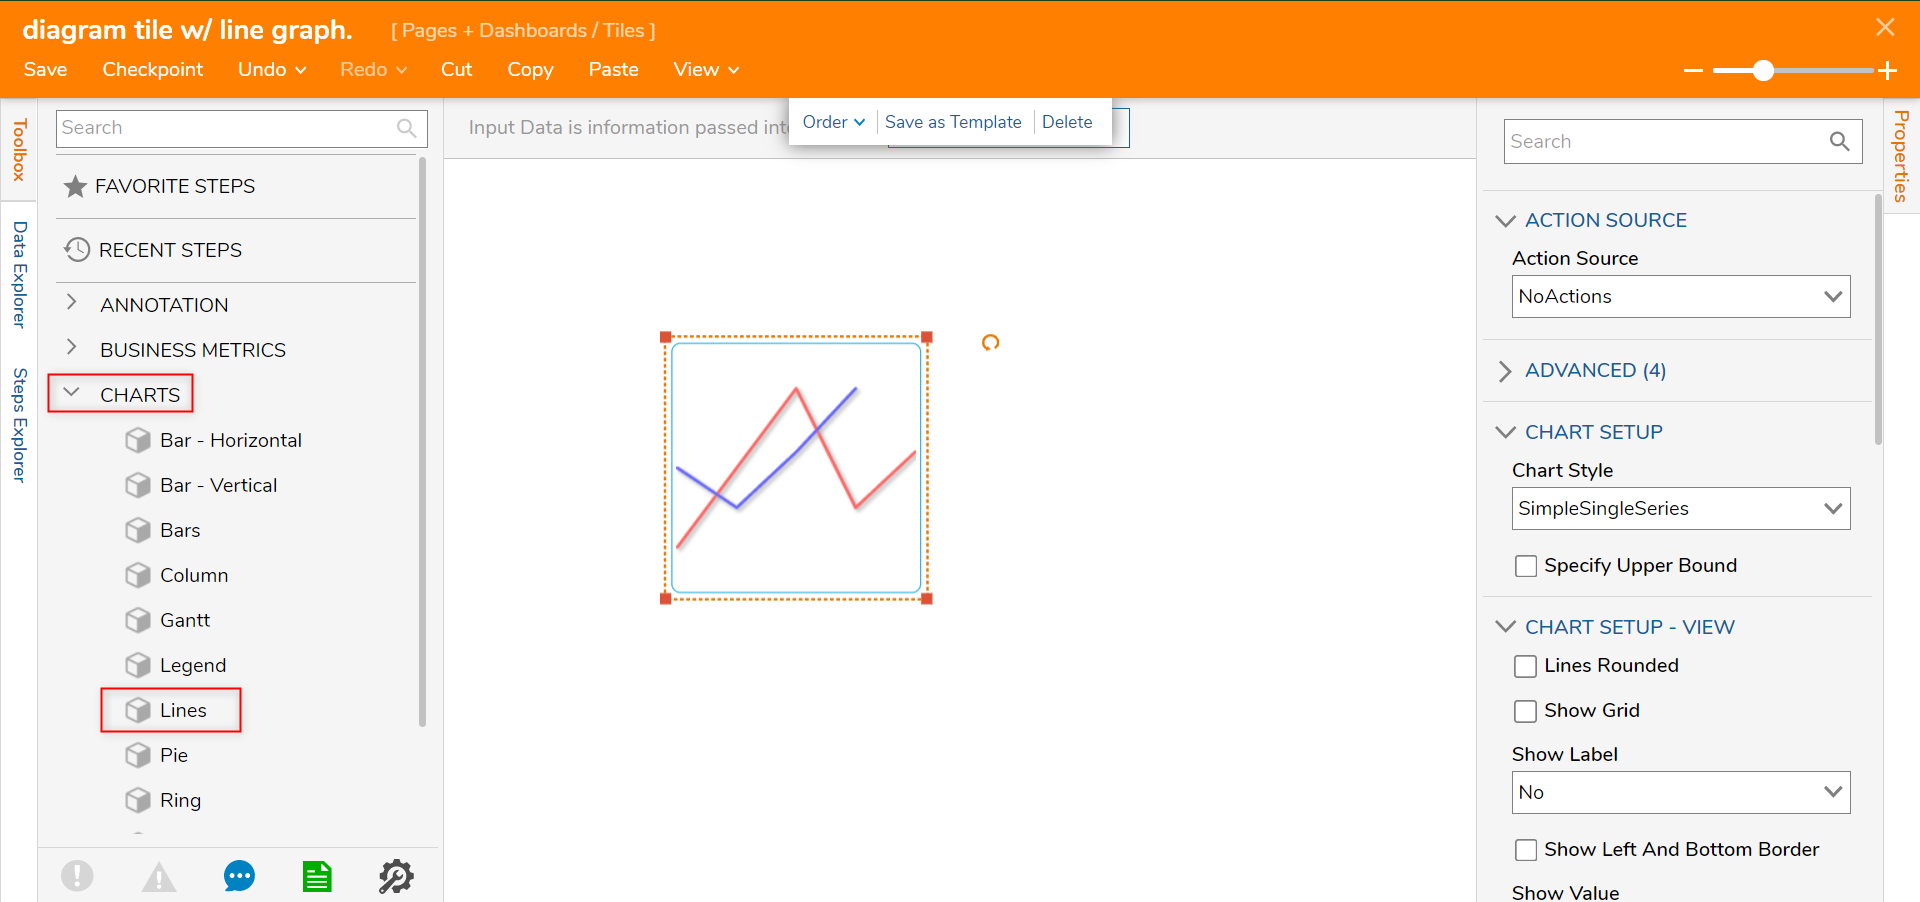
- Navigate to the Properties panel > CHART SETUP > Chart Style and select SimpleDoubleSeries.
SimpleSingleSeries This will allow the user to build a line graph Diagram Tile component with one line. SimpleDoubleSeries This will allow the user to build a line graph Diagram Tile component with two lines. MultipleSeries This will allow the user to build a line graph Diagram Tile component with more than two lines. This selection will also allow the Diagram Tile to take in a list of data. - Next, navigate to CHART SETUP - VIEW and select Yes for Show Label and Show Value.
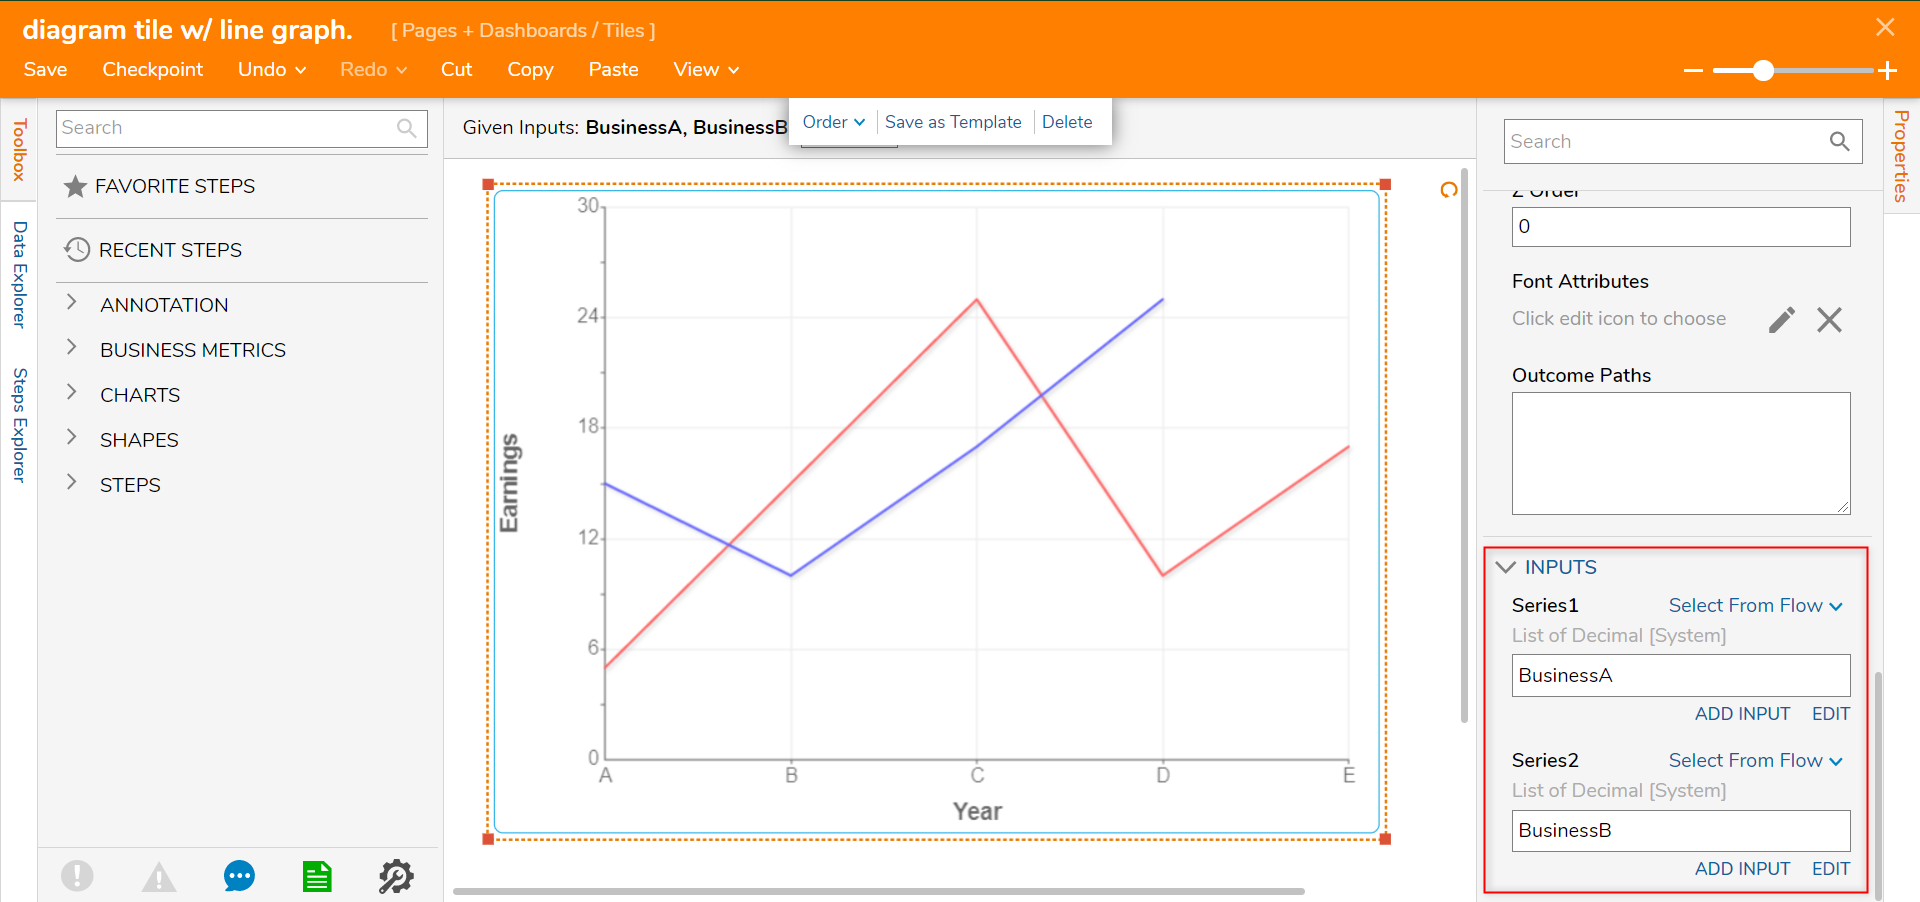
- Locate the X- and Y-Axis Label fields and add corresponding names to the data that will be represented.

- Then, locate the INPUTS > Series1 and Series2 and change the inputs for both to Select From Flow then click ADD INPUT for both.
- Add corresponding value names that reflect the line titles.
- Save and close the Flow Designer.
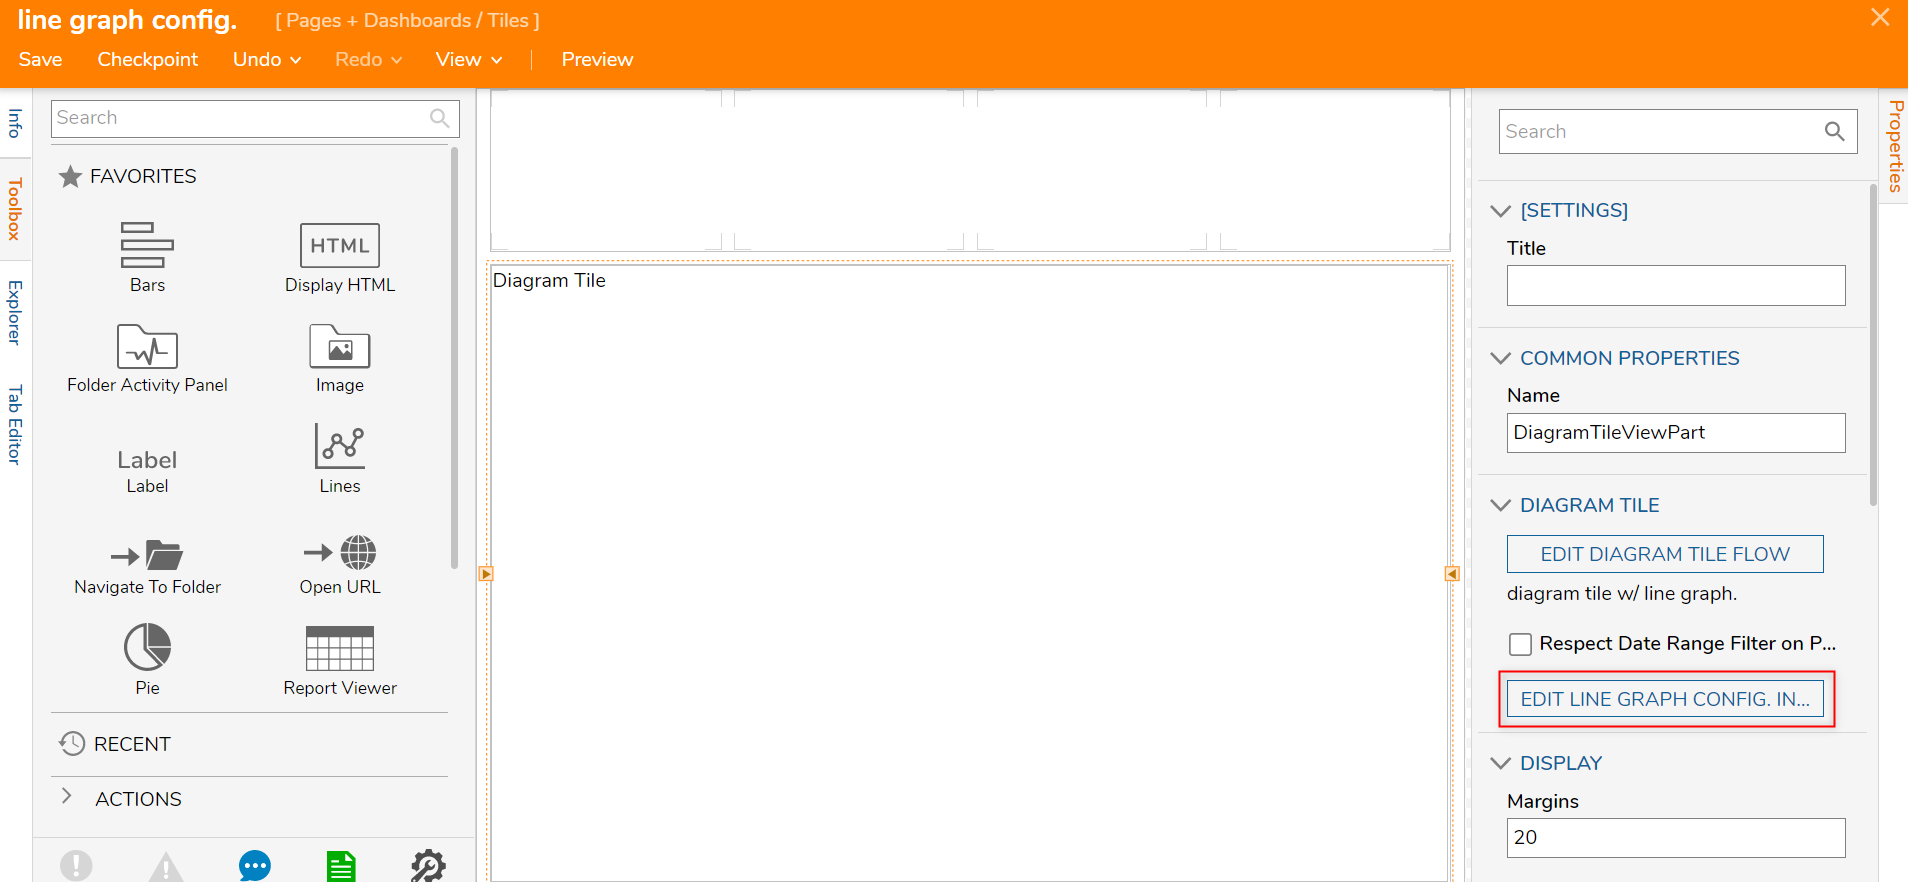
- In the Page Designer, locate the DIAGRAM TILE section in the Properties panel and click EDIT.
- In the Flow Designer, connect the Start step to the End step.
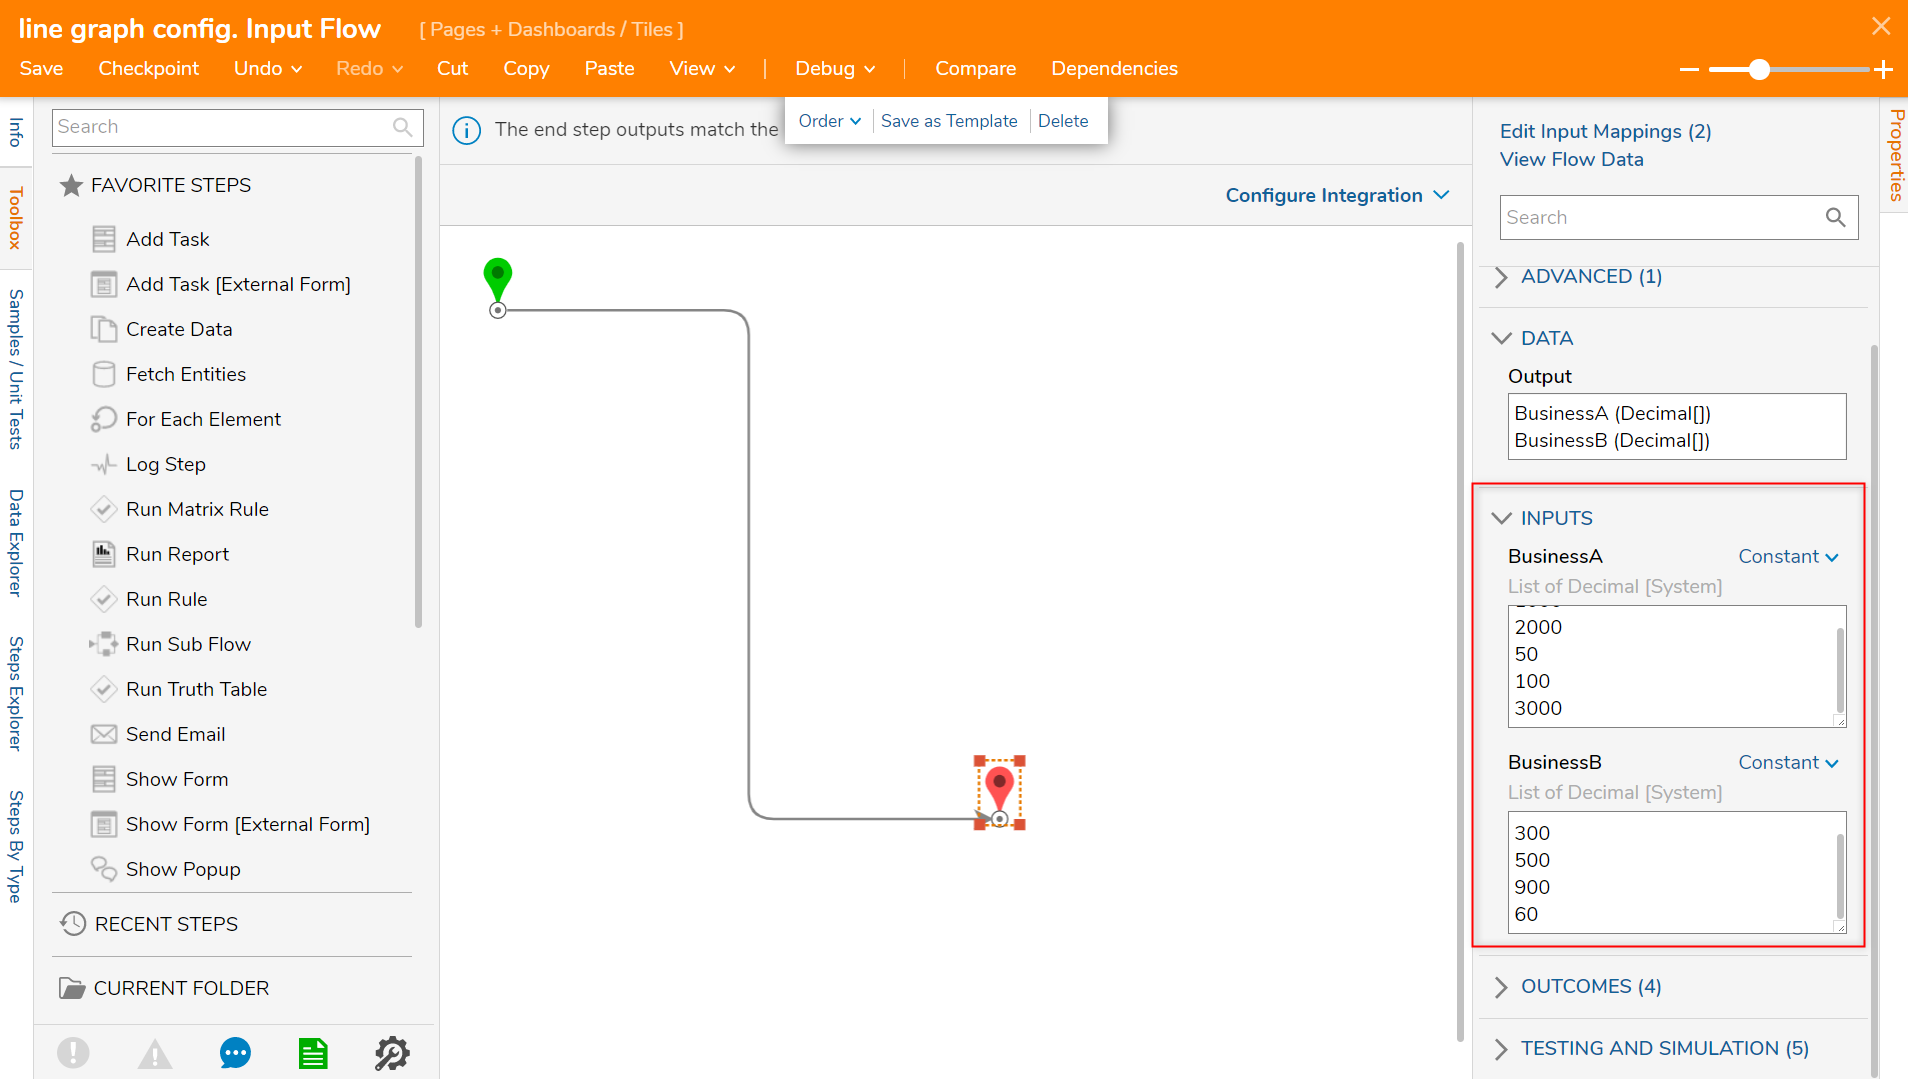
- With the End step selected, navigate to the Properties panel > INPUTS to change the input mapping of BusinessA and BusinessB to Constant.For example purposes, constant data has been mapped in; data can also be dynamically populated using the Select From Flow input mapping type.
- In each value field, input example data to populate the line graph.
- Save and close the Flow Designer.
- Save and Close the Page Designer.
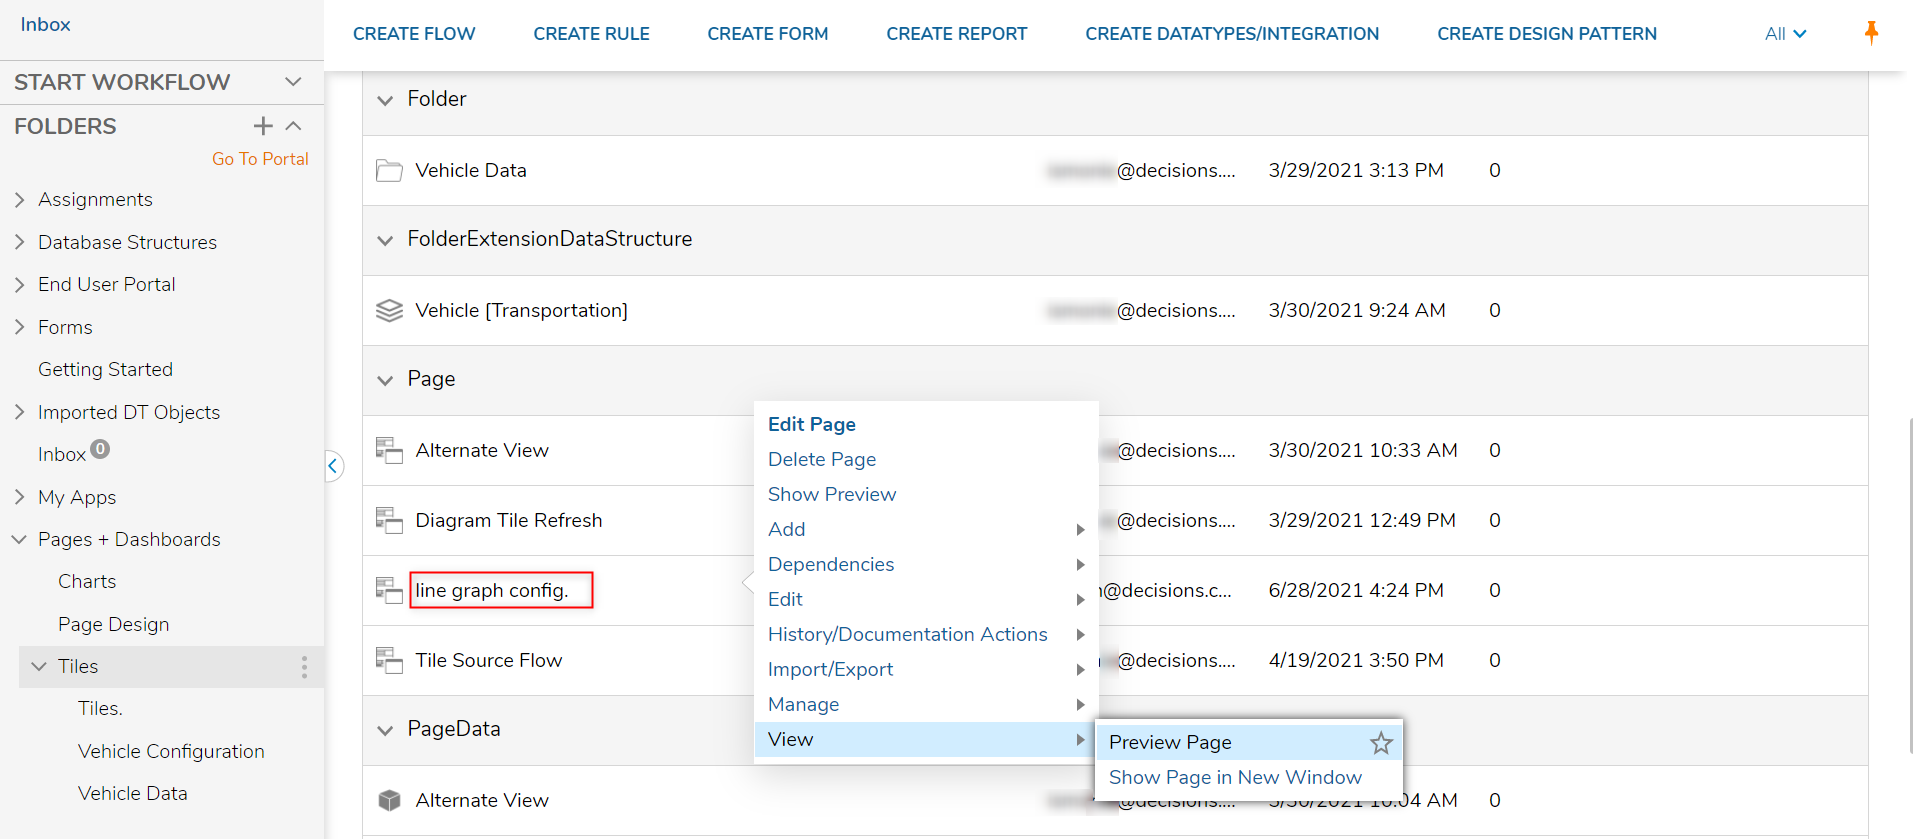
- In the Designer Project, right-click on the Page with the Diagram Tile and navigate to View > Preview Page.
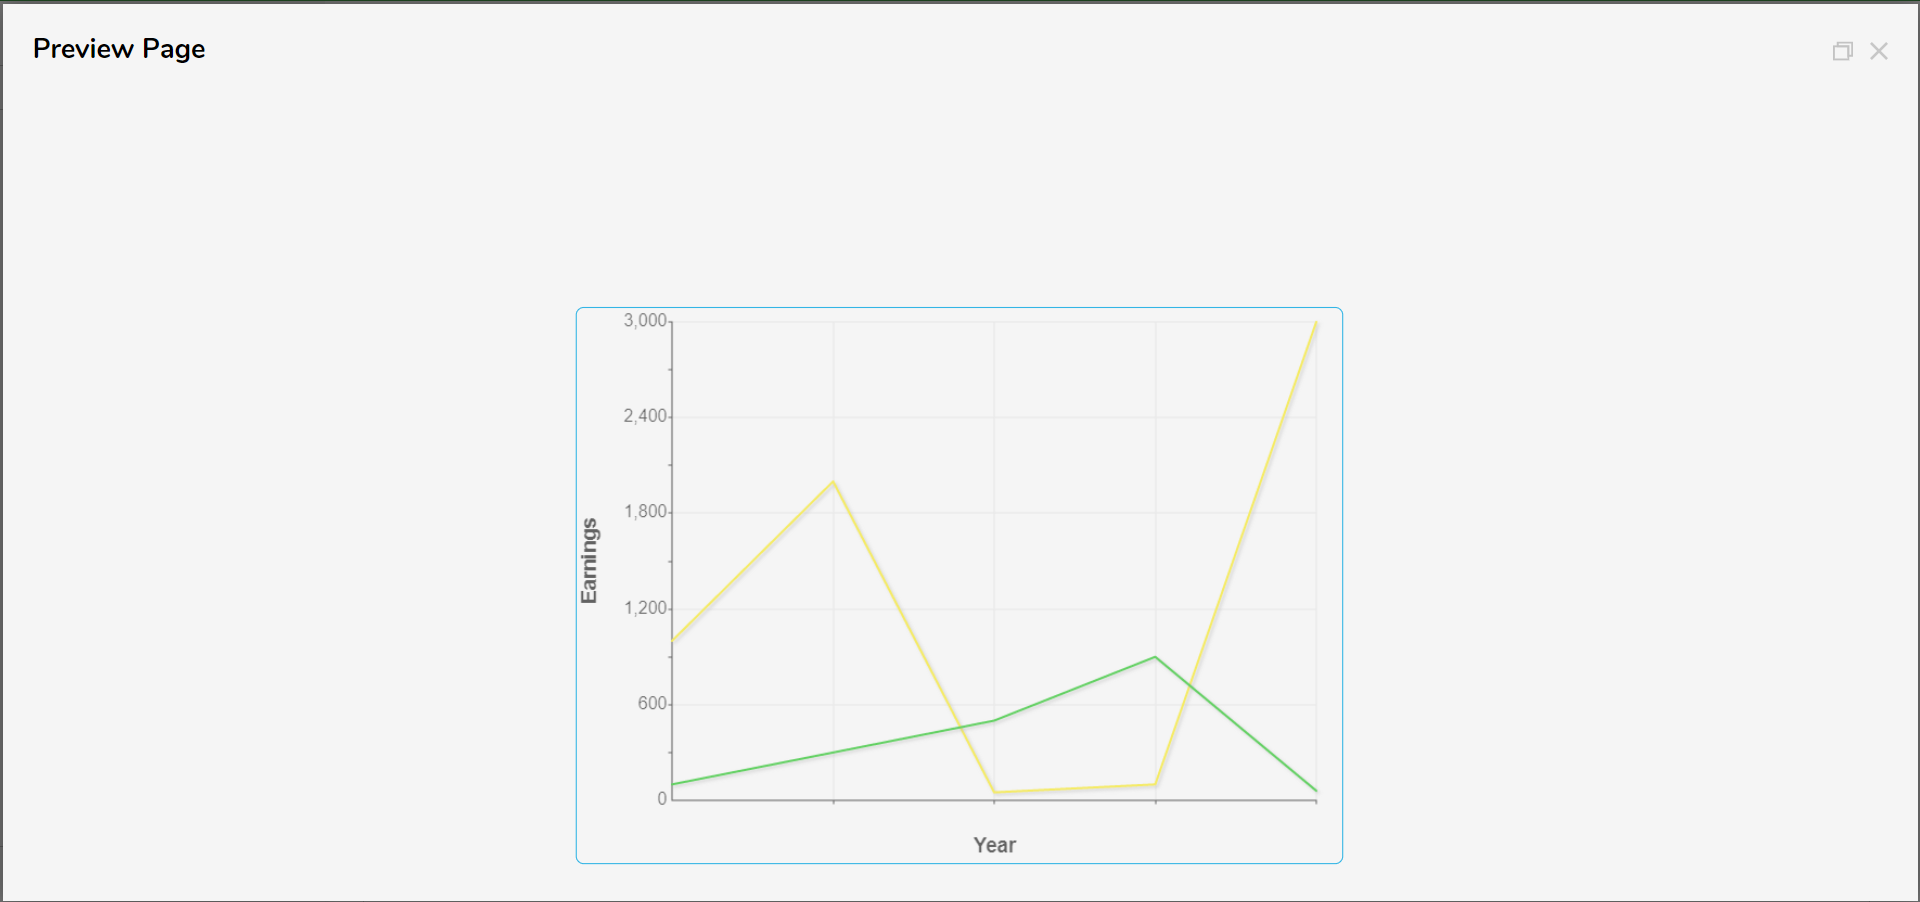
- In the Preview Page window, notice the appearance of the two lines based on the input values.


Was this article helpful?