Diagram Tile Refresh on Selection Bus
- 29 Mar 2021
- 4 Minutes to read
- Print
- DarkLight
Diagram Tile Refresh on Selection Bus
- Updated on 29 Mar 2021
- 4 Minutes to read
- Print
- DarkLight
Article Summary
Share feedback
Thanks for sharing your feedback!
Overview
Diagram Tiles are a way to capture data and present it in an attractive manner using infographics. Charts, Shapes, Steps, Labels, and more options are available to customize Diagram Tiles to display data in a relevant manner. Configuring Diagram Tiles to refresh on Selection Bus allows the Diagram Tile to change when selecting different items in a report.
For more information on Diagram Tiles, please navigate to Diagram Tiles.
Example
This tutorial will create a Page that houses a Report and Diagram Tile. The Diagram Tile will show the Decisions objects owned by the Account selected on the Report.
- To begin, navigate to a Designer Folder and select CREATE REPORT from the Global Action Bar.
- In the Create Report window, select and name the default Report [Account Report]. Click CREATE.

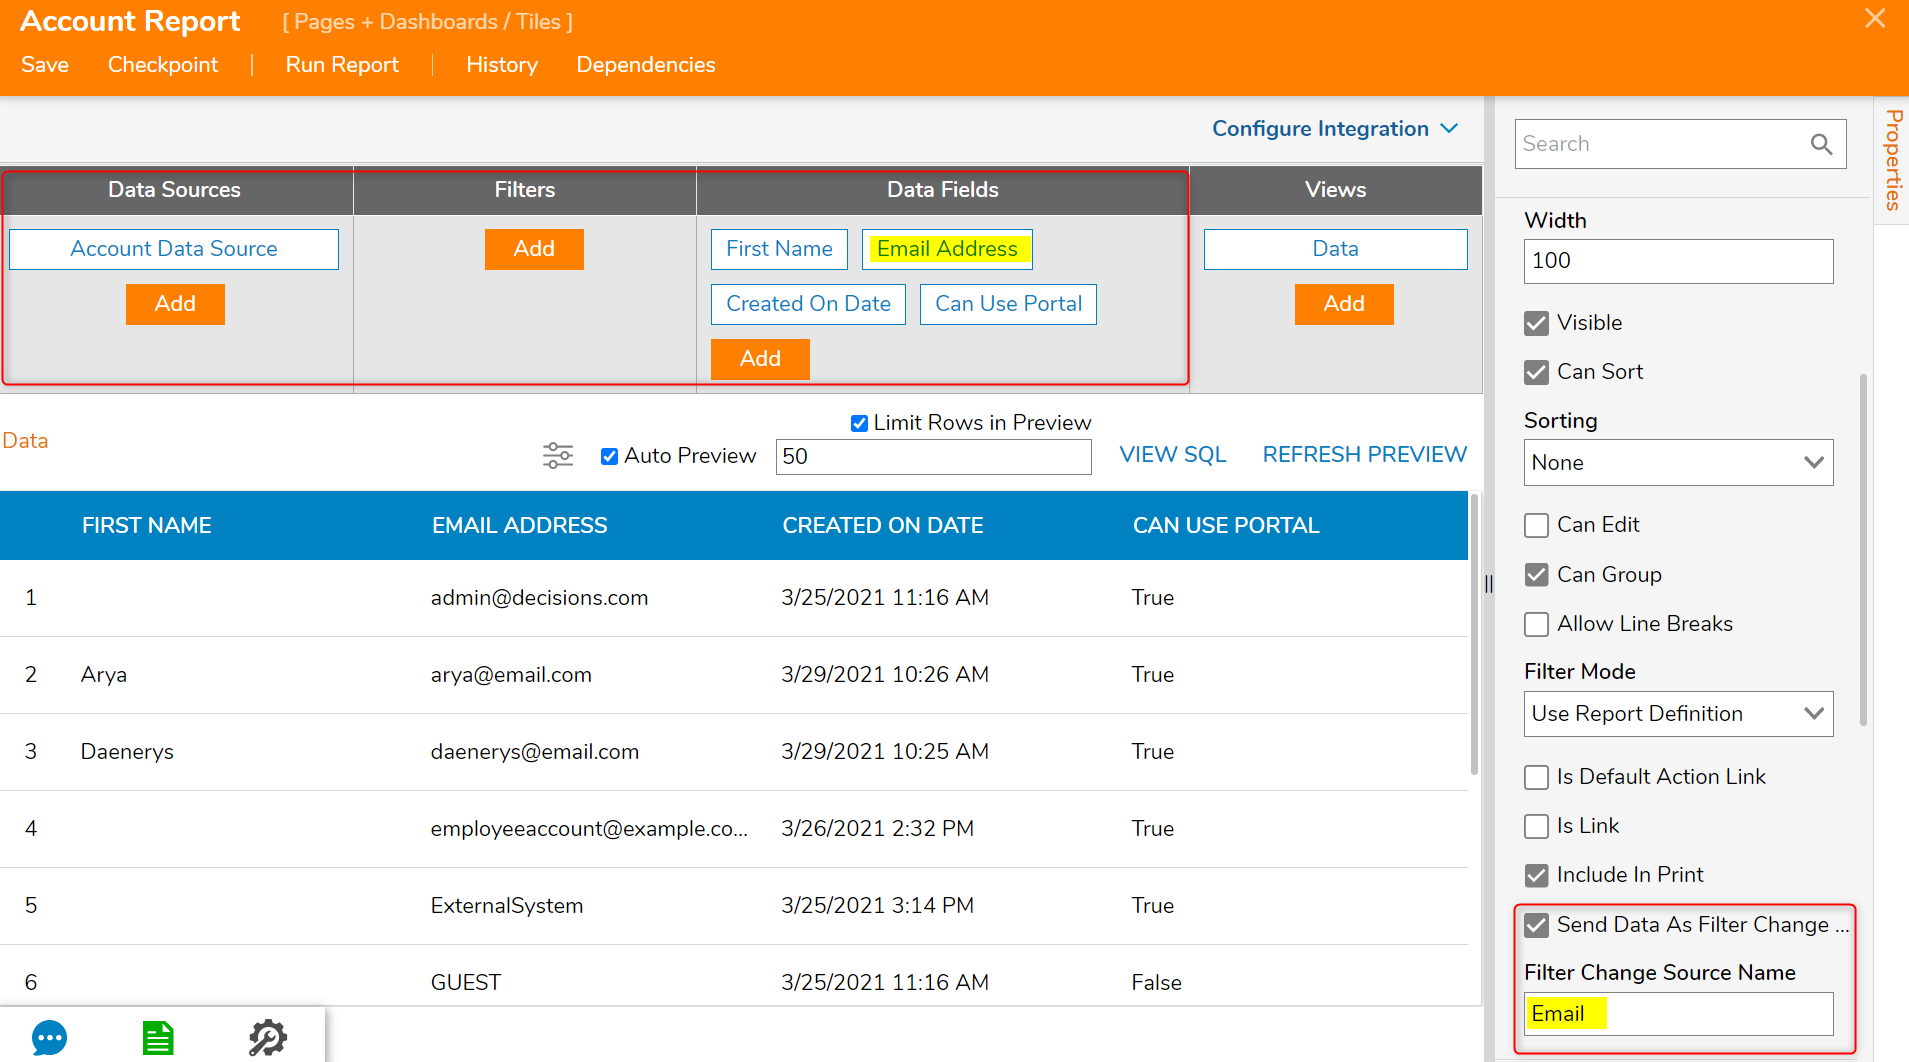
- In the Report Designer, under Data Sources add Common > Account Data Source.
- In the Data Fields column add First Name, Email Address, Created On Date, and Can Use Portal.
- Select the Email Address Data Field. In the Properties panel > SETTINGS, navigate to the Send Data As Filter Change Source boolean to and change it to True.
- Notice the new text box labeled Filter Change Source Name, input "Email" in the text box.
- Notice the new text box labeled Filter Change Source Name, input "Email" in the text box.
- Save and Close the Report Designer.
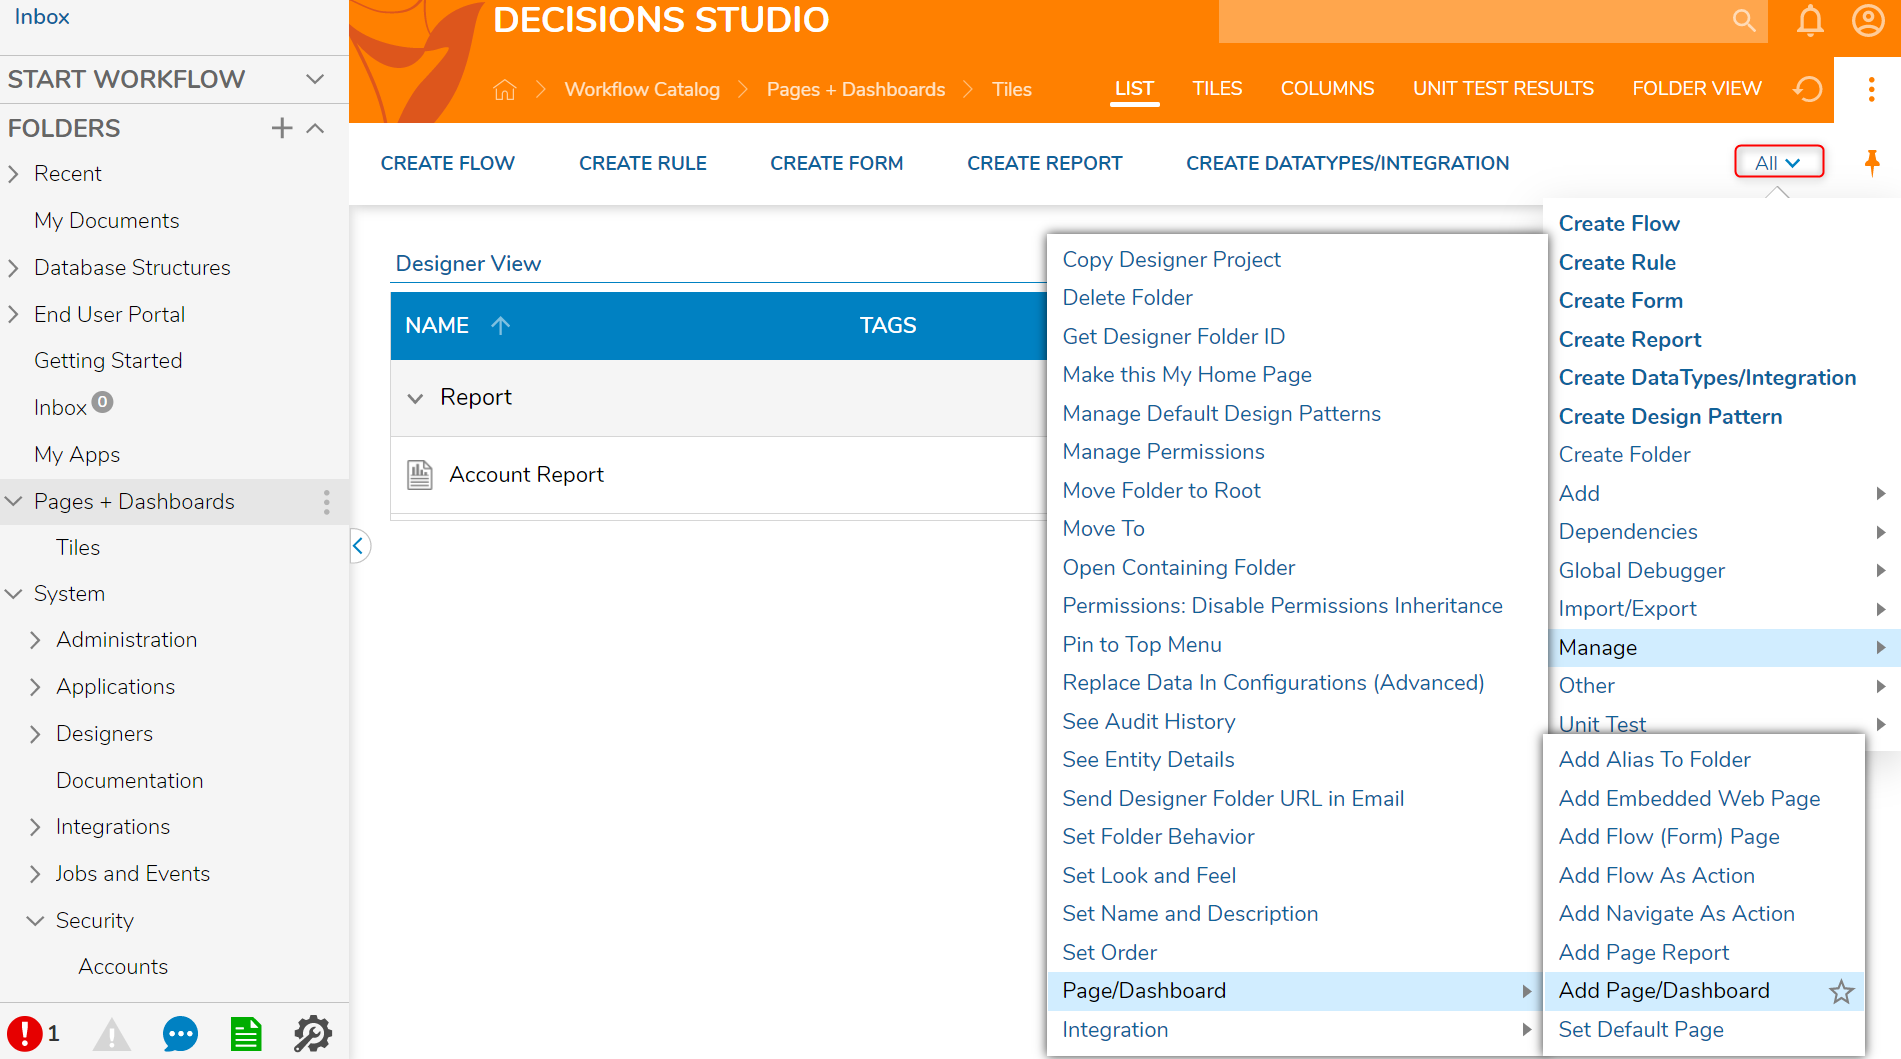
- In the Designer Folder, navigate to All > Manage > Page/Dashboard > Add Page/Dashboard from the Global Action Bar.
- In the resulting Add Page/Dashboard window, click PICK PAGE.
- In the Create or Pick Page window, select CREATE to create a new Page.
- In the next Create or Pick Page > Create New window, select and name the default Page [Diagram Tile Refresh]. Click CREATE to enter the Page Designer.

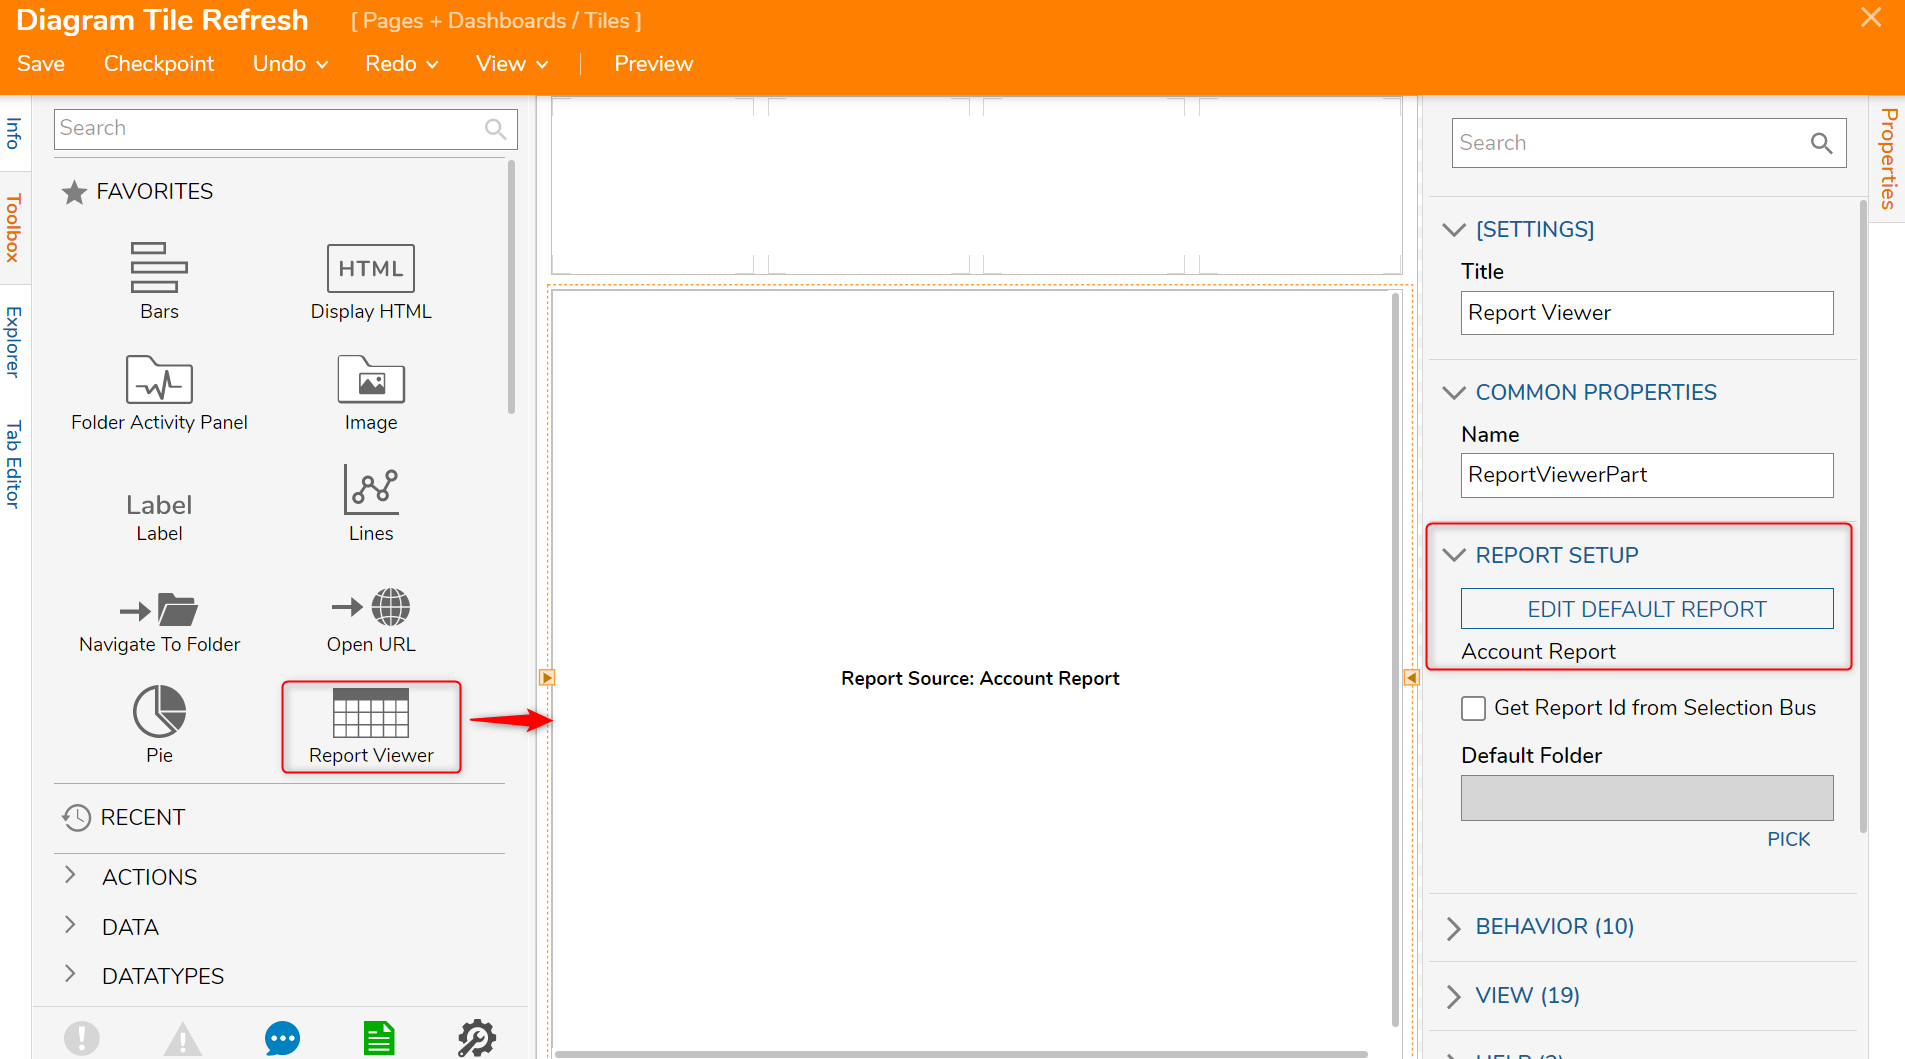
- In the Page Designer, navigate to the Toolbox > FAVORITES section and drag and drop a Report Viewer component to the workspace.
- In the Properties panel of the Report Viewer component, navigate to REPORT SETUP and select PICK DEFAULT REPORT.
- In the resulting Create or Pick Report window, select PICK to pick an existing Report. Navigate to the Report [Accounts Report] made in this tutorial.
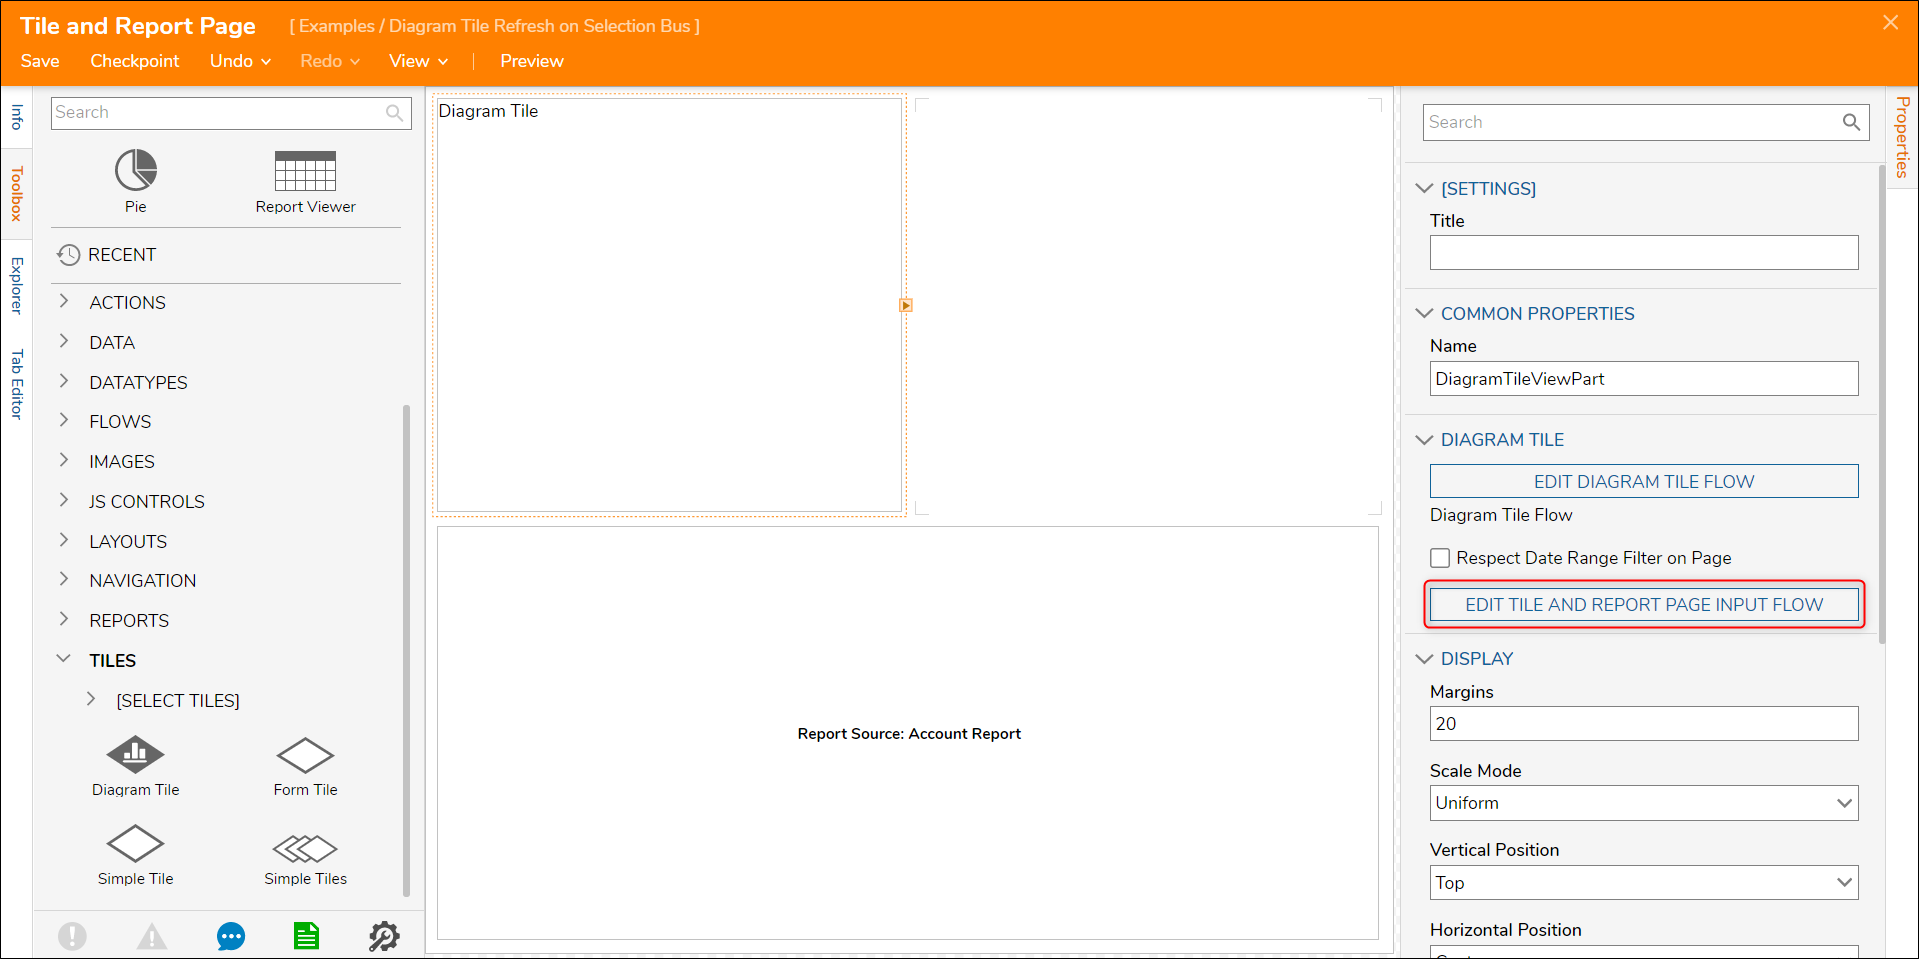
- Next, navigate to the Toolbox > TILES section and drag and drop a Diagram Tile component to the workspace.
- In the Properties panel > DIAGRAM TILE, select PICK DIAGRAM TILE FLOW.

- In the resulting Create or Pick Flow window, select CREATE.
- Then, in the Create or Pick Flow > Create New window, select and name the Diagram Tile Flow [Selection Bus Refresh]. Click CREATE to open the Flow Designer.

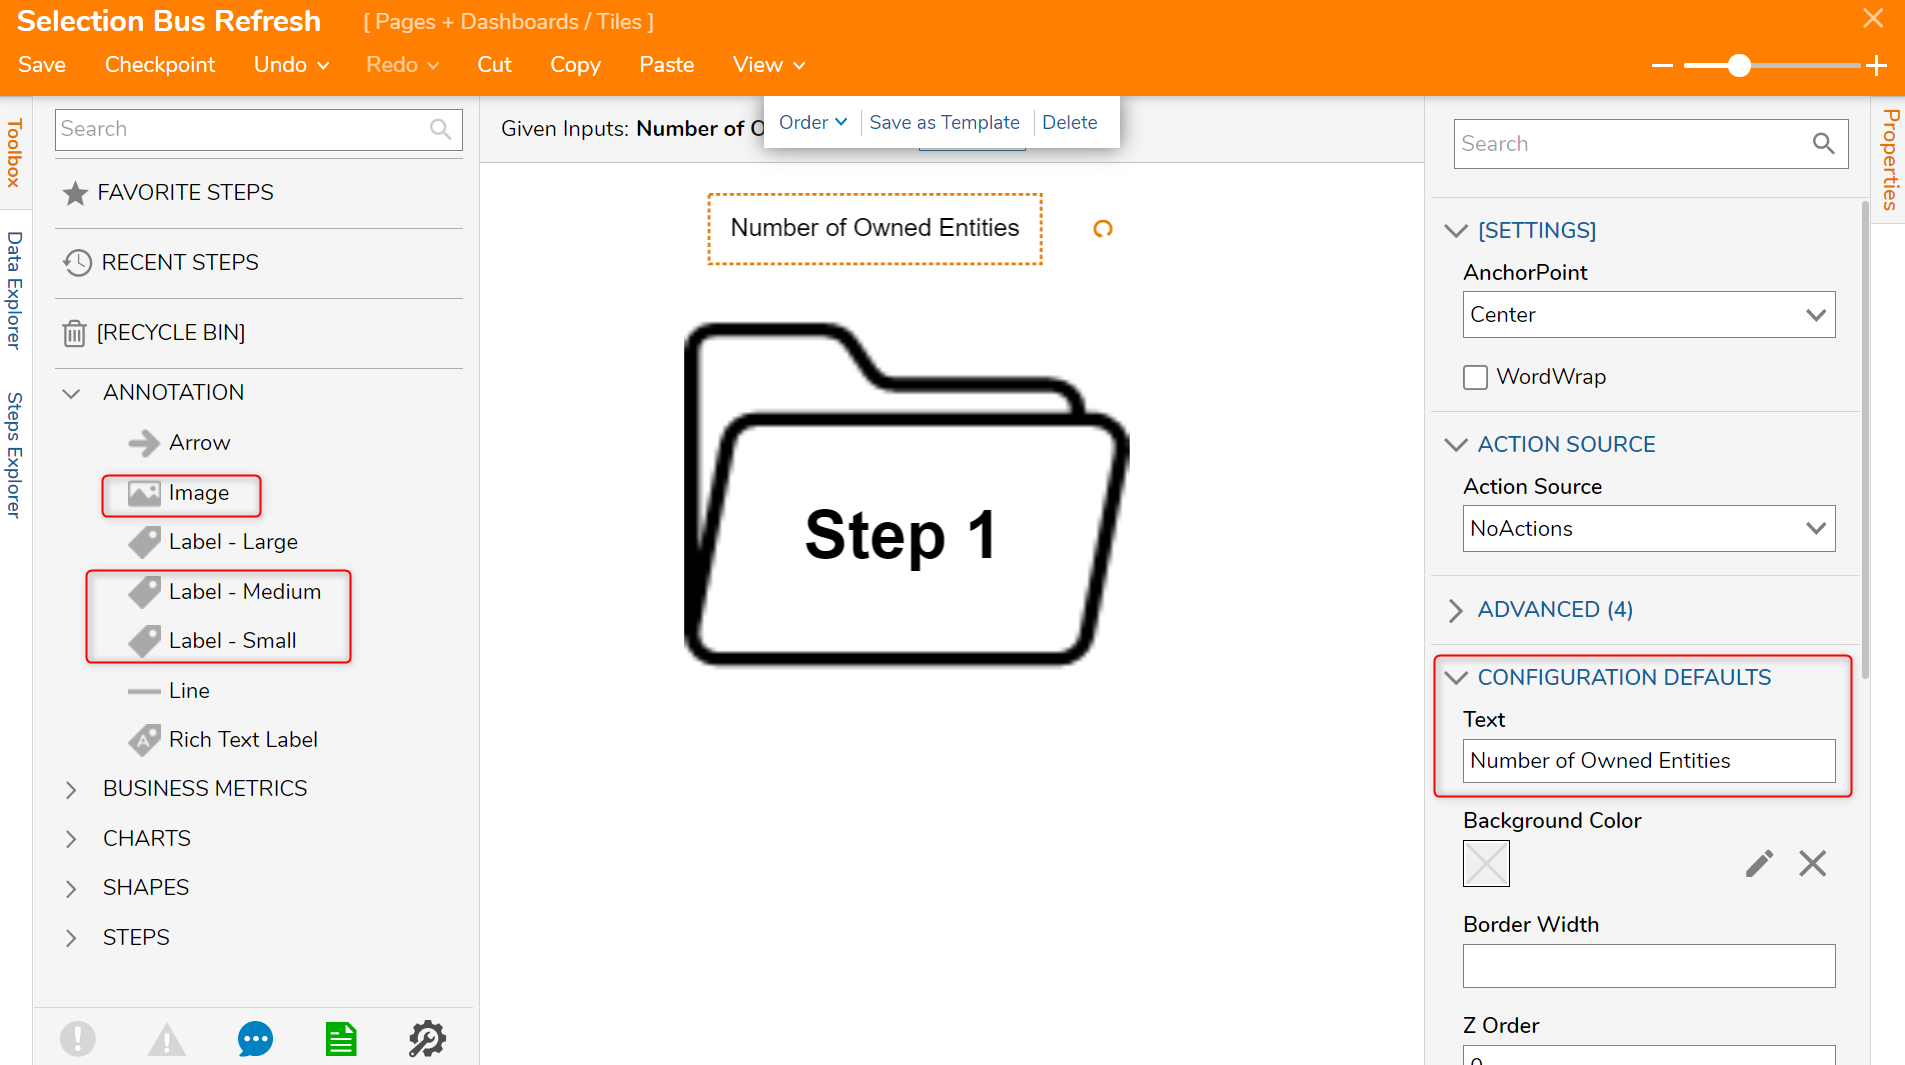
- In the Flow Designer, navigate to the Toolbox > ANNOTATION section and drag an Image, Label - Small, and Label - Medium component to the workspace.
- Arrange the components so that the Label - Small is above the Image component and the Label - Medium component is within the Image.
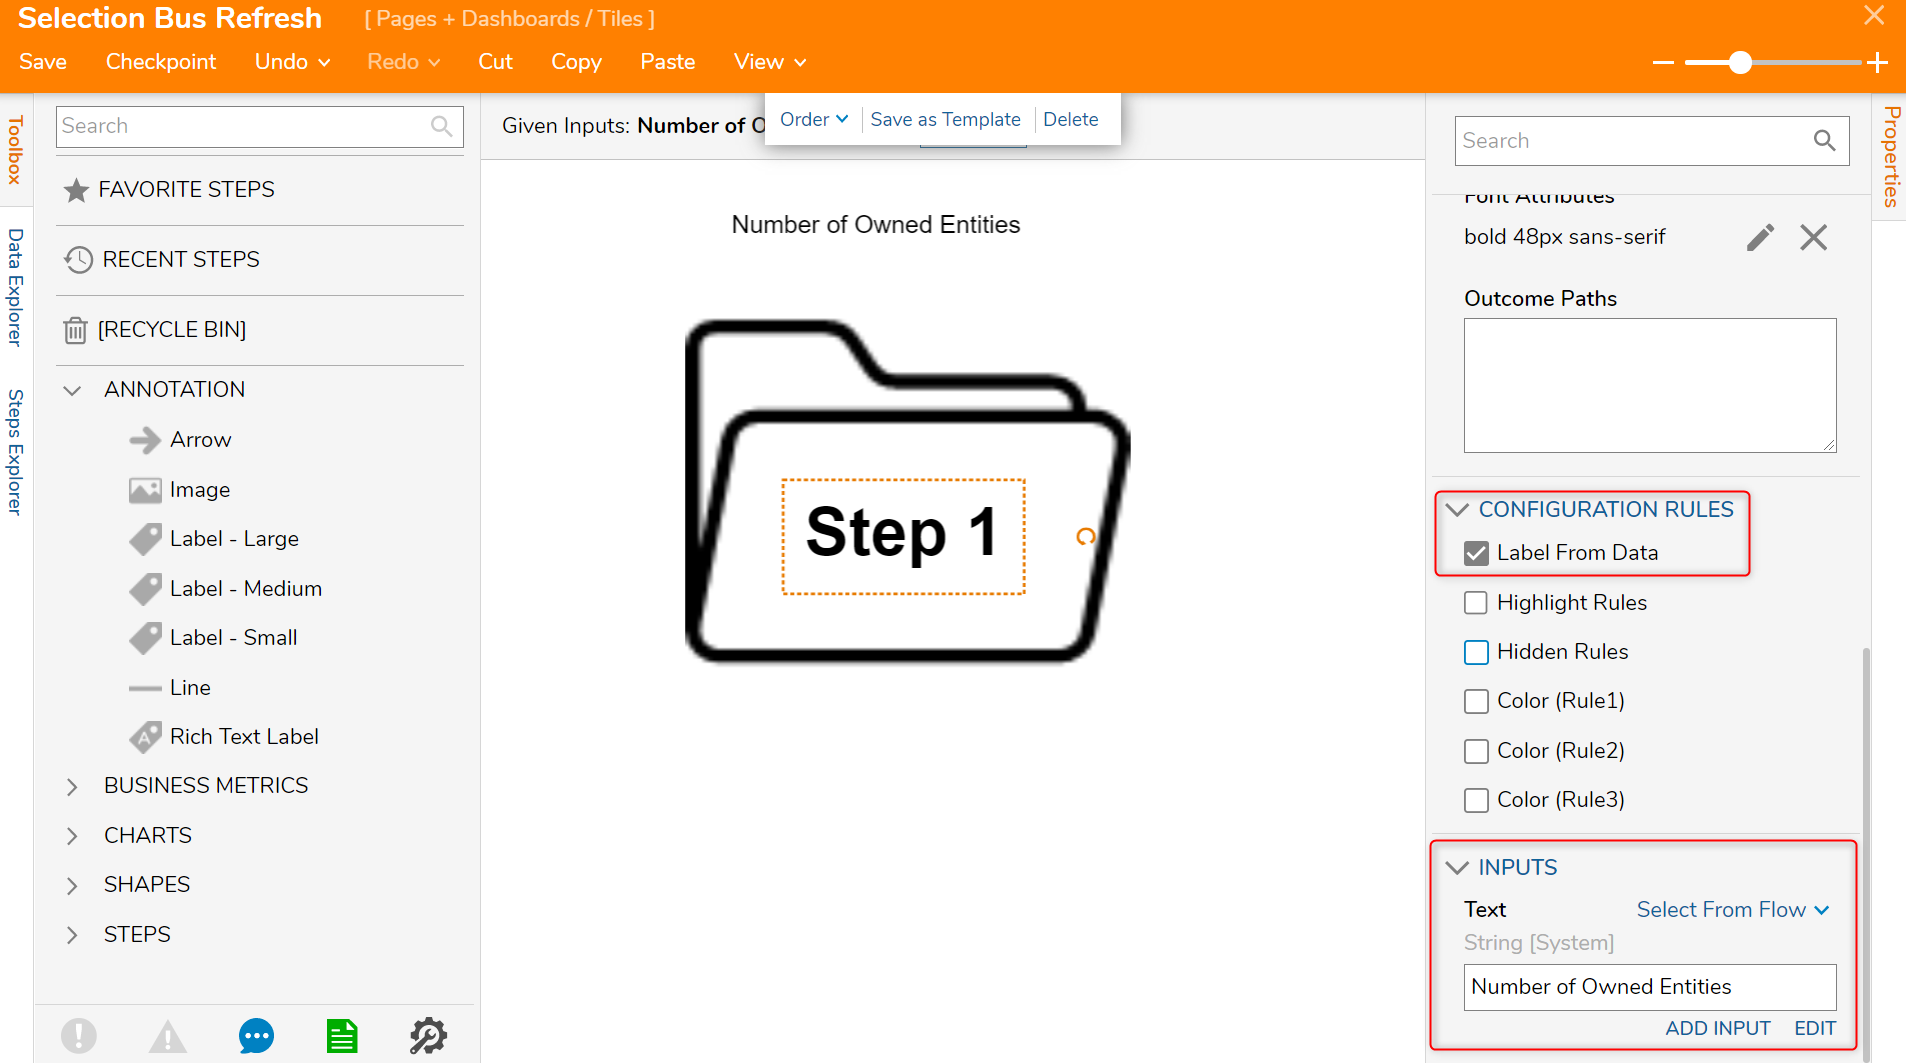
- In the Properties panel of the Label - Small component, navigate to CONFIGURATION DEFAULTS > Text and input "Number of Owned Entities" in the value field.
- In the Properties panel of the Label - Medium component, navigate to CONFIGURATION RULES and check the Label From Data boolean. This will cause the PROPERTIES > INPUTS section to appear.
- In the INPUTS > Text value field, change the input mapping to Select From Flow and click ADD INPUT. Input "Number of Owned Entities" and click ADD.
- Save and Close the Flow Designer.
- In the Page Designer, with the Diagram Tile component selected, navigate to the Properties panel > DIAGRAM TILE section and click EDIT INPUT FLOW NAME.
- In the Flow Designer, navigate to the Toolbox > DASHBOARDS section and drag and drop a Get Page Variable step to the workspace.
- With the Get Page Variable step selected, navigate to the Properties panel > PAGE CONTEXT > Data Type, select PageVariablefrom the drop down list.
- In the PAGE CONTEXT > Variable Name value field, input Email.
- From the PAGE CONTEXT > Expected Type drop down list, select String [Text].

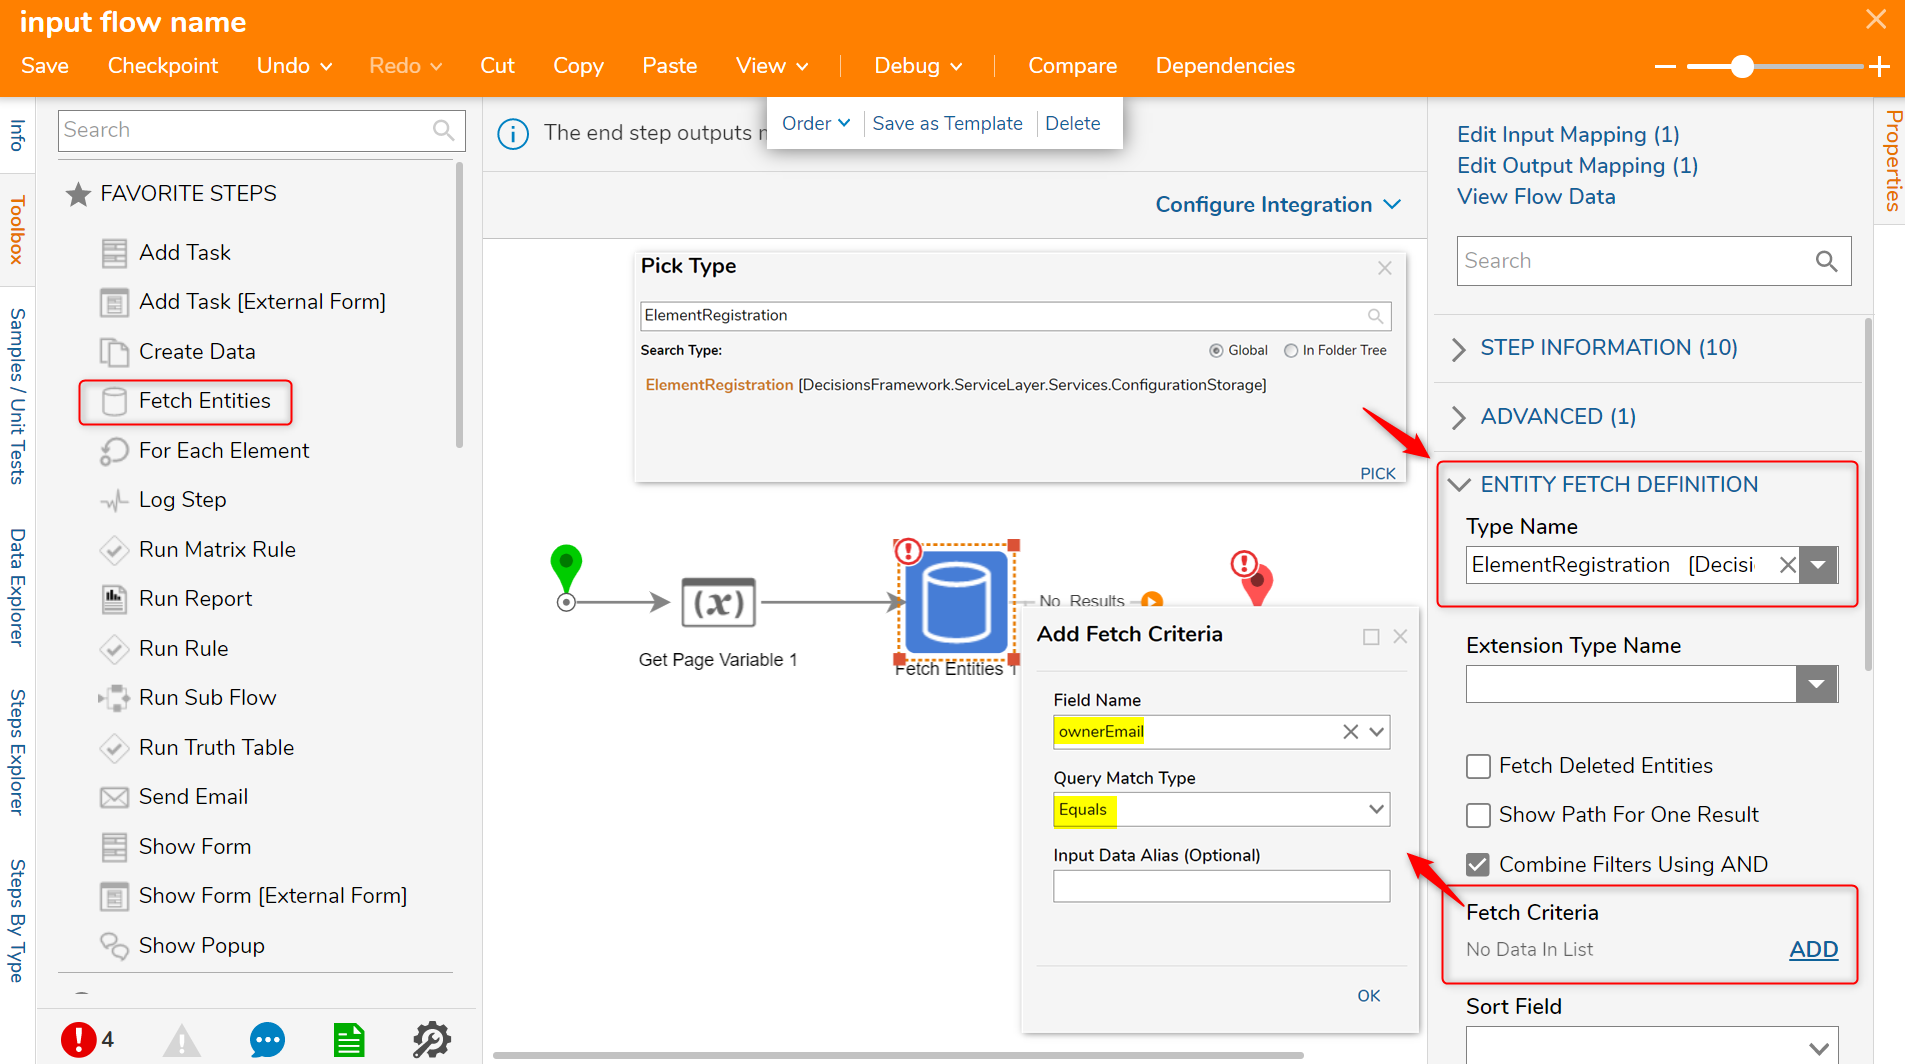
- From the Toolbox > FAVORITE STEPS section, drag a Fetch Entities step to the workspace and connect it to the Done outcome of the Get Page Variable step.
- In the Properties panel of the Fetch Entities step, navigate to ENTITY FETCH DEFINITION > Type Name and search for and select Element Registration from the drop down list.
- Next, navigate to ENTITY FETCH DEFINITION > Fetch Criteria and click ADD.
- In the Add Fetch Criteria window, select ownerEmail from the Field Name drop down list and leave the Query Match Type as Equals. Click OK to close.
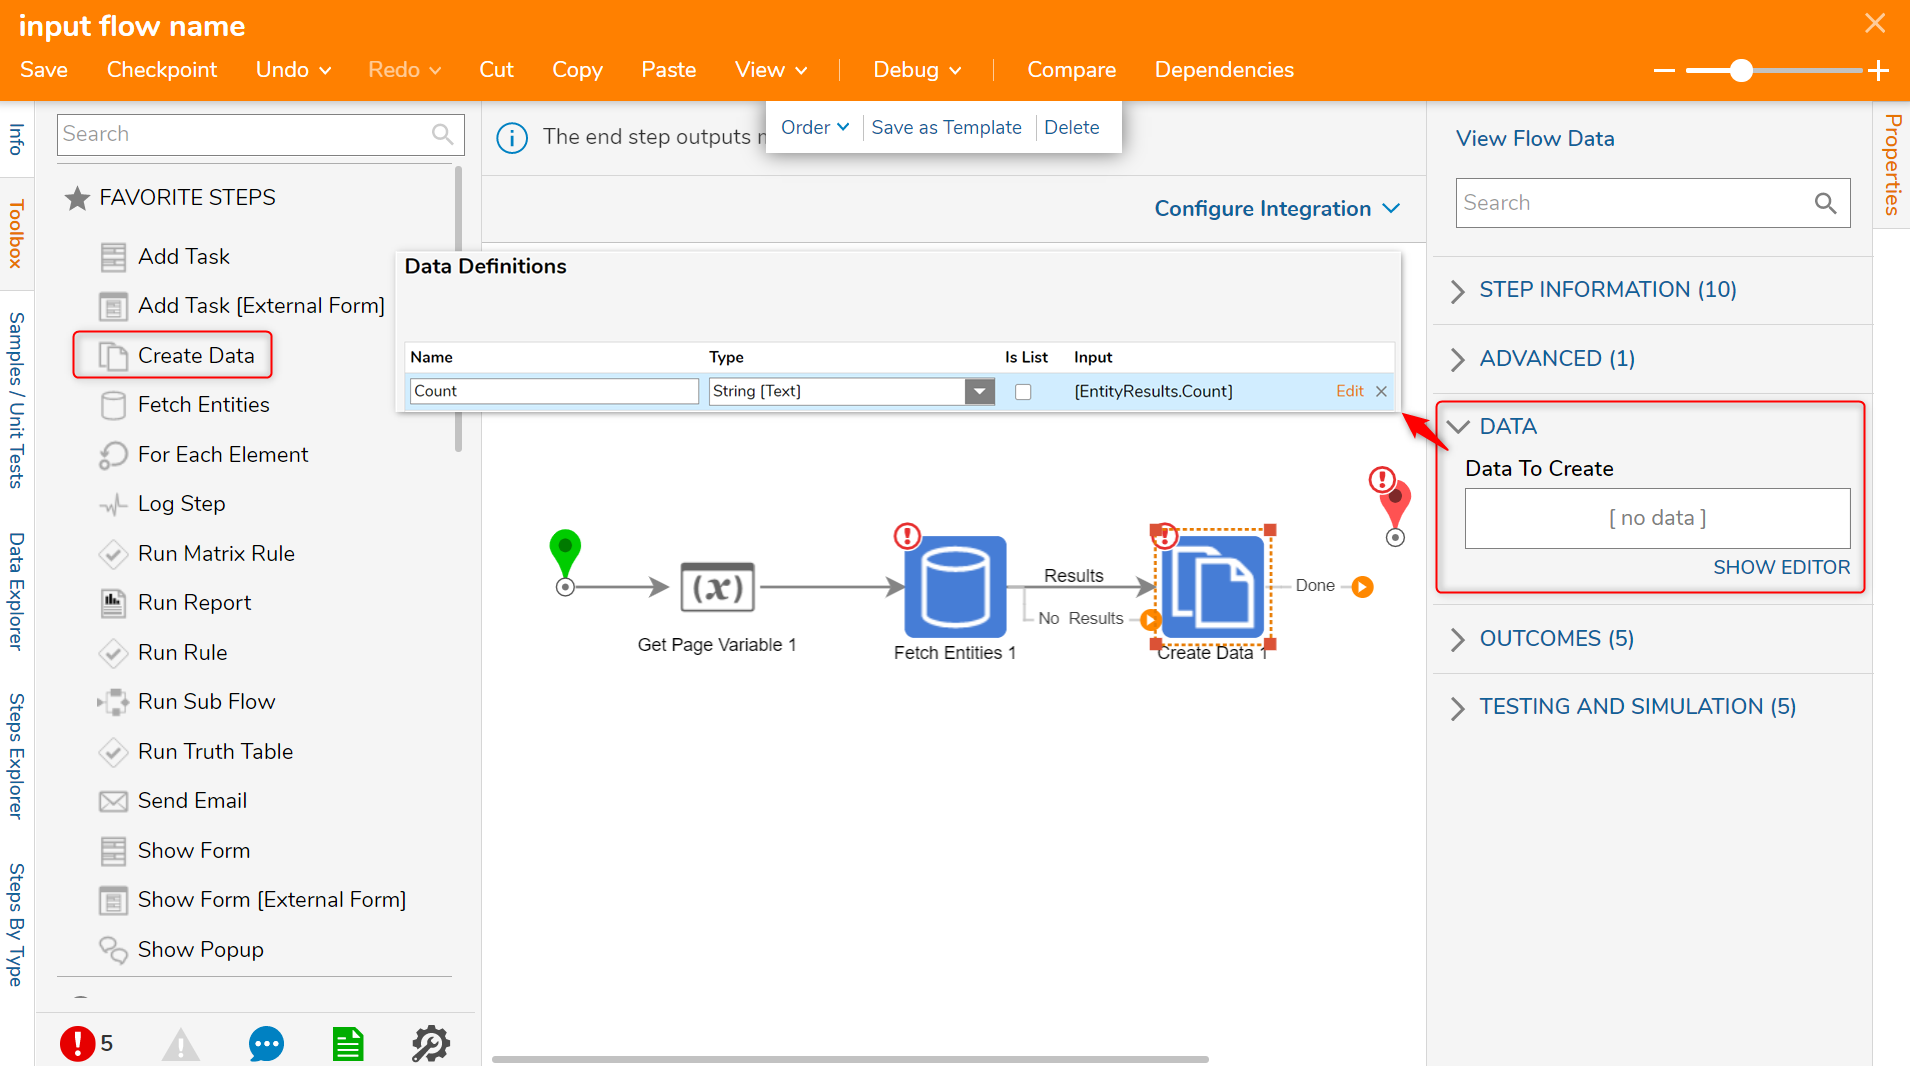
- From the Toolbox > FAVORITE STEPS section, drag and connect a Create Data step to the Results outcome of the Fetch Entities step.
- With the Create Data step selected, navigate to the Properties panel > DATA > Data to Create selector and click SHOW EDITOR.
- In the Data Definitions window, Name the Data to Create "Count" with a String [Text] Type.
- For the Input, select EntityResults, then drill down to Count. CLOSE the window.
- From the Toolbox > FAVORITE STEPS section, add another Create Data step to the workspace and connect it to the No Results outcome of the Fetch Entities step.
- With the second Create Data step selected, navigate to the Properties panel > DATA > Data to Create selector and click SHOW EDITOR.
- In the Data Definitions window, input Count as the Name and the Type is String [Text], with an Input of 0. CLOSE the window.

- Connect both Create Data steps to the End step.
- With the End step selected, navigate to the Properties panel > INPUTS > Number of Owned Entities value field and change the input mapping to Select From Flow and select Count.
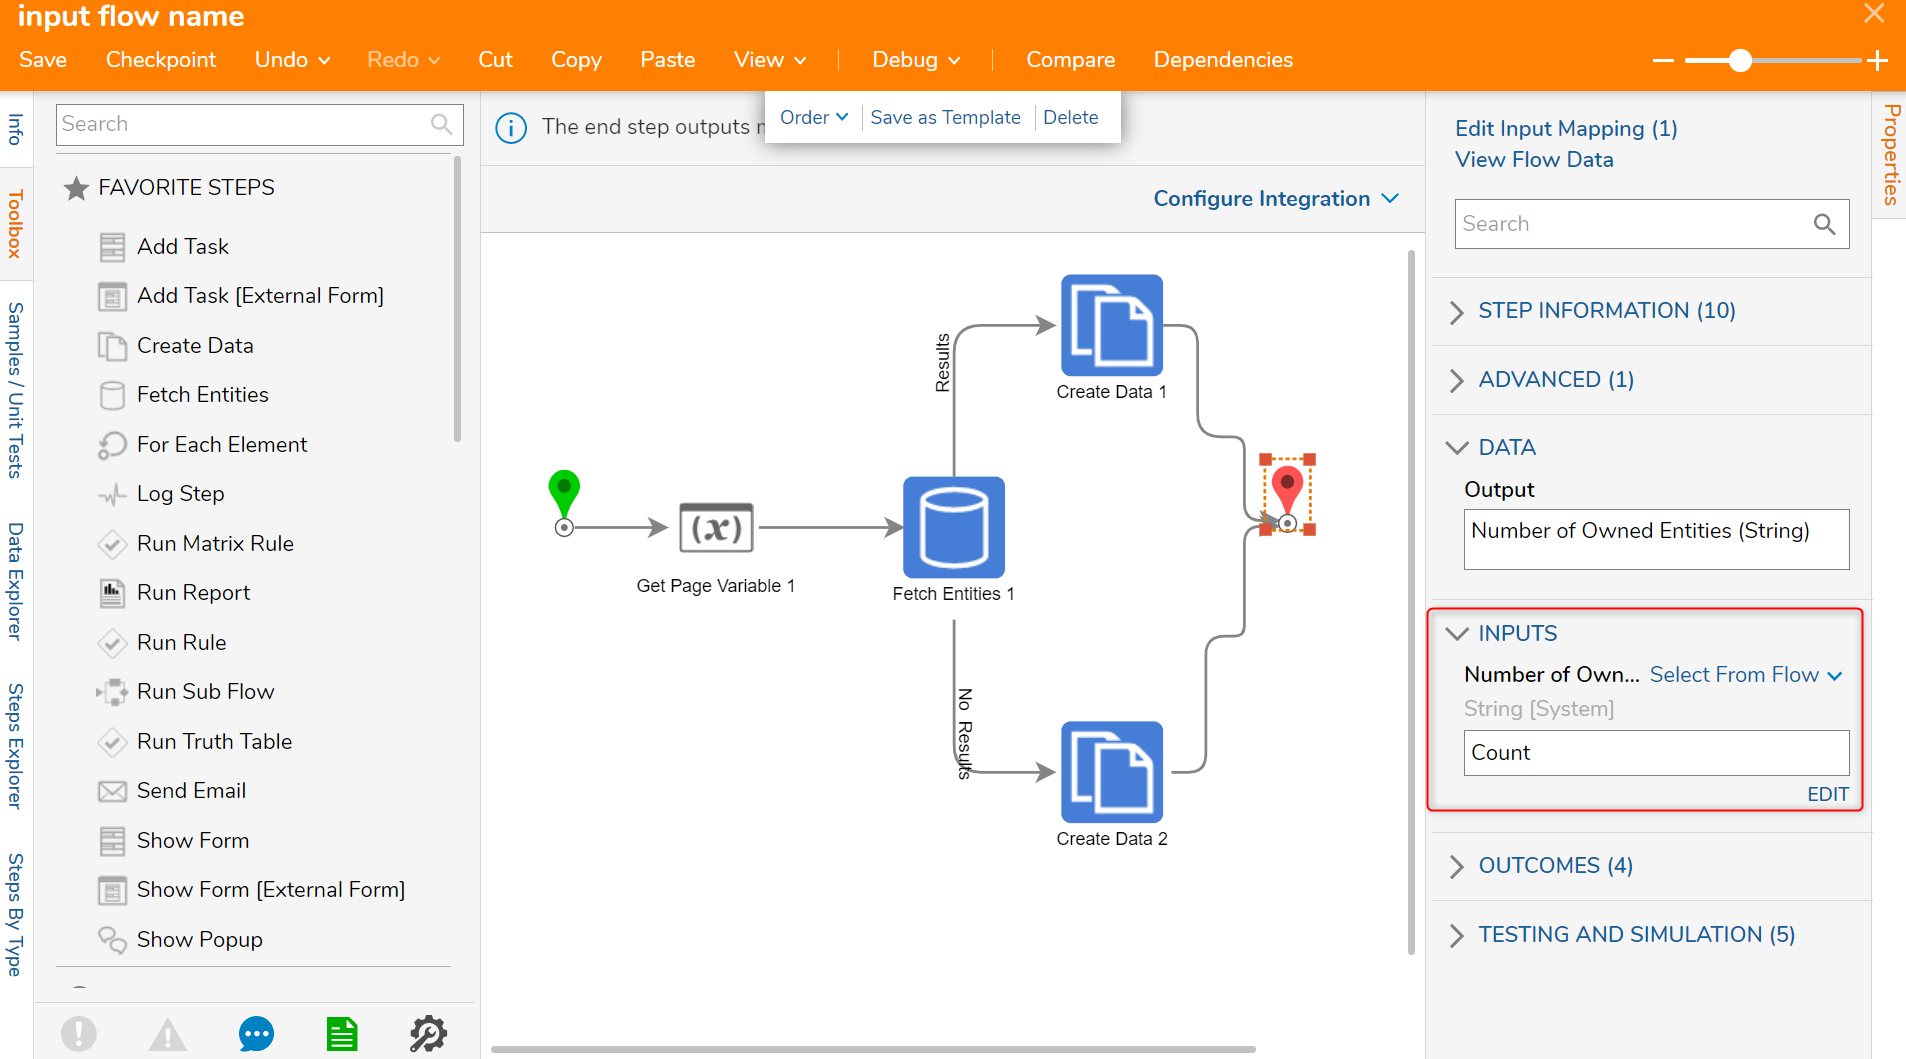
- Save and Close the Flow and Page Designers.
- In the Add Page/Dashboard window, click SAVE.
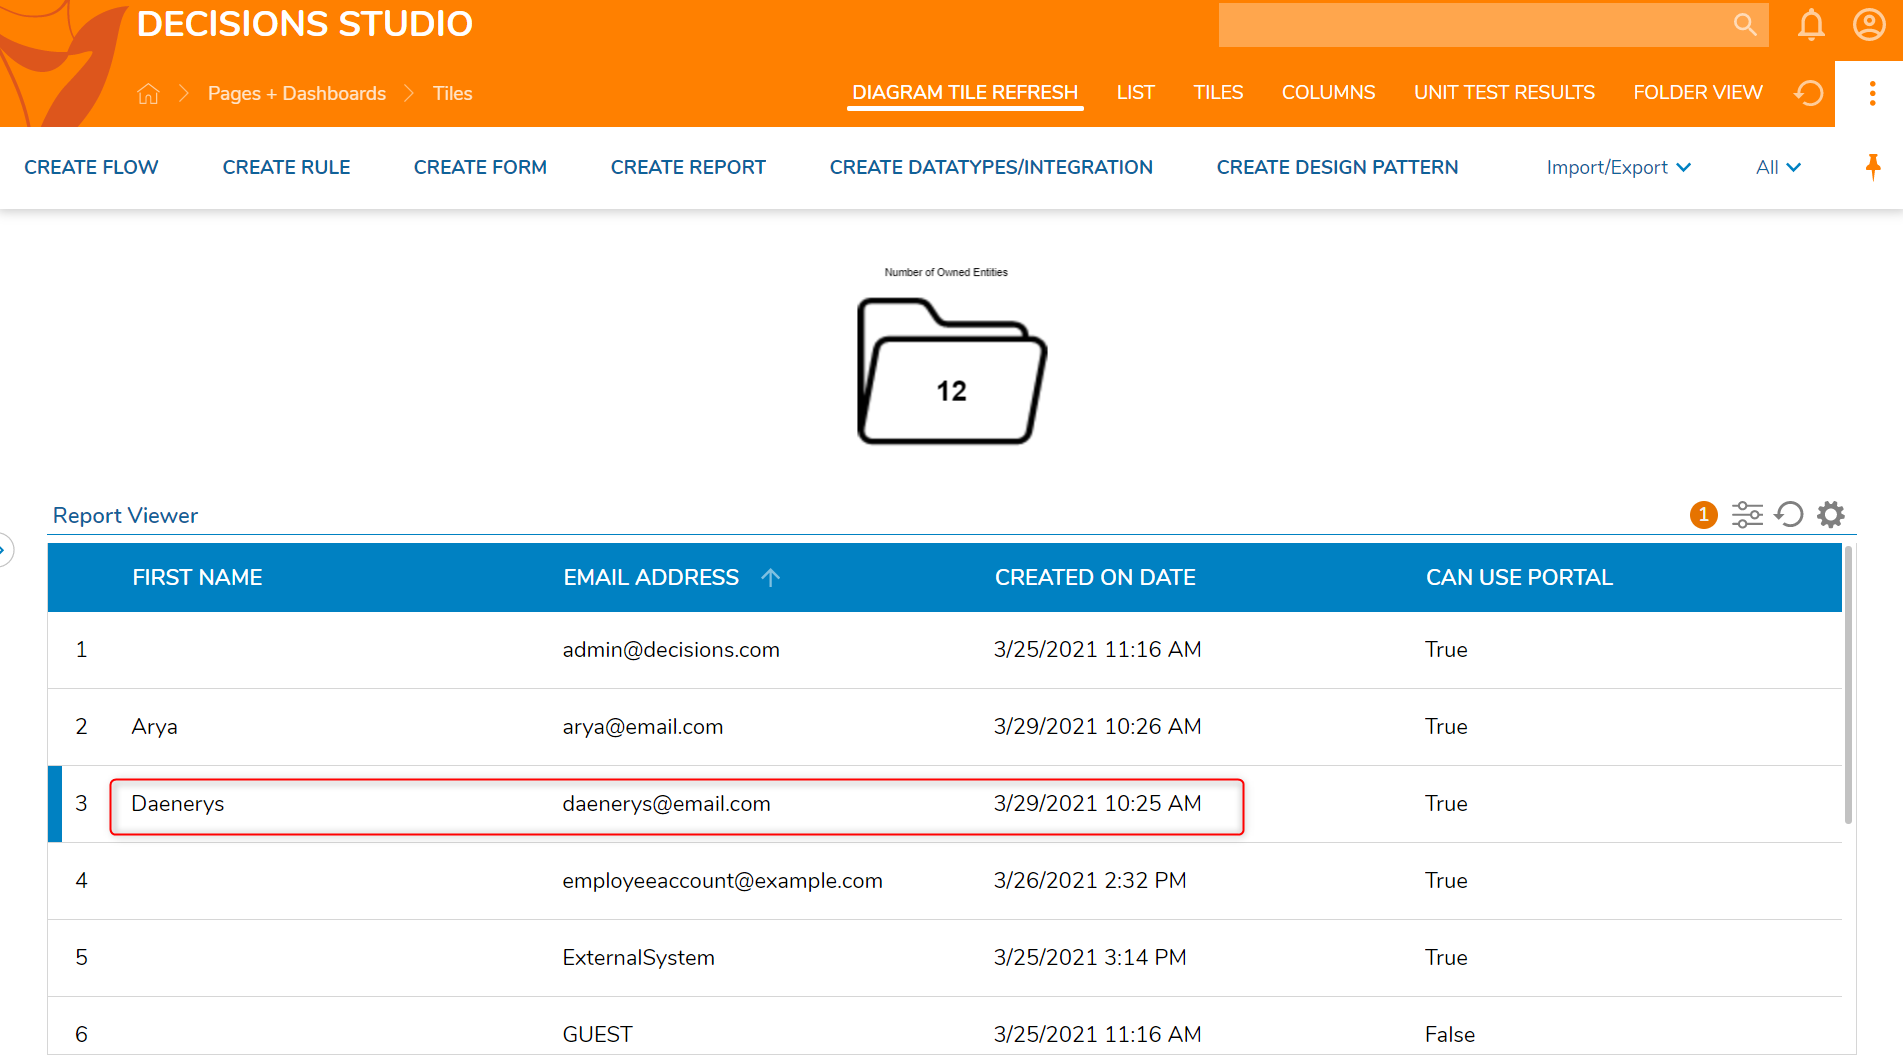
- In the Designer Folder, notice the appearance of the new Page [Diagram Tile Refresh] above the Global Action Bar.
- After selecting the Page [Diagram Tile Refresh], notice the number within the Diagram Tile changes when different accounts are selected within the Report.


Was this article helpful?