Selecting a Data Drill View for the Report Viewer
- 23 Feb 2021
- 2 Minutes to read
- Print
- DarkLight
Selecting a Data Drill View for the Report Viewer
- Updated on 23 Feb 2021
- 2 Minutes to read
- Print
- DarkLight
Article Summary
Share feedback
Thanks for sharing your feedback!
Overview
Report data in a Report Viewer can be summarized in a variety of formats; this customization allows users to select the Data Drill View to utilize when the Portal Page is viewed.
Example
The goal of this example is to display the Data Drill View customization by creating a Portal Page, adding a Report Viewer to it, setting the default report to display in the Report Viewer, selecting the desired View Mode options, and selecting the Data Drill View mode, and viewing the results in the Report Viewer.
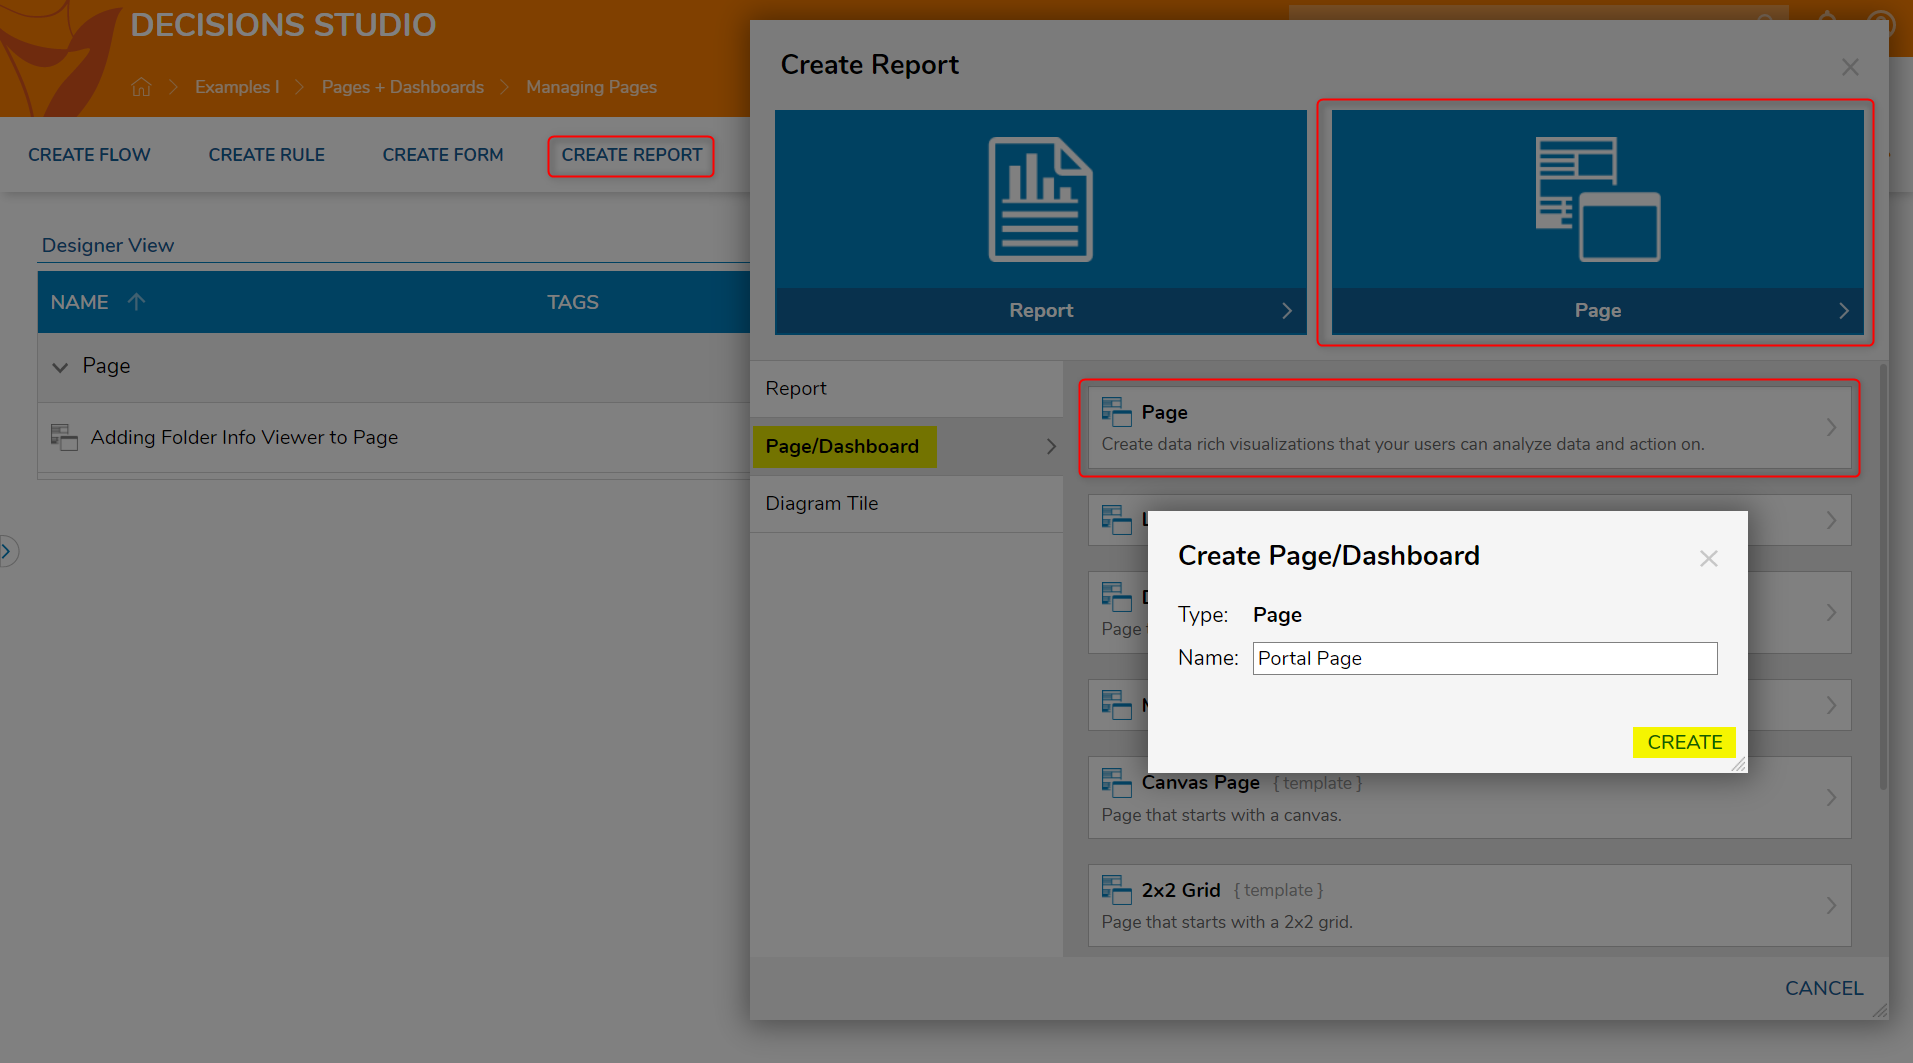
- To begin, navigate to a Designer Folder and select CREATE REPORT from the Global Action Panel.
- In the resulting window, select and name the Page [Portal]. Click CREATE.
- From the Toolbox, expand the Reports category and drag a Report Viewer component into the workspace.
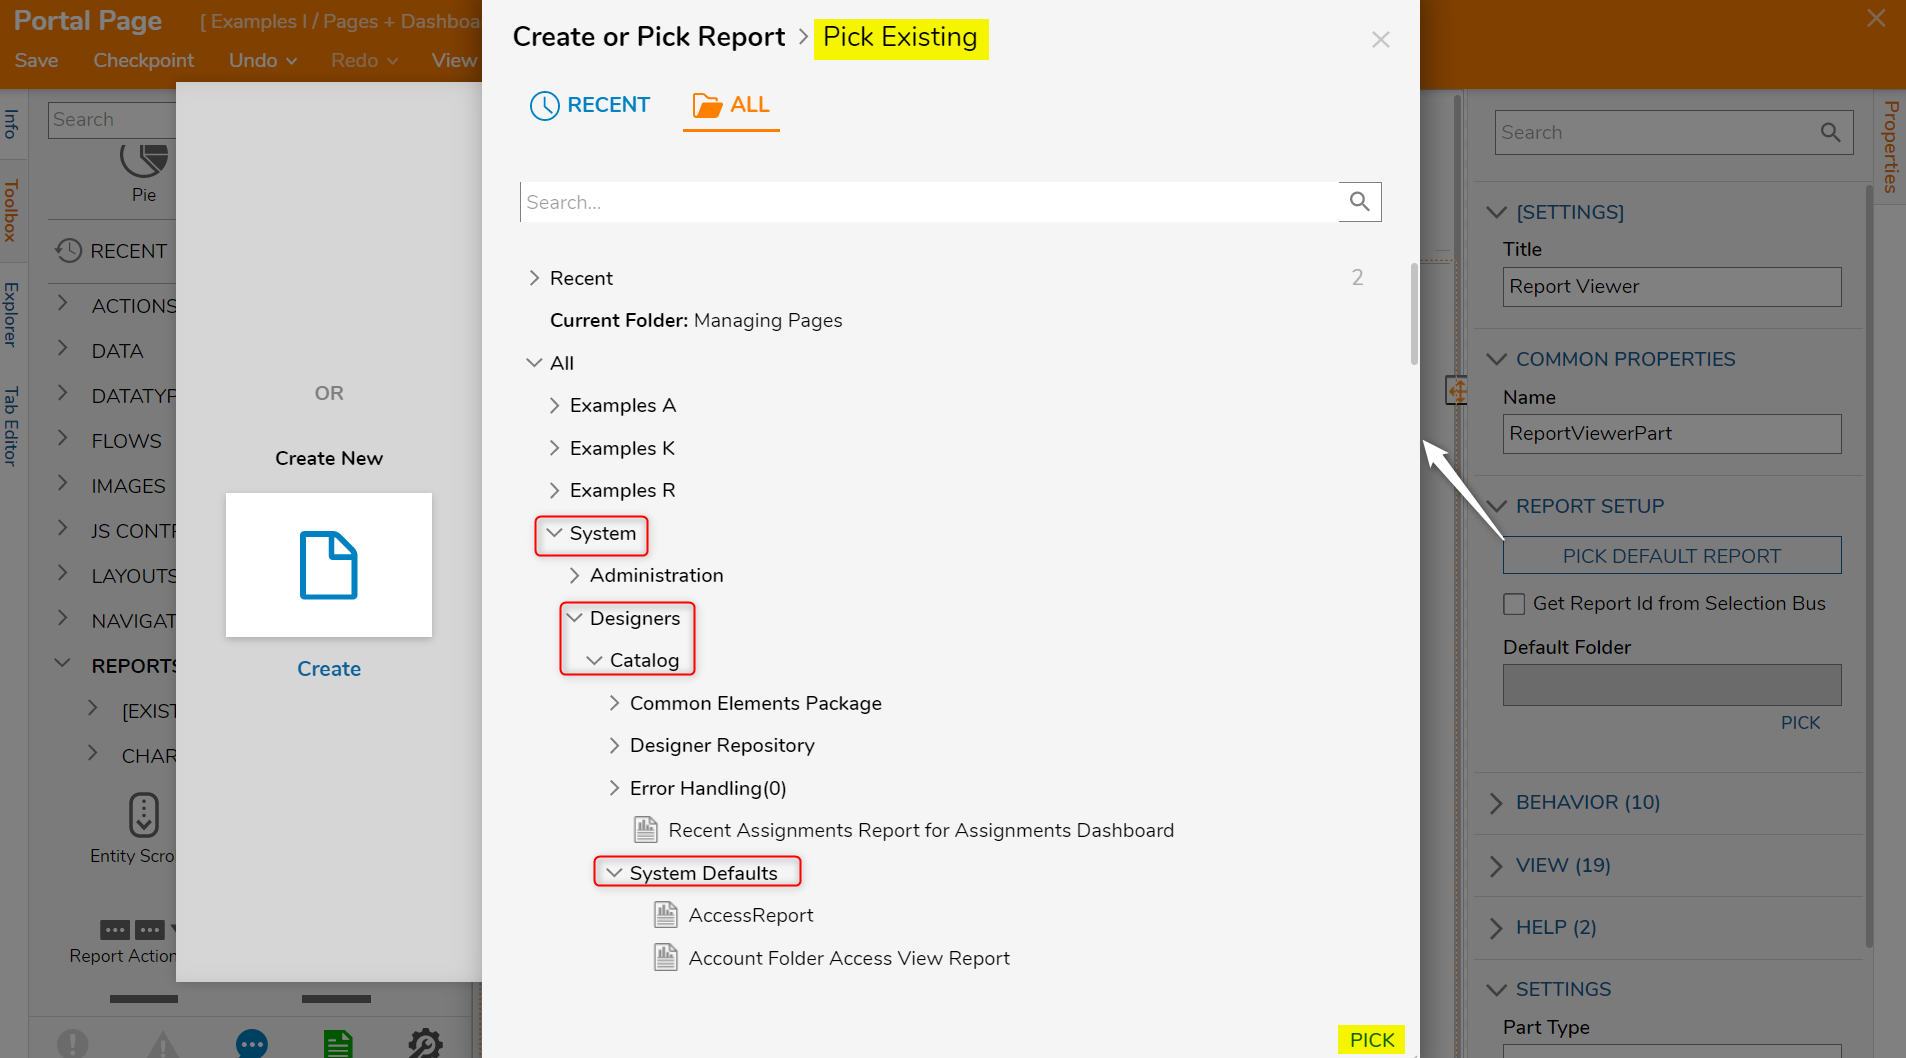
To set the report to be displayed when the user opens the page, click PICK DEFAULT REPORT found in the Properties panel > REPORT SETUP.
In the dialog window Create or Pick Report, PICK Pick existing. Navigate to ALL > All > System > Designers > Catalog > System Defaults and select a default Report and click PICK. In this example, RecentFolders was chosen.
- With a Report selected, the data drill settings can be changed. In the Properties panel, go to the View category and select the desired output options from the View Mode list.To use the Calendar, Charts, and Matrix options, the selected Report must be configured with those options.
- In VIEW > Data Drill View, the user can select from the items in the drop down list to set the view to be displayed when the user drills down into a Report.
- The Page is complete. Save it and Close the Page Designer.
- To view the Report in the Designer Folder, click on the page’s thumbnail and select View > Preview Page from its Action menu.
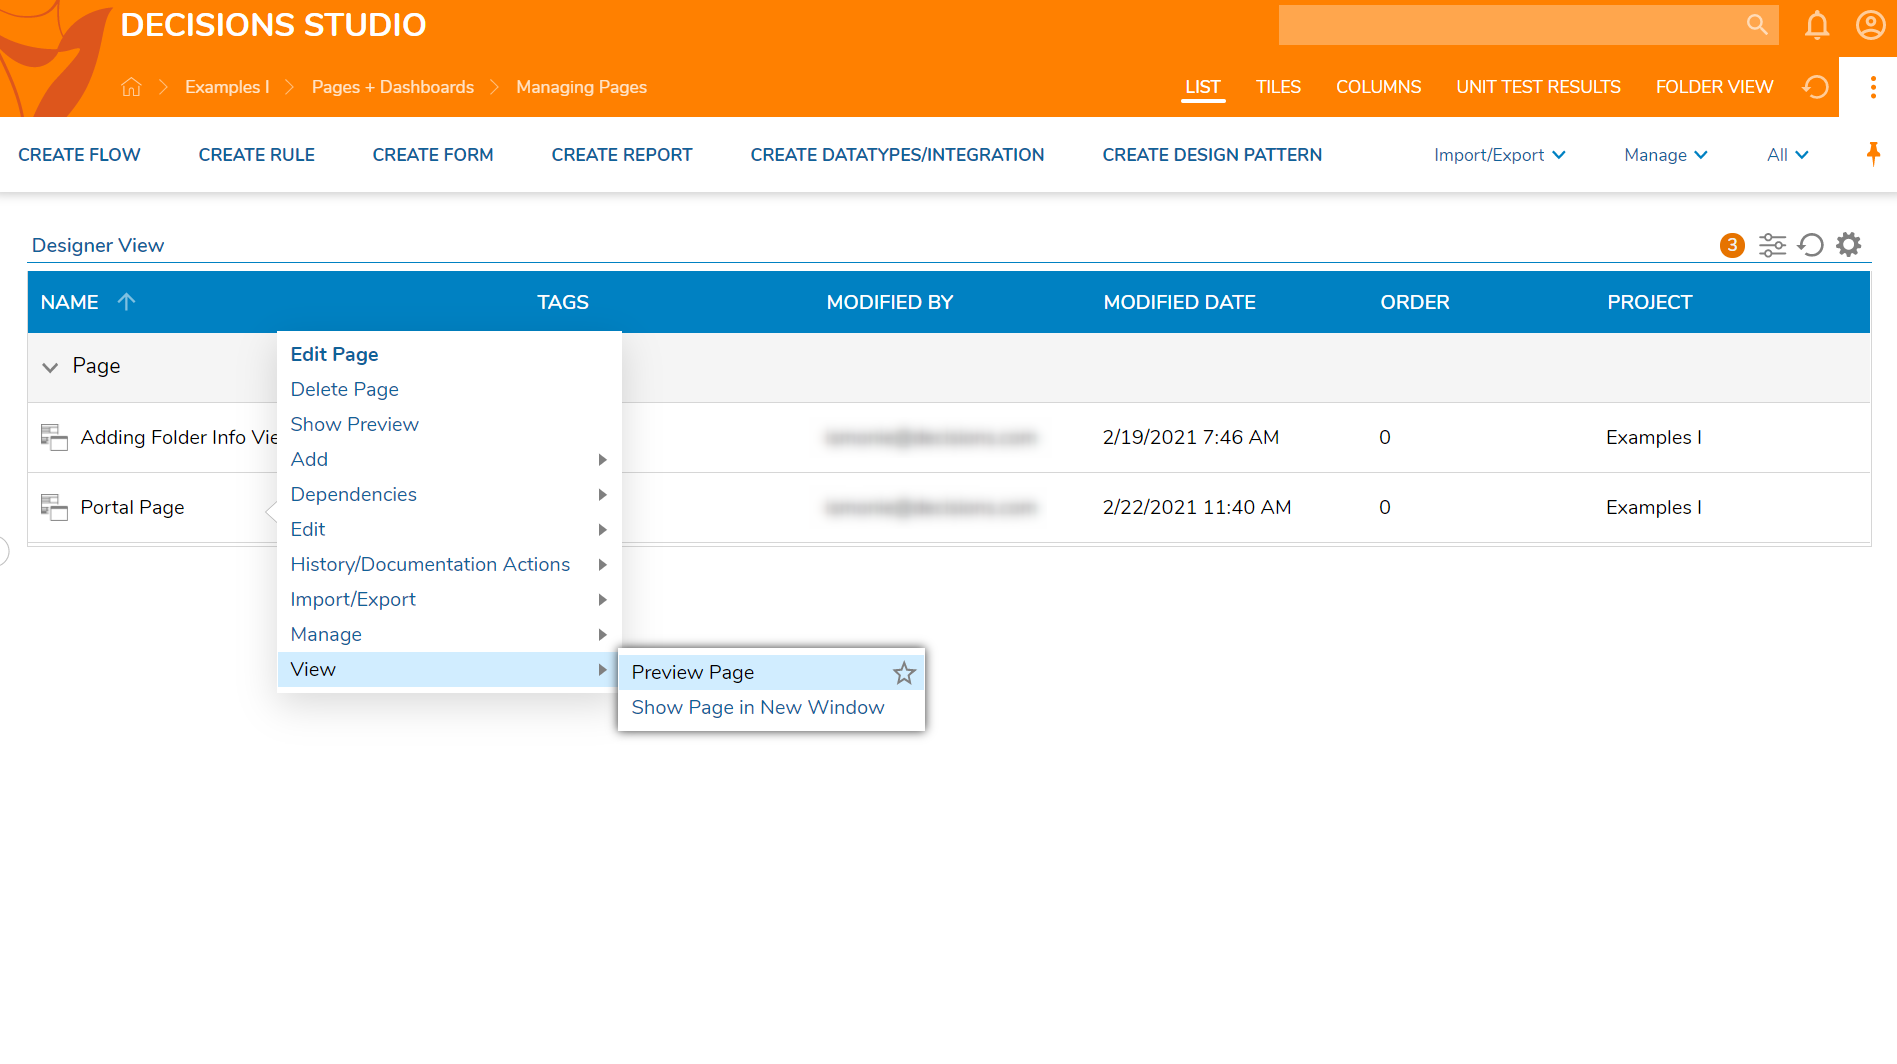
- The Report opens in a new window and will display in one of the previously selected output options from the Properties > VIEW > View Mode list. By default, if Data is selected, the Report will always be displayed in the grid view mode.
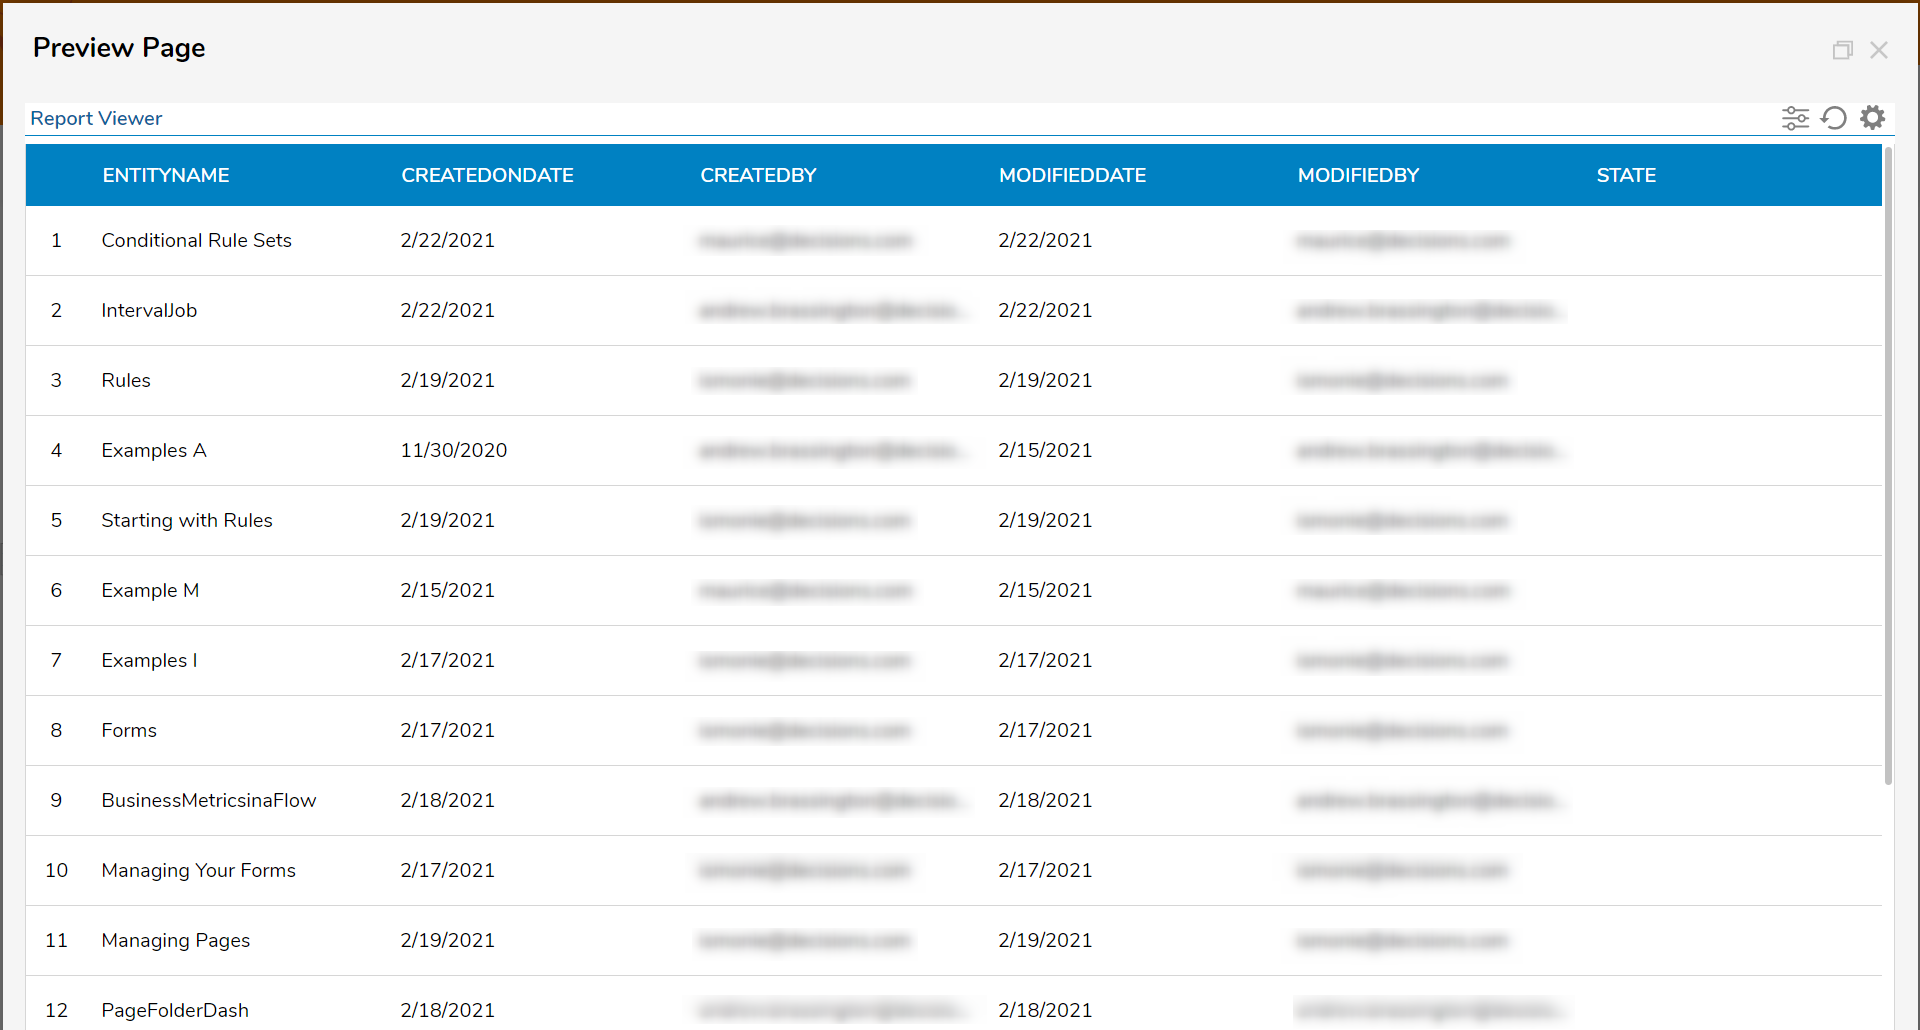
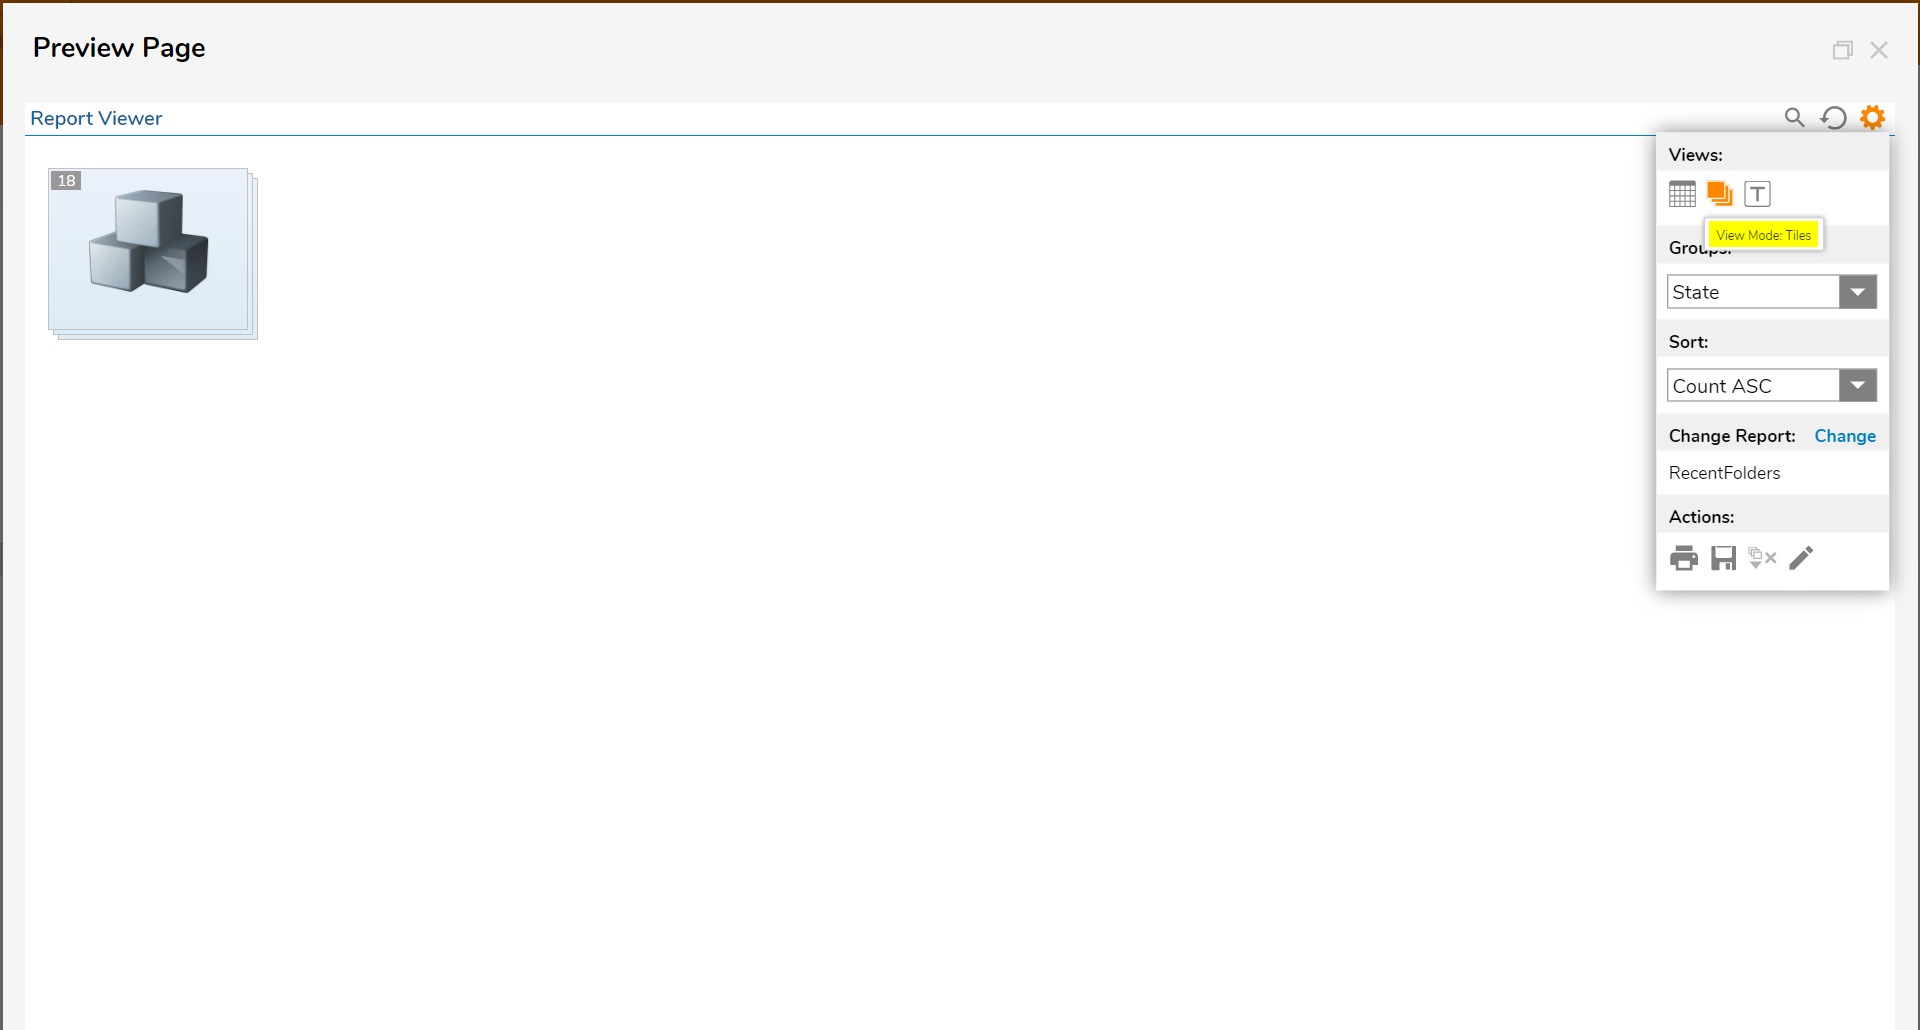
- To change the output view mode to Tiles, select the corresponding View Mode icon found in the top left of the Report Viewer.
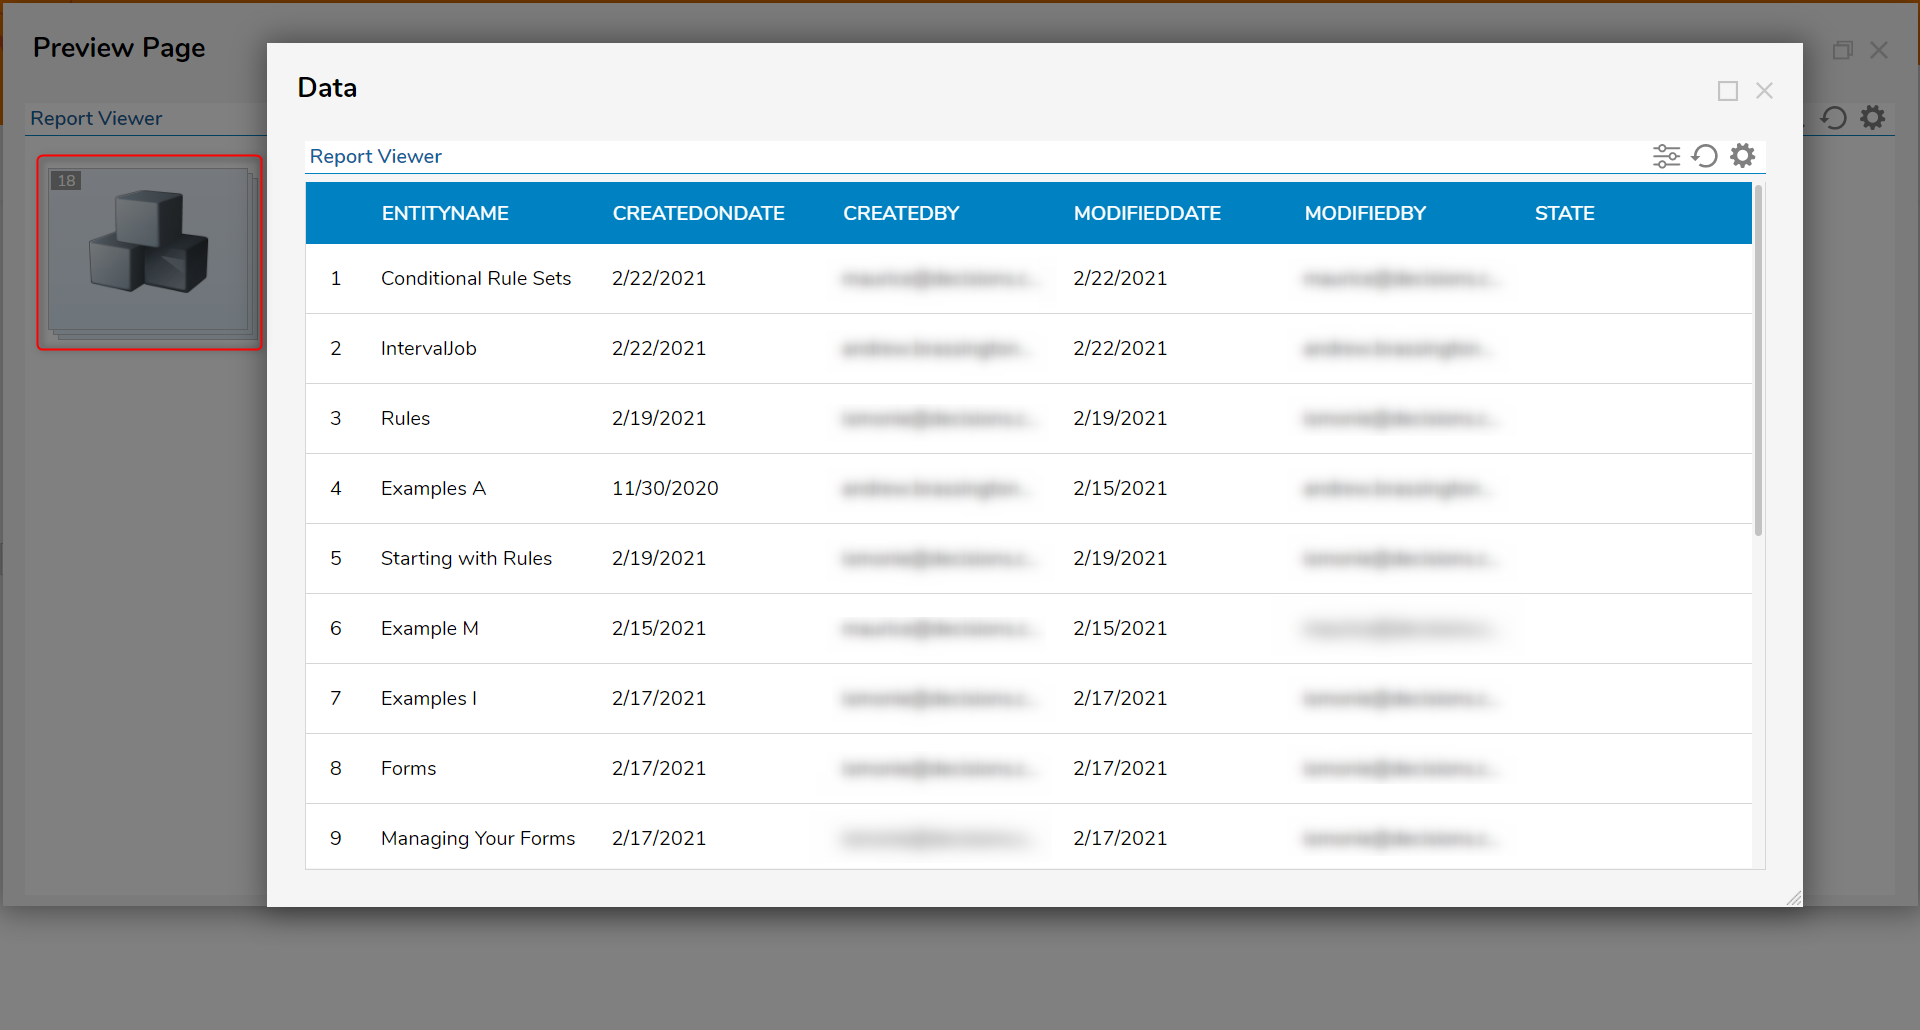
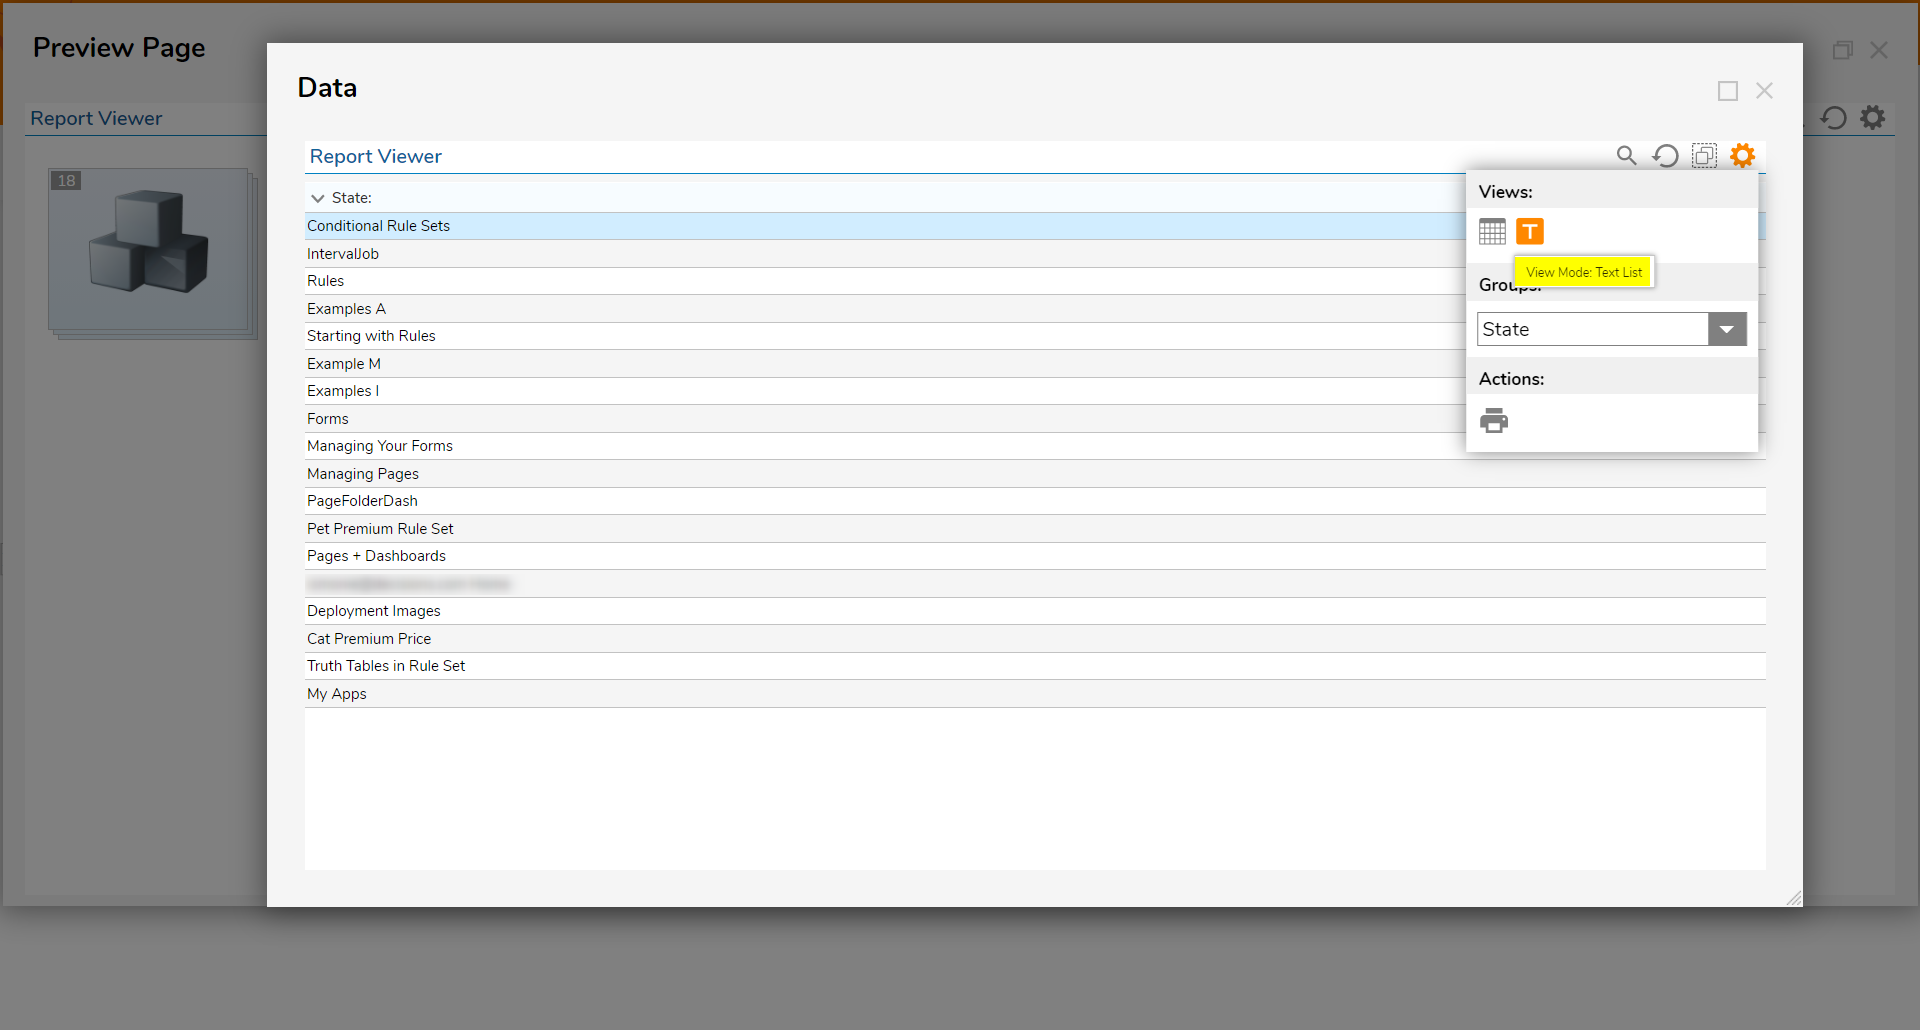
- Once the View Mode has been selected, clicking on individual data entries in the Report allows the user to drill down into the Report. The information regarding the displayed data is in the Data Drill View mode selected in the Page Designer. Notice, the user can manually change the drill-down view by selecting one of the available buttons at the top left of the pop-up window.
- Lastly, selecting other Report View modes will give the user the same option to drill down into the Report.


Was this article helpful?