Capturing Business Metrics in a Flow
- 18 Feb 2021
- 3 Minutes to read
- Print
- DarkLight
Capturing Business Metrics in a Flow
- Updated on 18 Feb 2021
- 3 Minutes to read
- Print
- DarkLight
Article Summary
Share feedback
Thanks for sharing your feedback!
Overview
Business Metrics are quantifiable values that measure the success and efficiency of a given business process. For additional information, see About Business Metrics.
In this example, Decisions allows users to choose the Flow Step(s) associated with that application as relevant Business Metrics and display it in a Dashboard for analysts to see. This example tracks approvals versus rejections for a Flow.
Example
First, define the metrics. This will have an impact on the model building later.
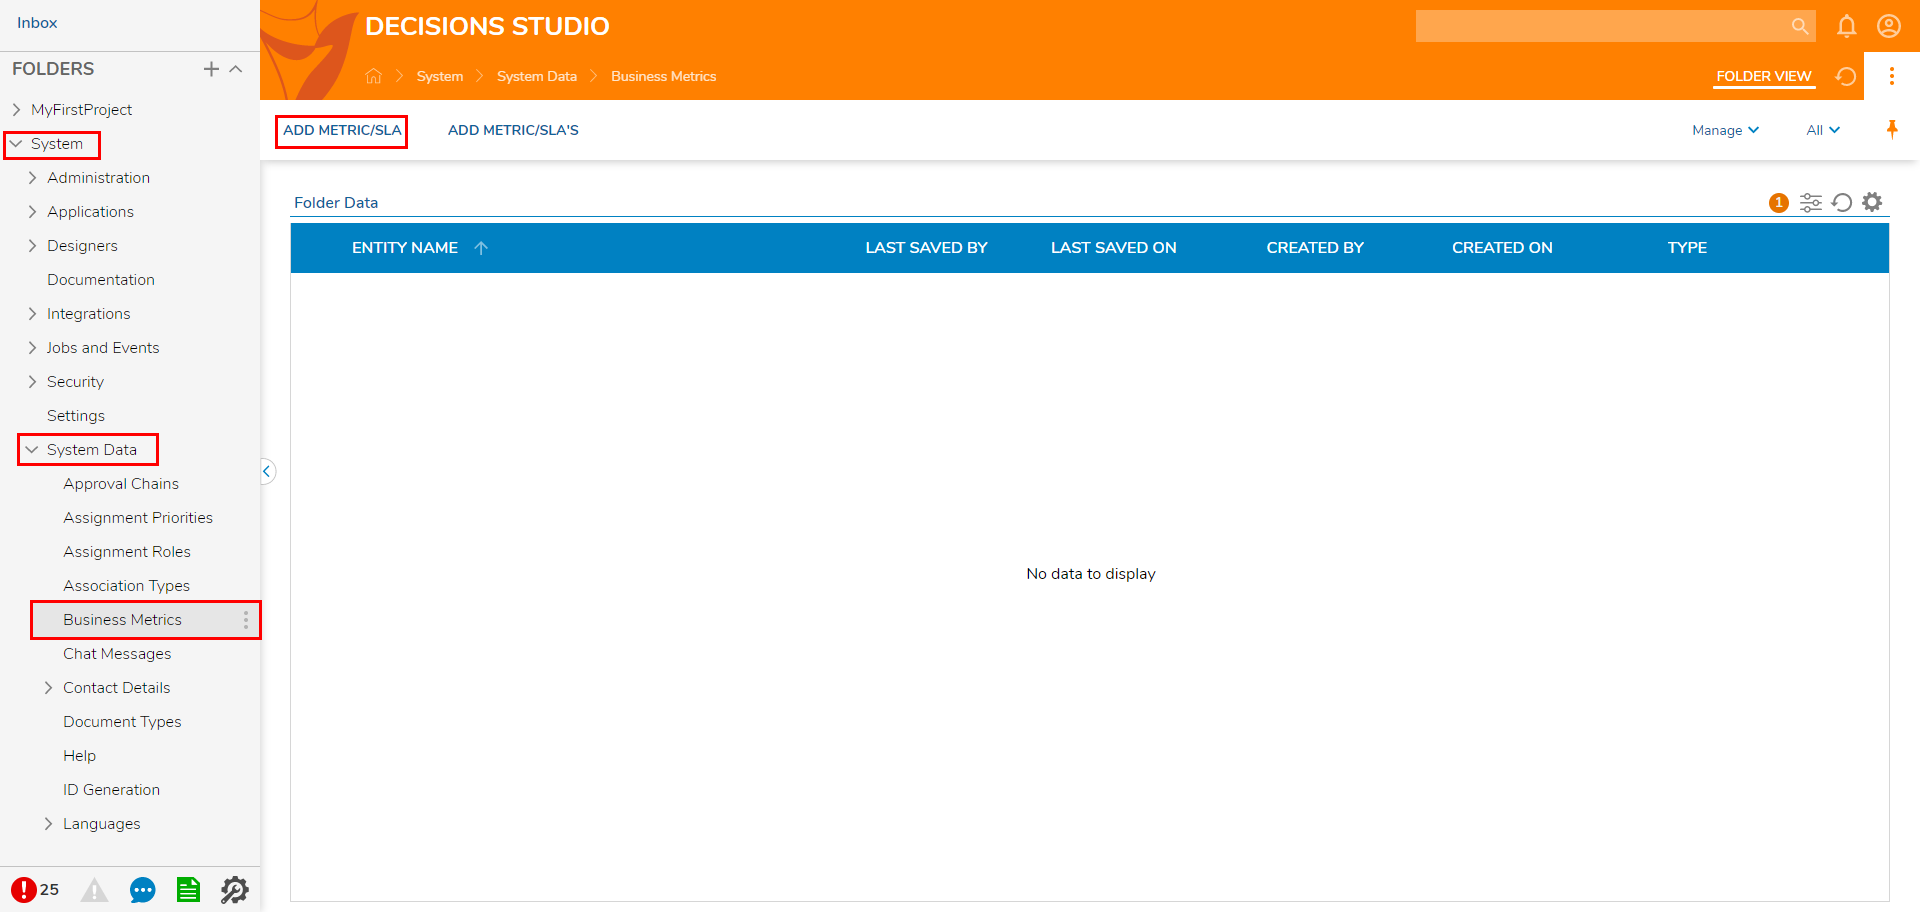
- From the Design Studio, navigate to System > System Data > Business Metrics.
- Select ADD METRIC/SLA from the Global Action Bar.
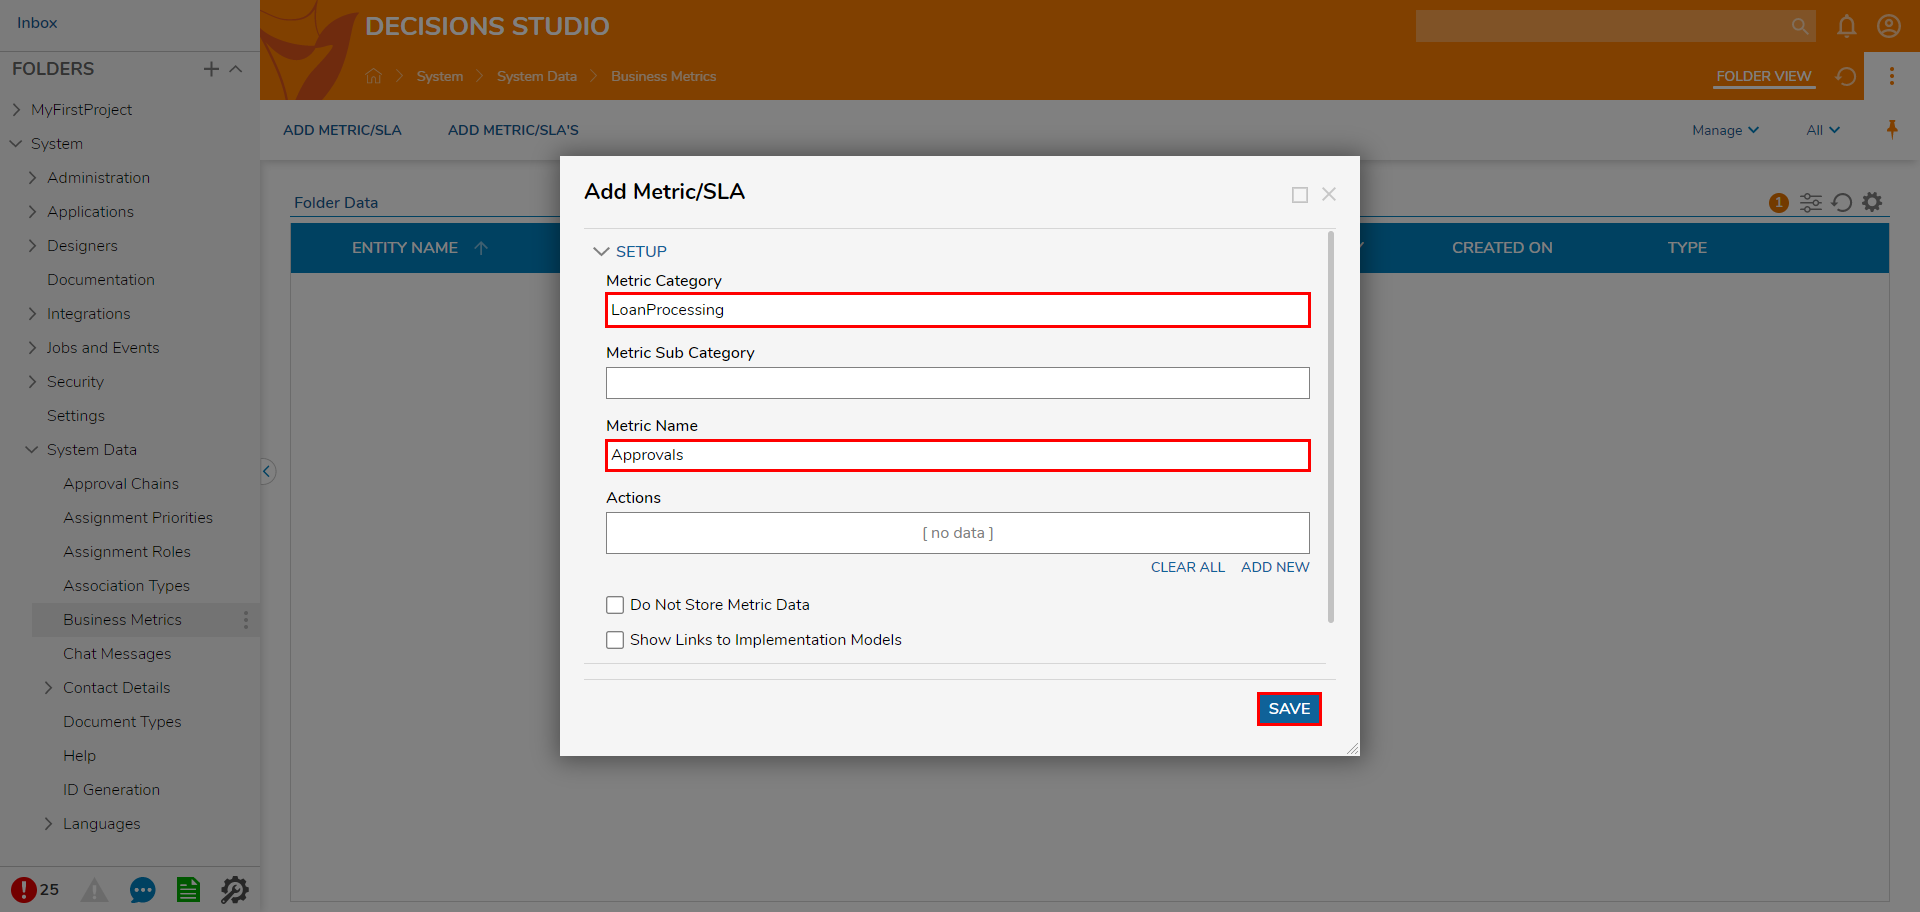
- Define the Metric Category as "LoanProcessing" and the Metric Name as "Approvals", then click SAVE.
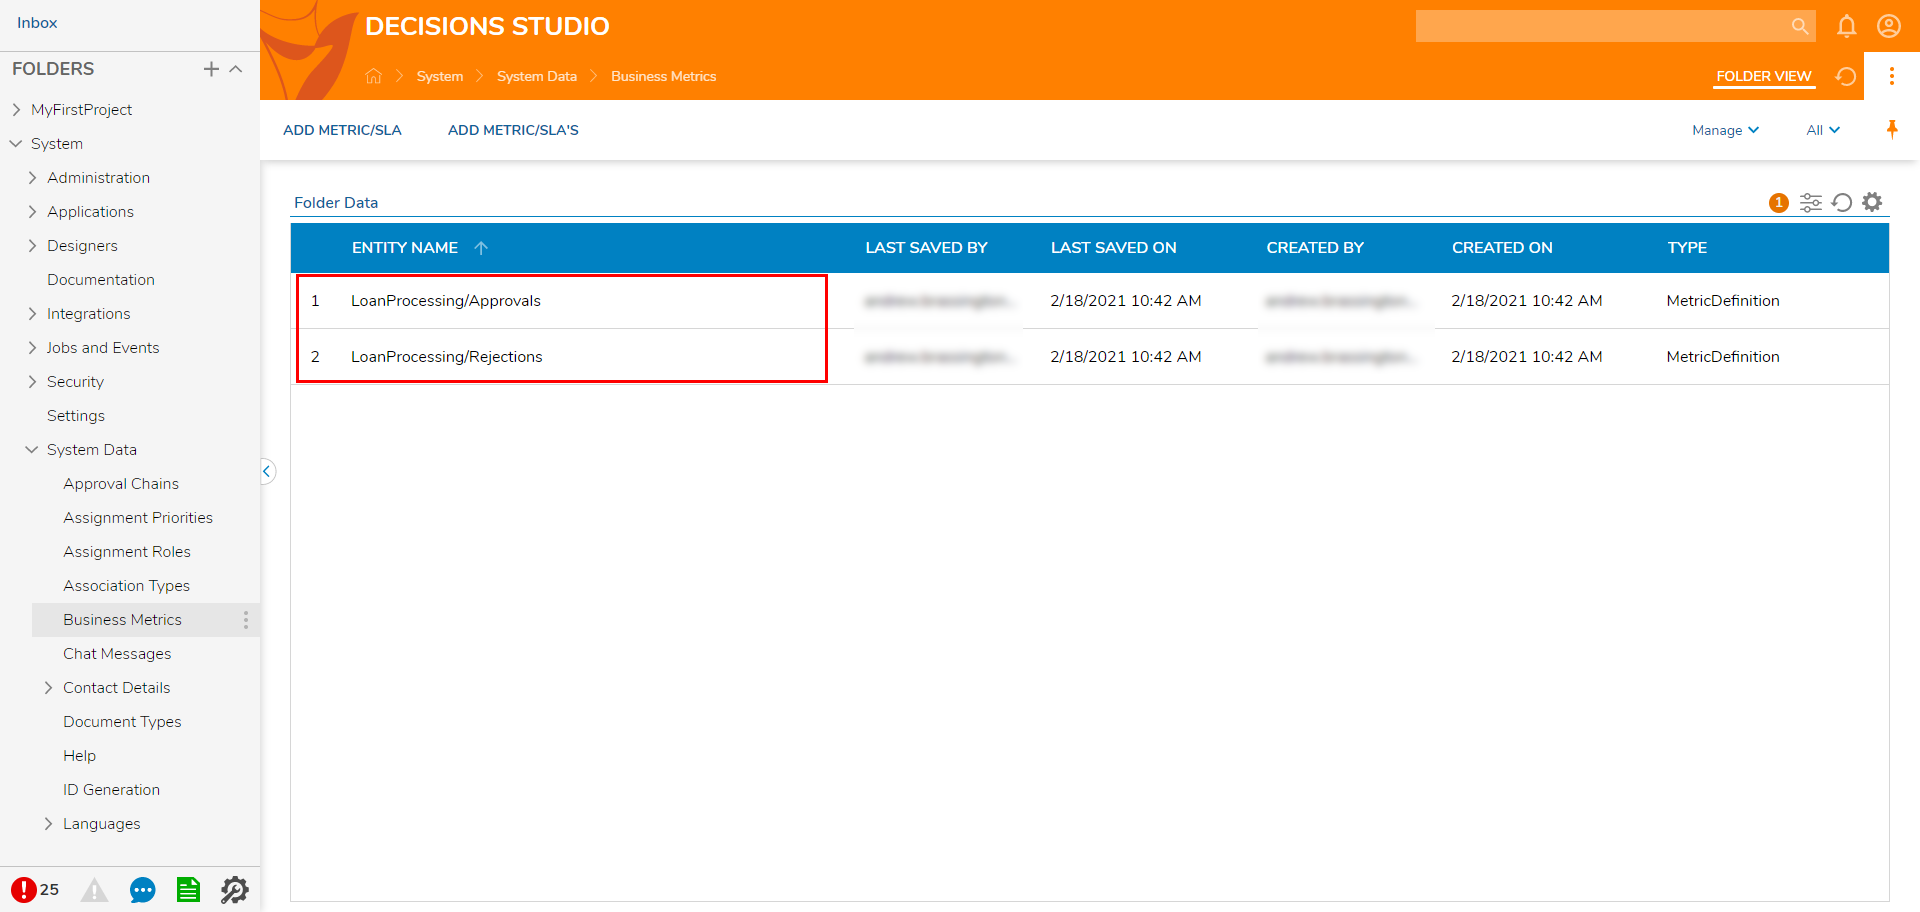
- Repeat this process again using the same Metric Category, but this time defining Metric Name as "Rejections."Following this Process with create a singular Metric Category called "LoanProcessing", and two Metrics pertaining to that Category; "Approvals" and "Rejections."
- Repeat this process again using the same Metric Category, but this time defining Metric Name as "Rejections."
Next, CREATE the Flow that will utilize the Business Metrics by navigating to a Designer Project and selecting CREATE FLOW.
Select Flow, provide a Name, then click CREATE.
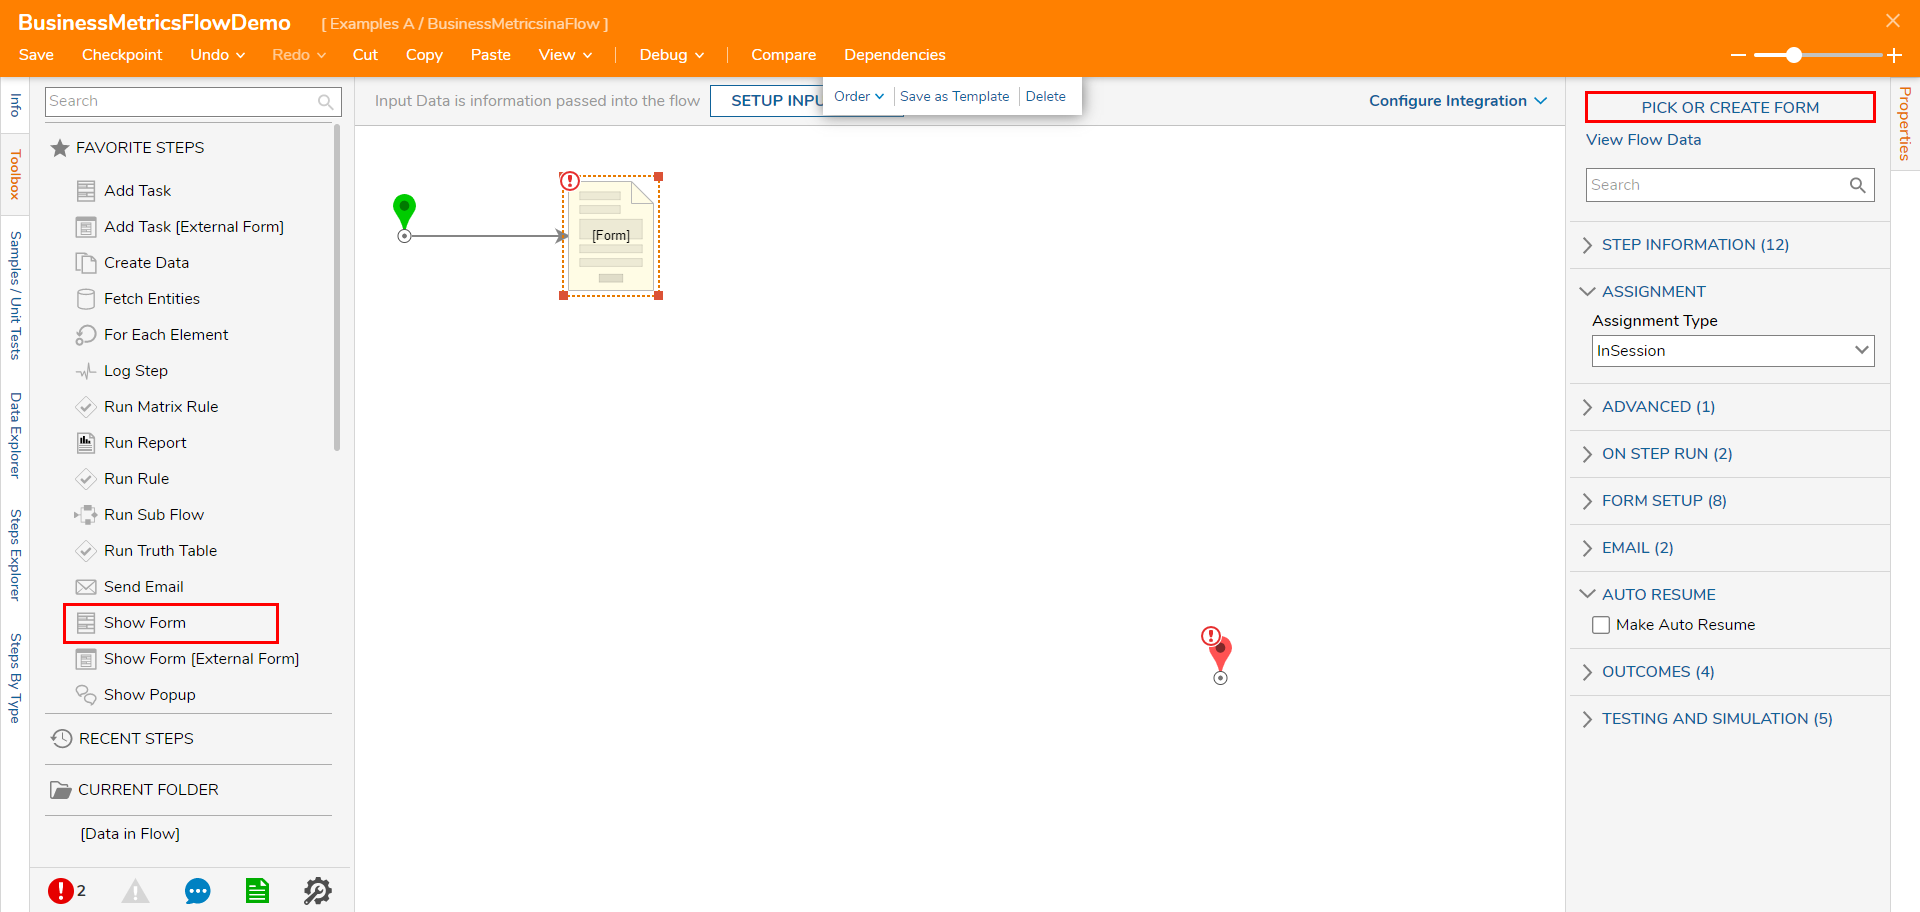
From the Flow Designer, attach a Show Form step, from the FAVORITE STEPS category of the Toolbox tab.
From the Show Form step's Properties tab, click PICK OR CREATE FLOW, then select CREATE.
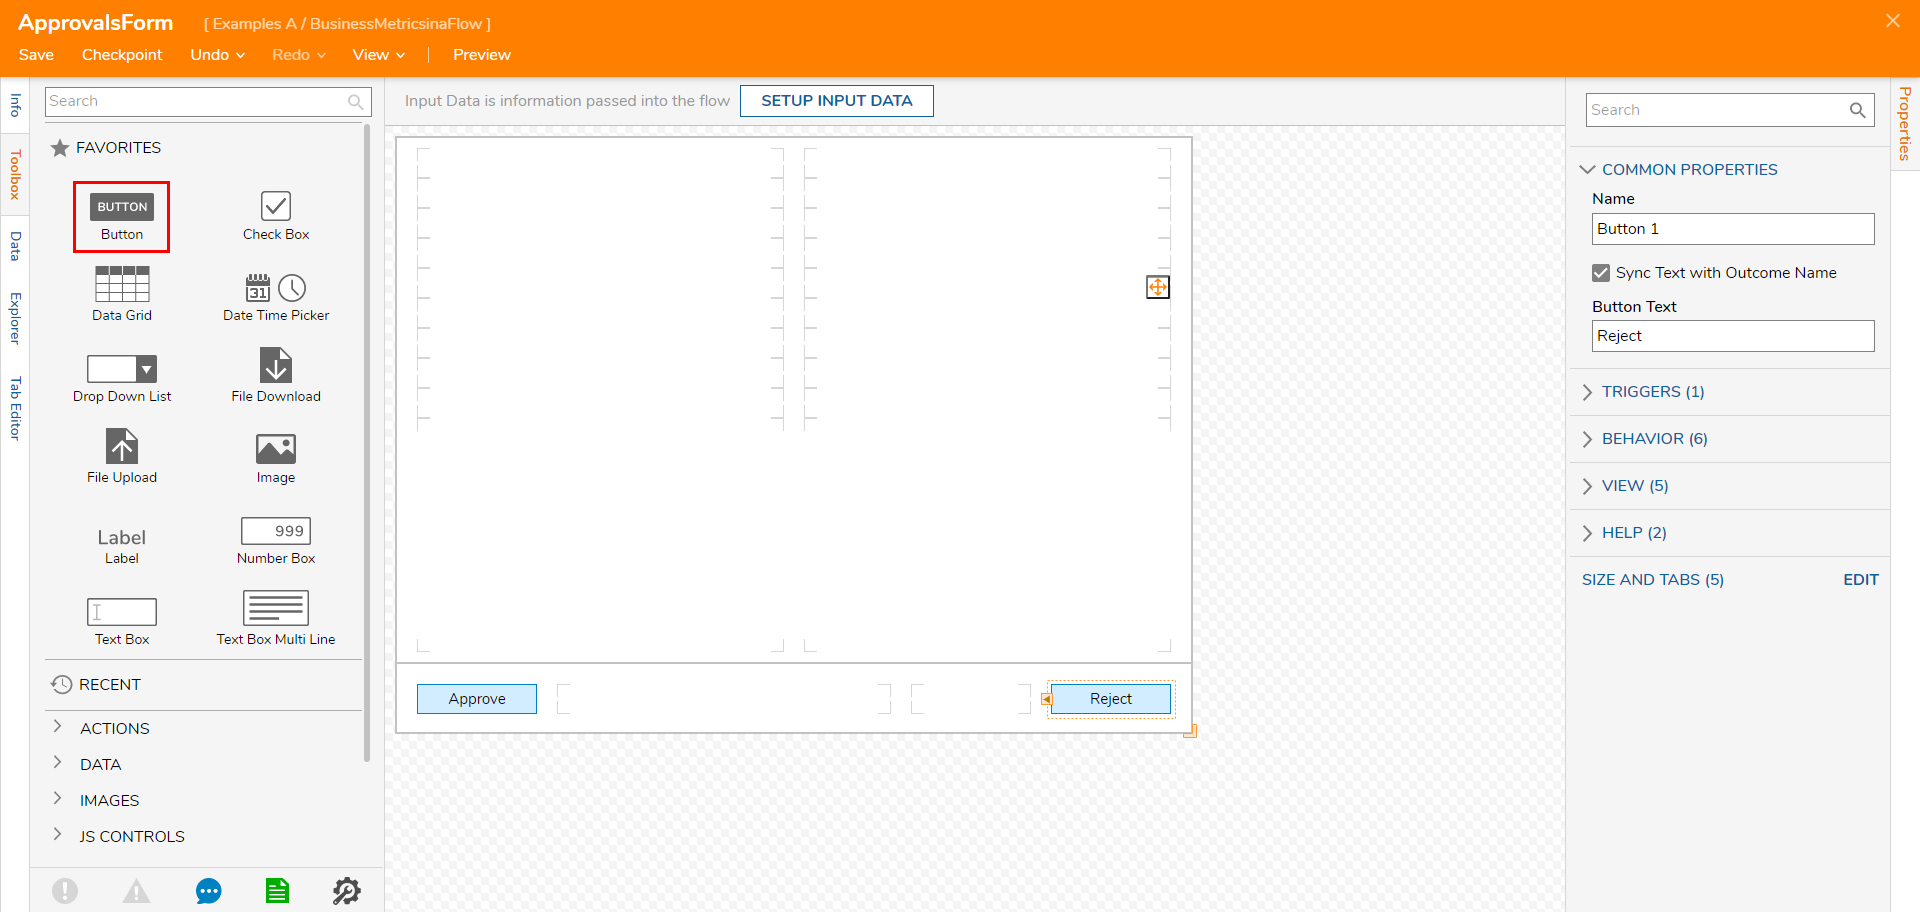
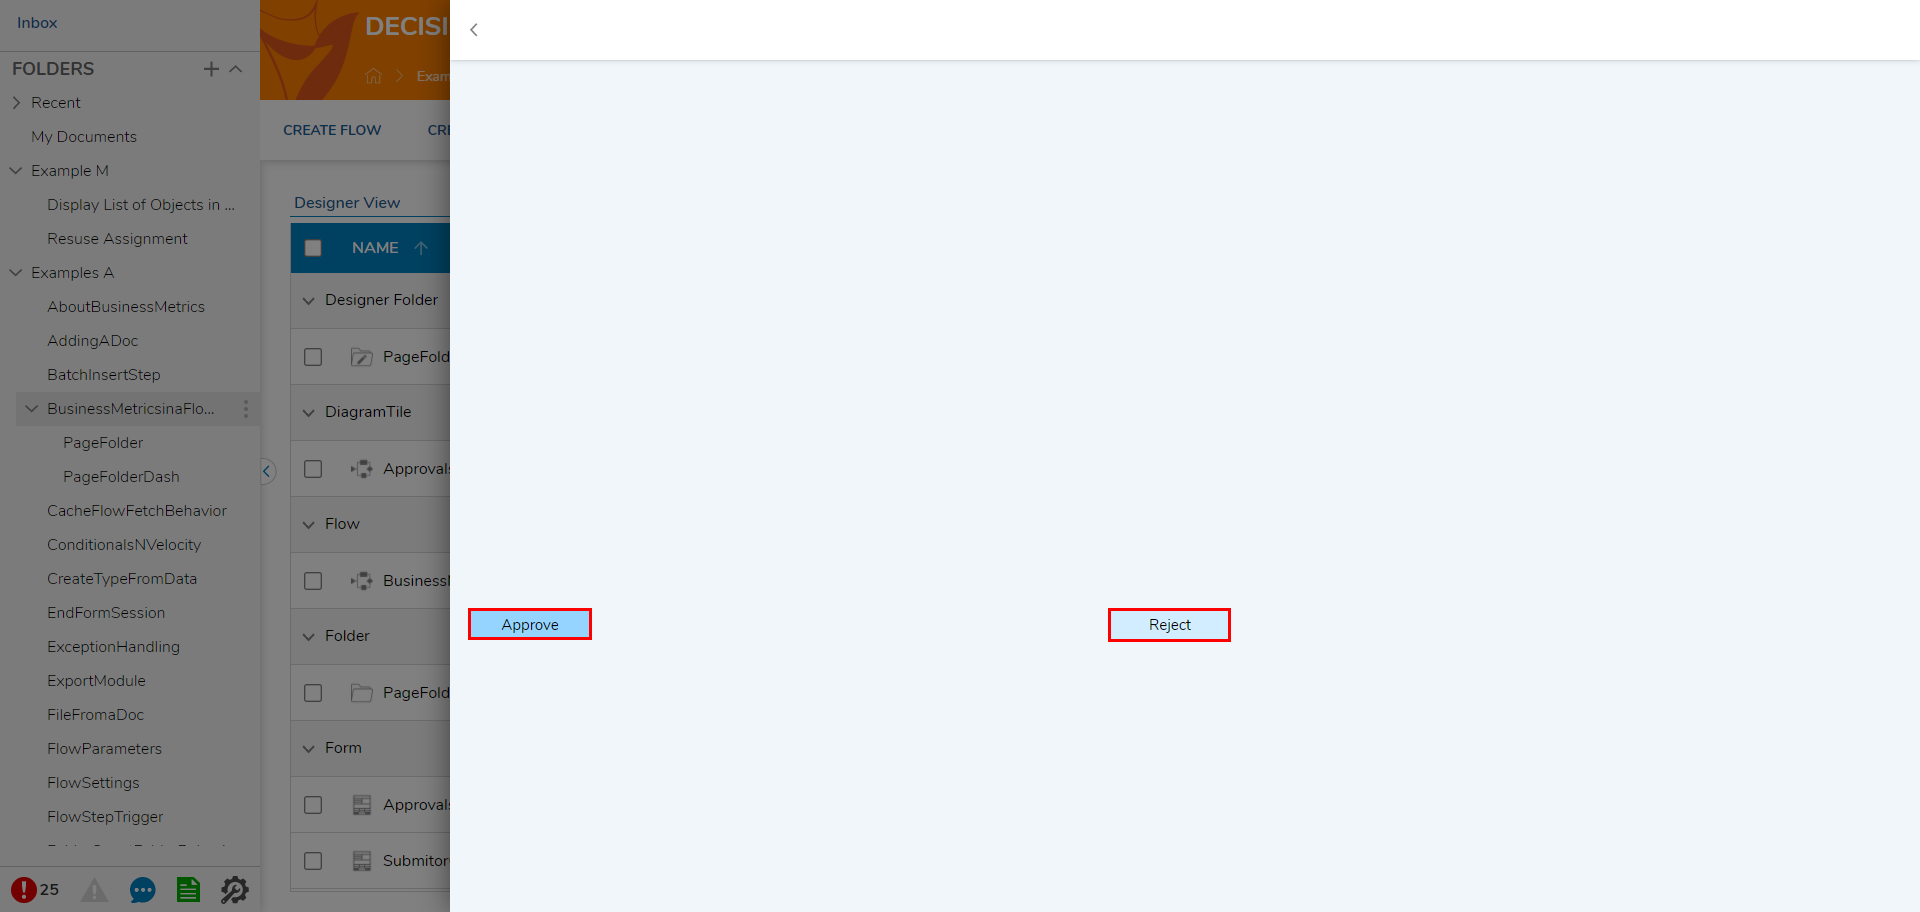
Design a Form that contains two Button components; one displaying the Button Text, "Approve", the other "Reject." Save then close the Form via X.
Connect an additional Show Form path to the Approve path; select the new Show Form step then CREATE a new Form.
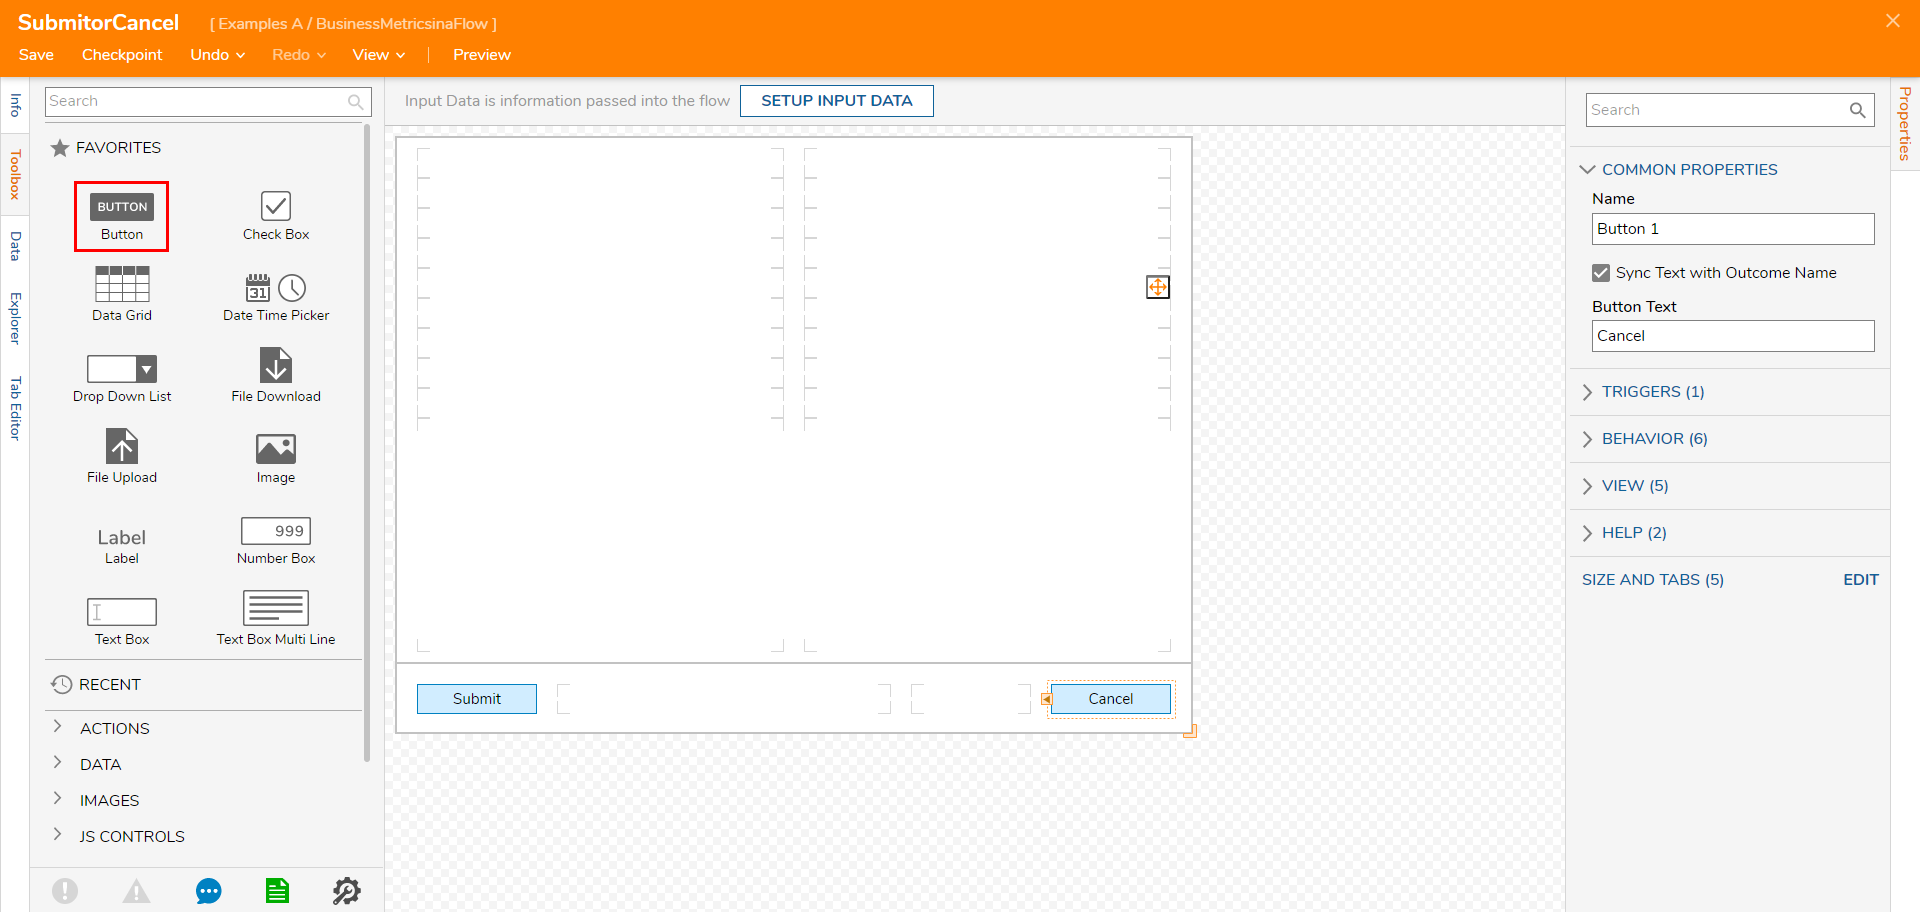
In the Form Designer, configure a Form that contains a "Submit" and a "Cancel" Button. Save and close this Form.
Attach another Show Form step, this time to the Reject path; PICK the Cancel/Submit Form.
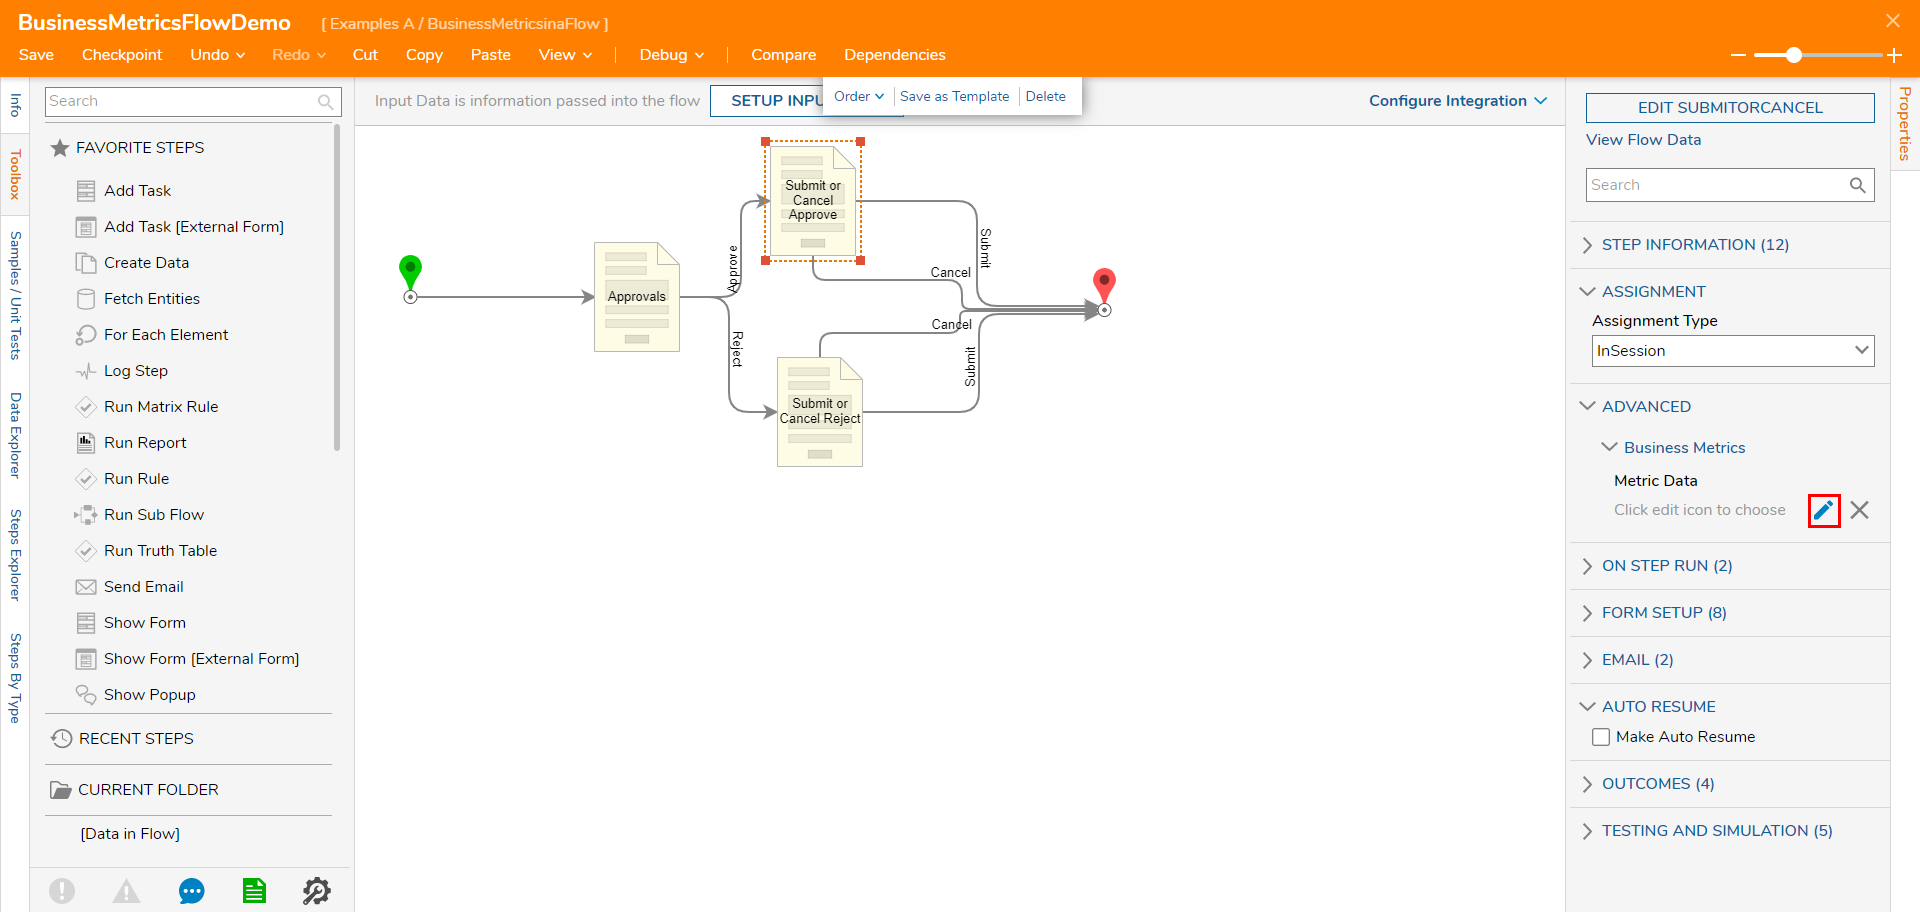
Attach all remaining paths to the End step, then select the Cancel/Submit Form.
From its Properties tab, navigate to ADVANCED > Business Metrics and select the Edit icon (denoted by a pencil icon).
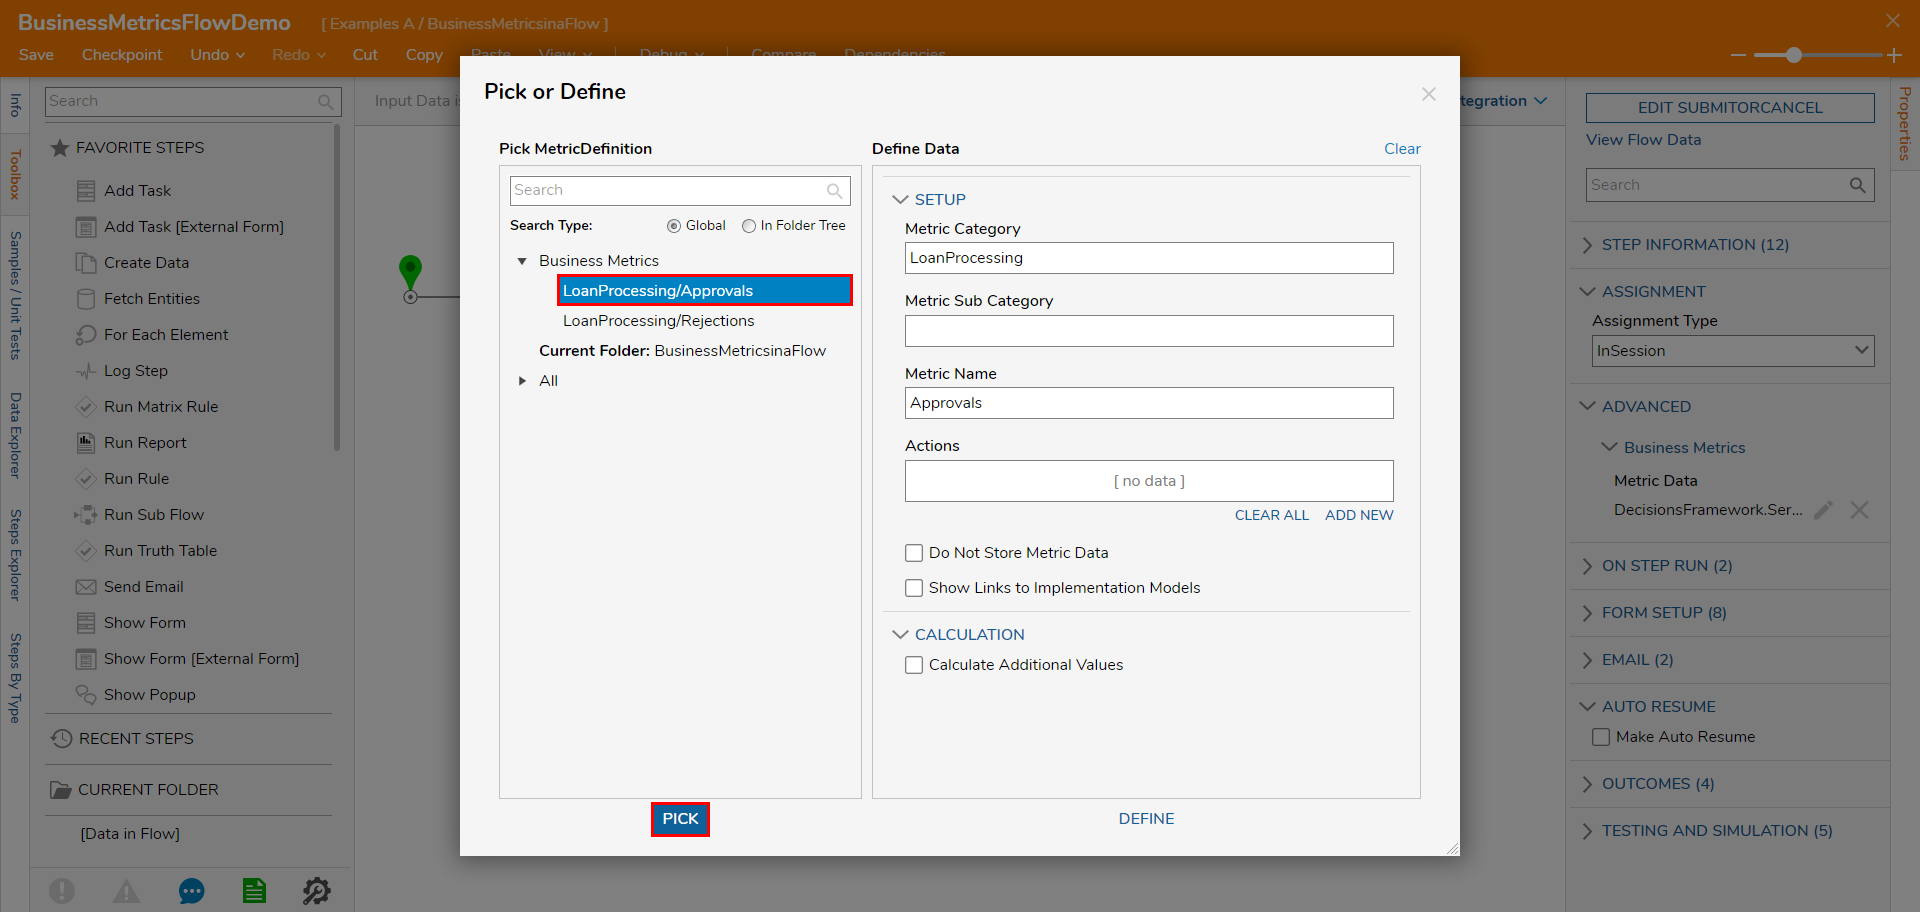
Select the LoanProcessing/Approvals Metric from the left column, then click PICK.
Repeat this process for the Cancel/Submit Form on the Reject path, this time selecting the LoanProcessing/Rejections Metric.
Save and close the Flow.
From a Designer Project, select CREATE REPORT, click Page, provide a Name, then click CREATE.
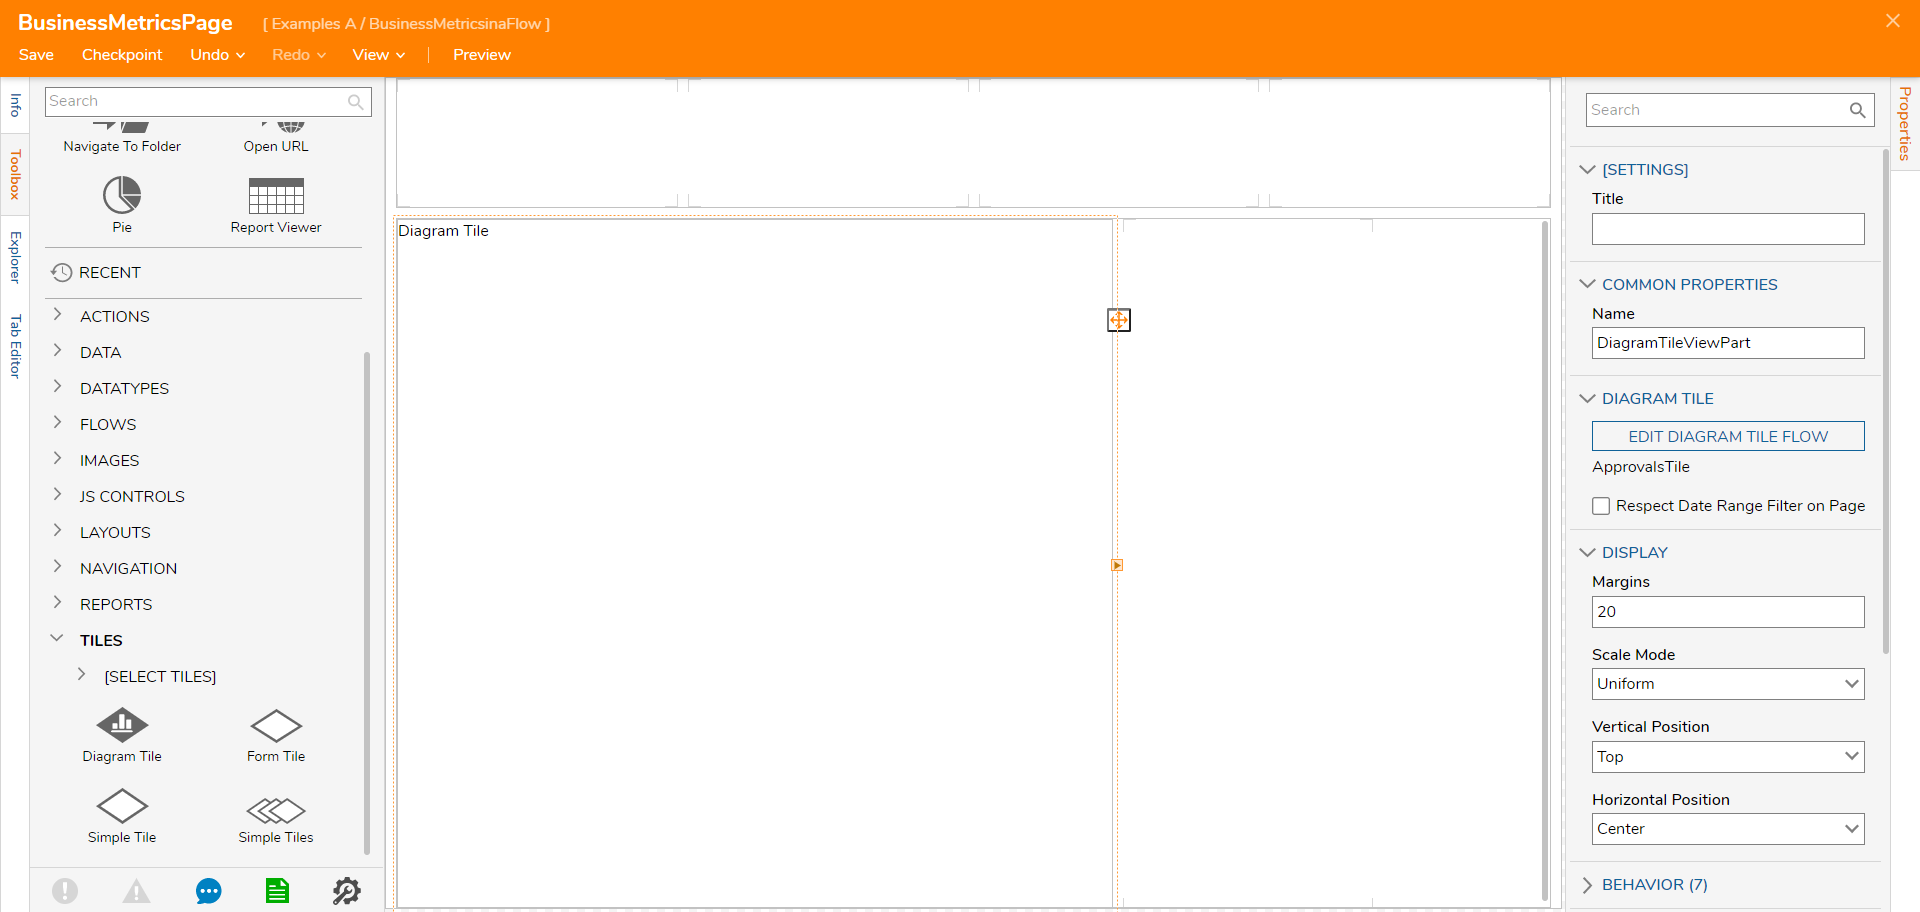
From the Page Designer, navigate to Toolbox > TILES, and add a Diagram Tile. From the Diagram Tile's Properties tab, click PICK DIAGRAM TILE FLOW.
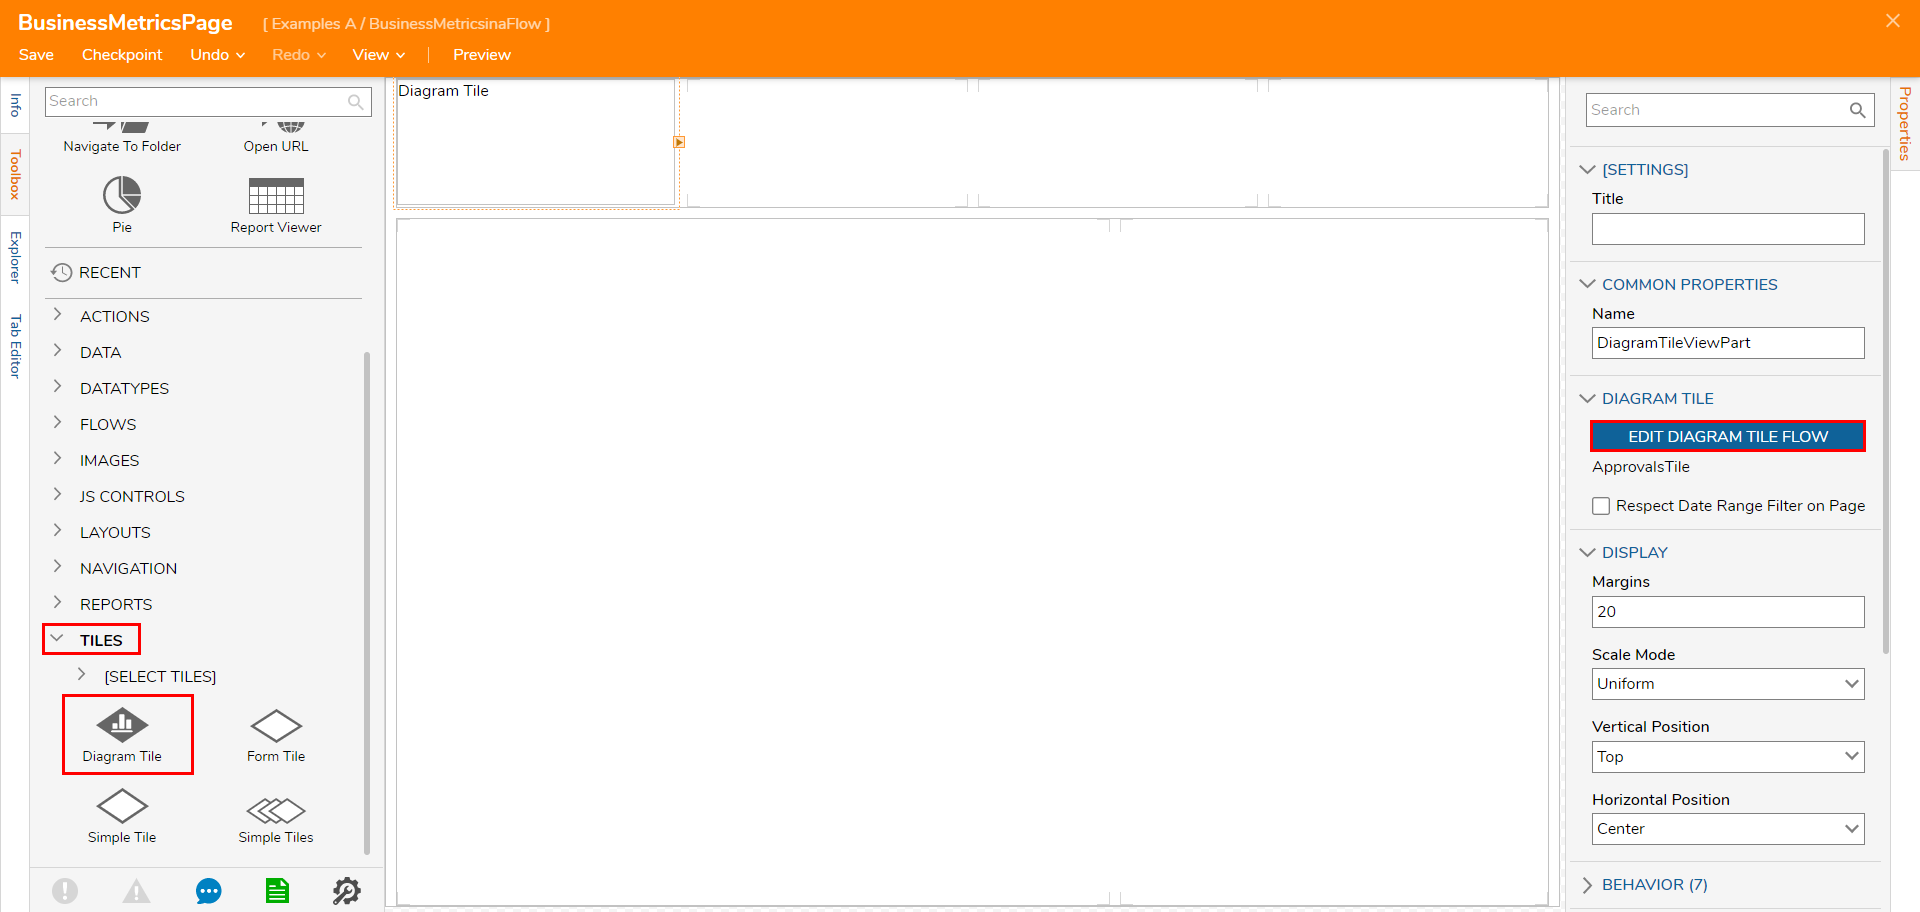
Select CREATE, then Diagram Tile, Name the Tile, then click CREATE once more.
From Diagram Designer, add a Start step, an End step, and two Page - Form Shapes from the Toolbox tab.
Navigate to the Properties tab for one of the Page - Form Shapes and edit the CONFIGURATION DEFAULTS.
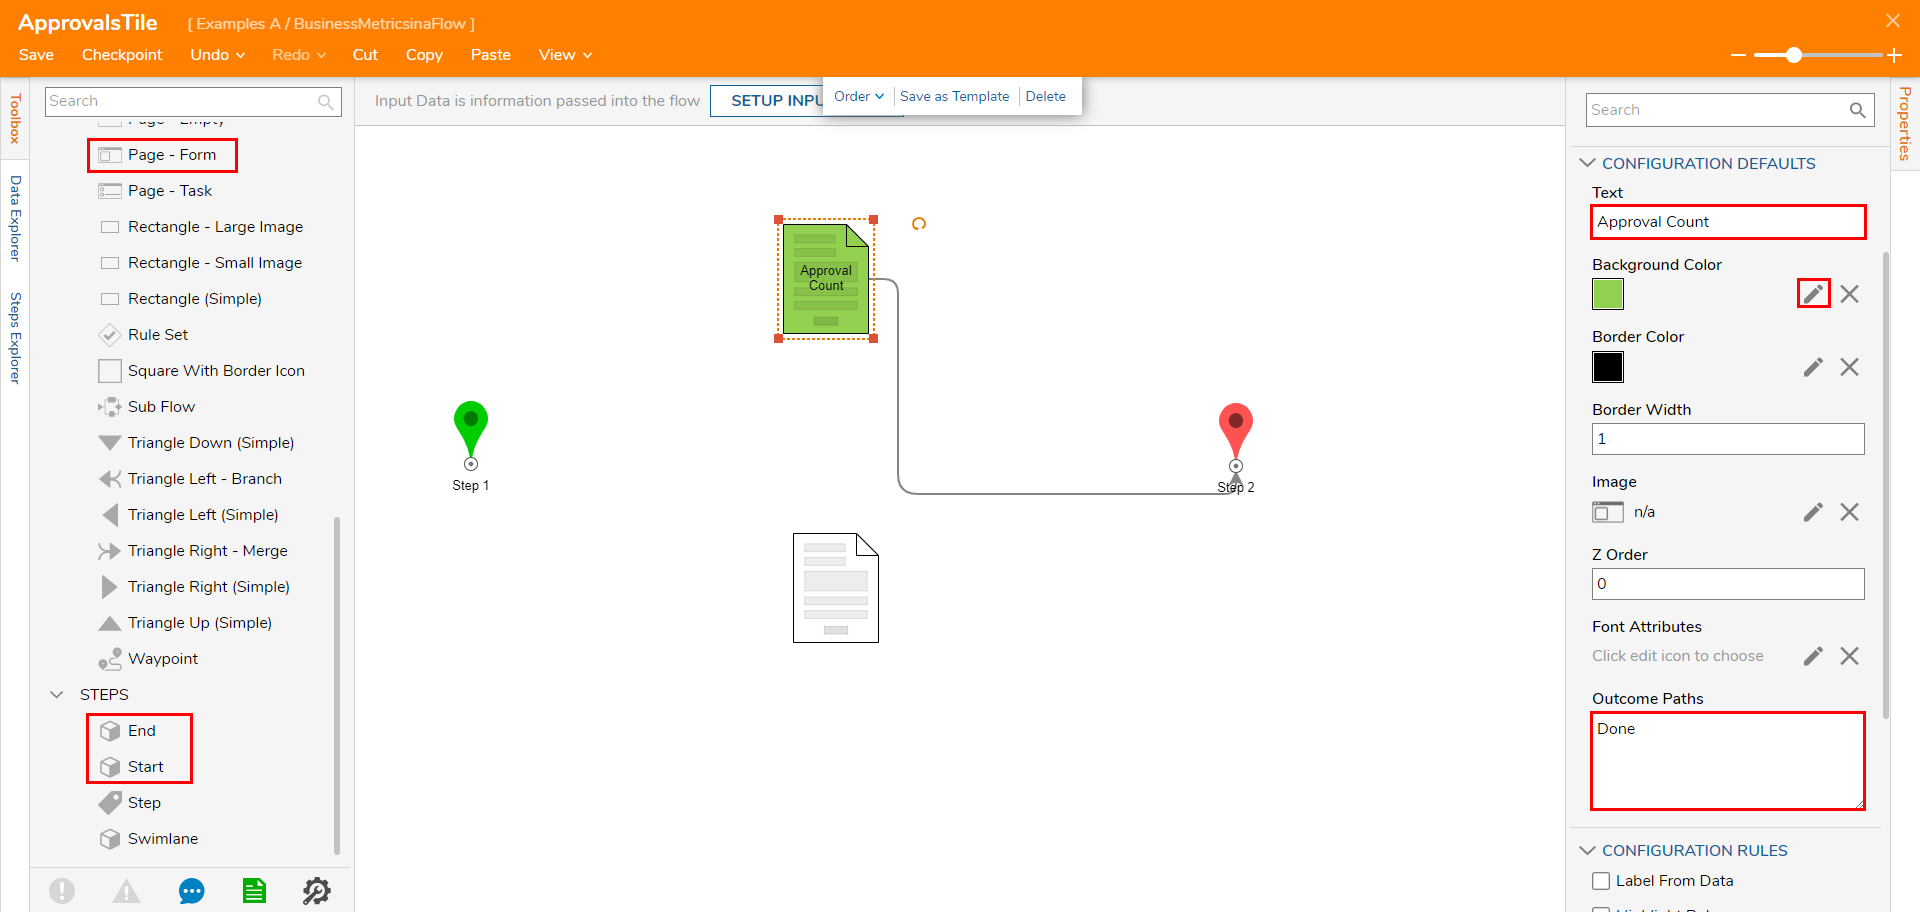
Map "Approval Count" under Text, and change the Background Color.
Under the Outcome Paths input, map Done. Then, attach the Done path to the End step.
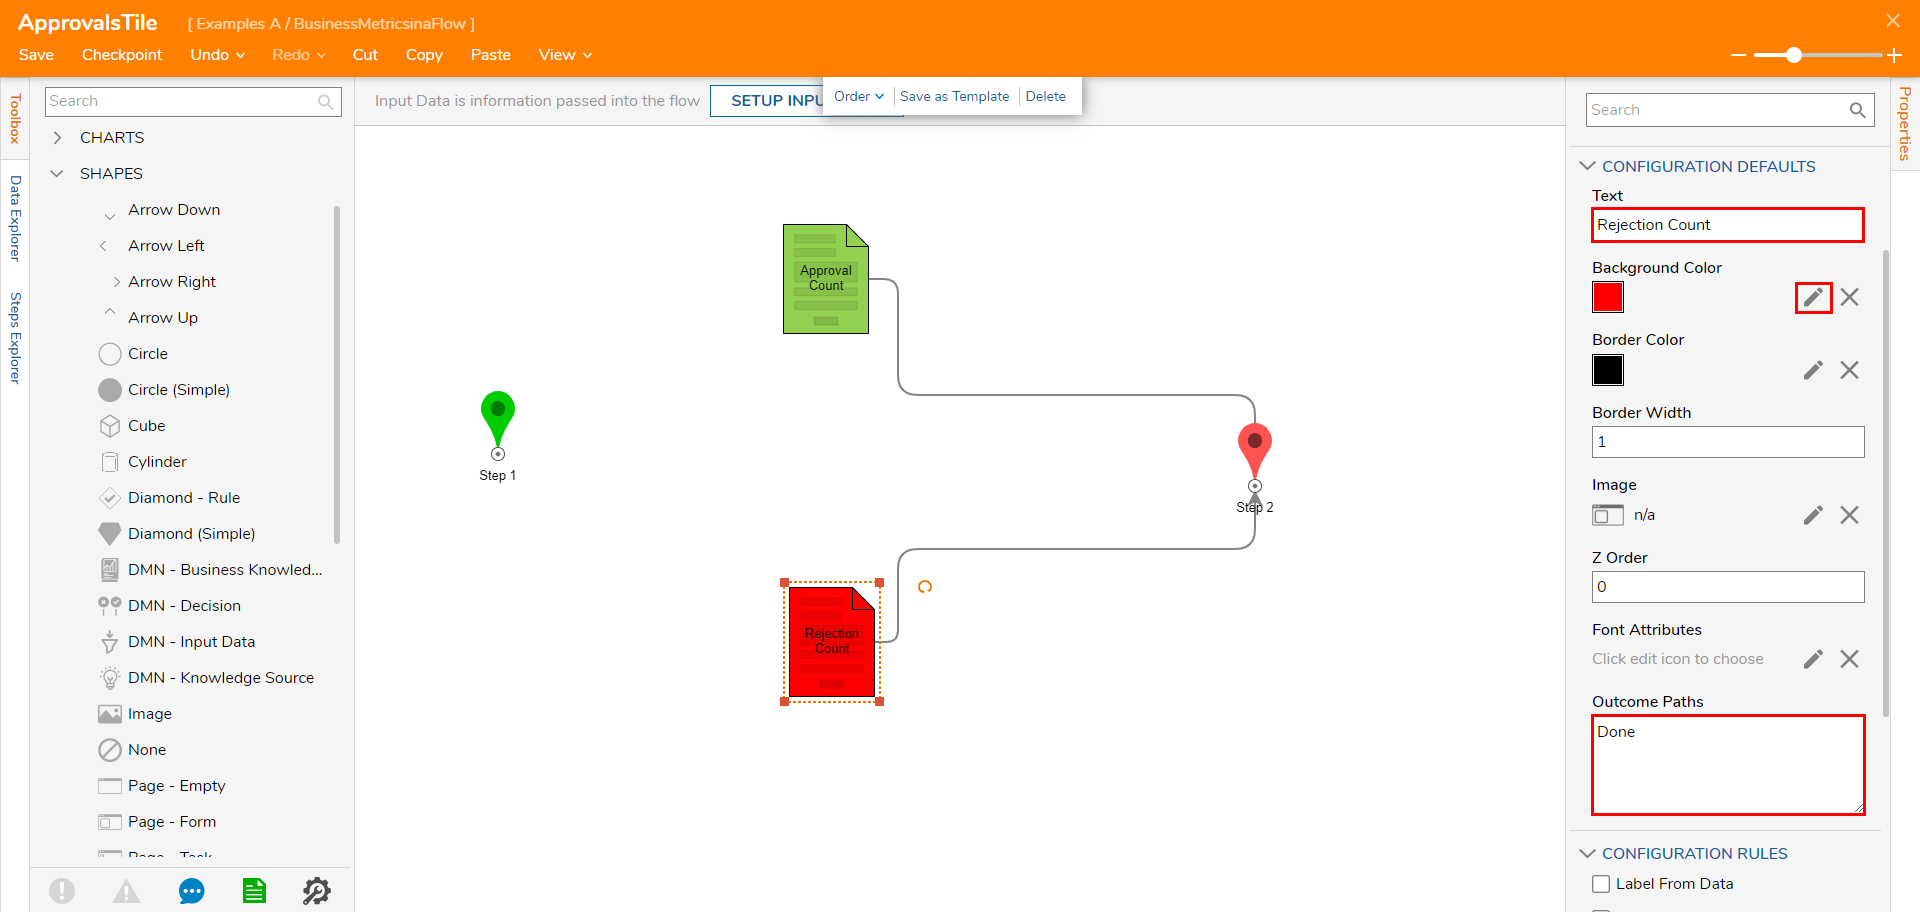
Repeat the process in step 17 on the other Page - Form Shape; this time map "Rejection Count" to Text, and provide a different Background Color.
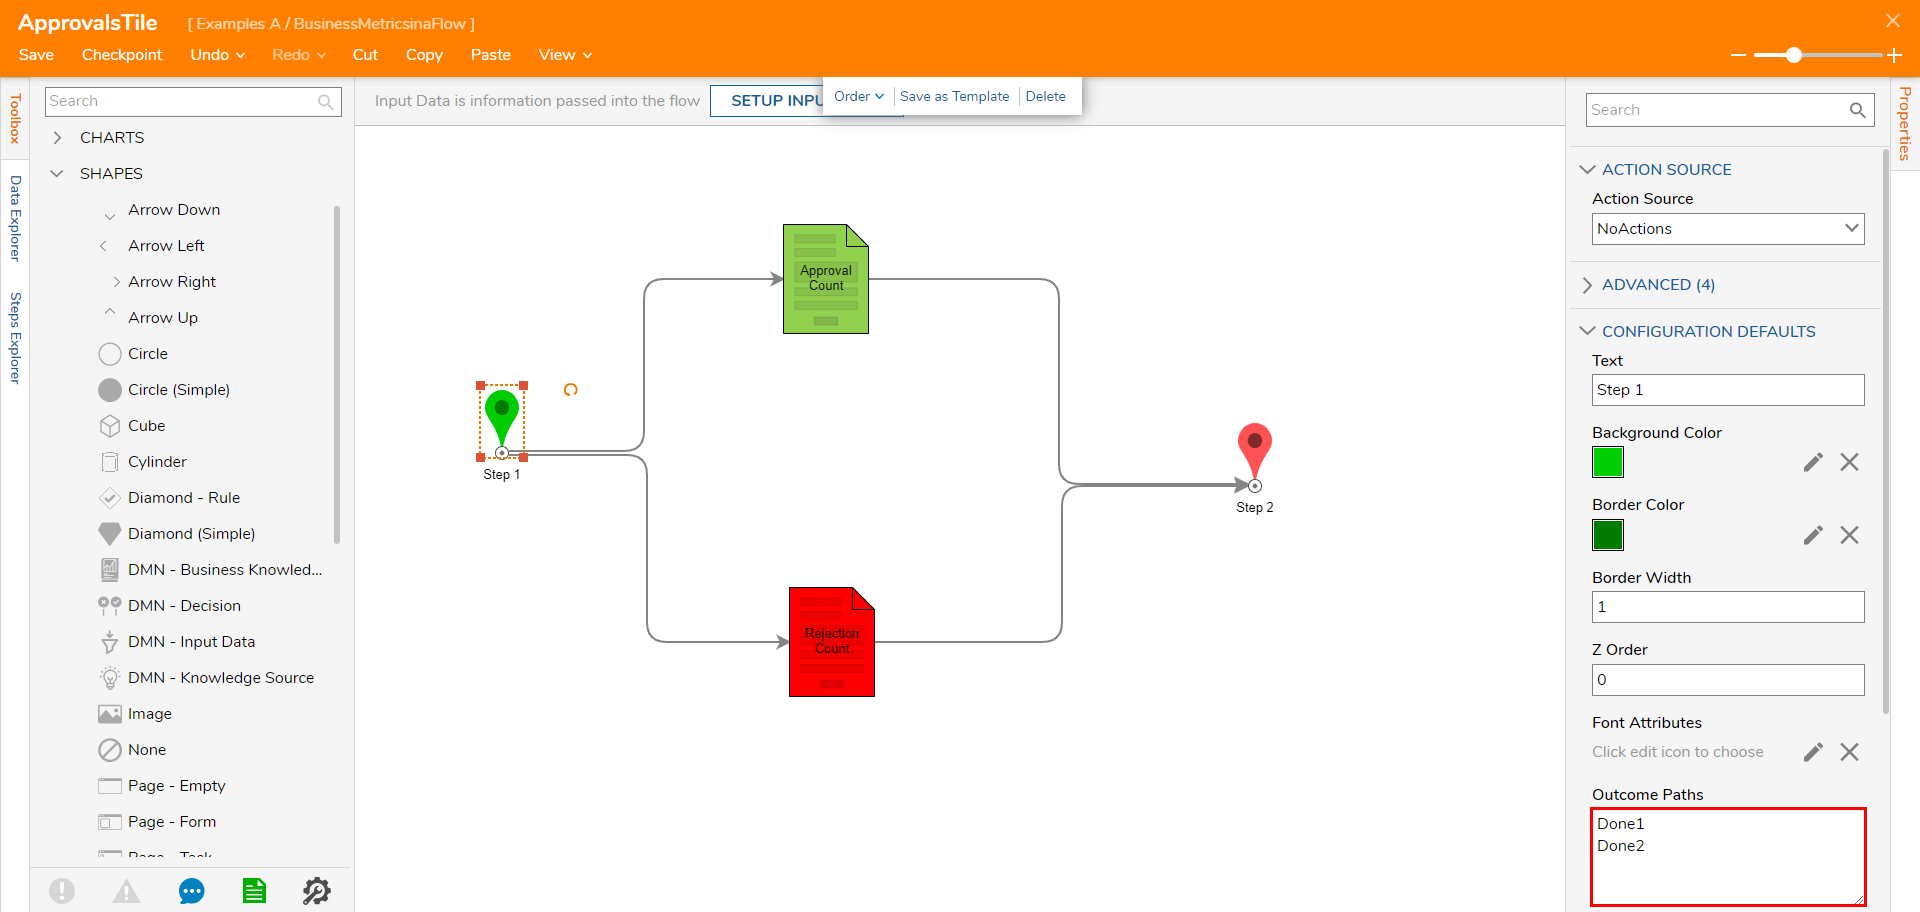
Select the Start step and provide two Outcome Paths. Map one to Approval Count, and the other to Rejection Count.
Navigate back to the Toolbox and expand the BUSINESS METRICS category, then expand LOANPROCESSING, APPROVALS, and REJECTIONS.
Drag the Count Metric overtop each respective Page - Form Shape.
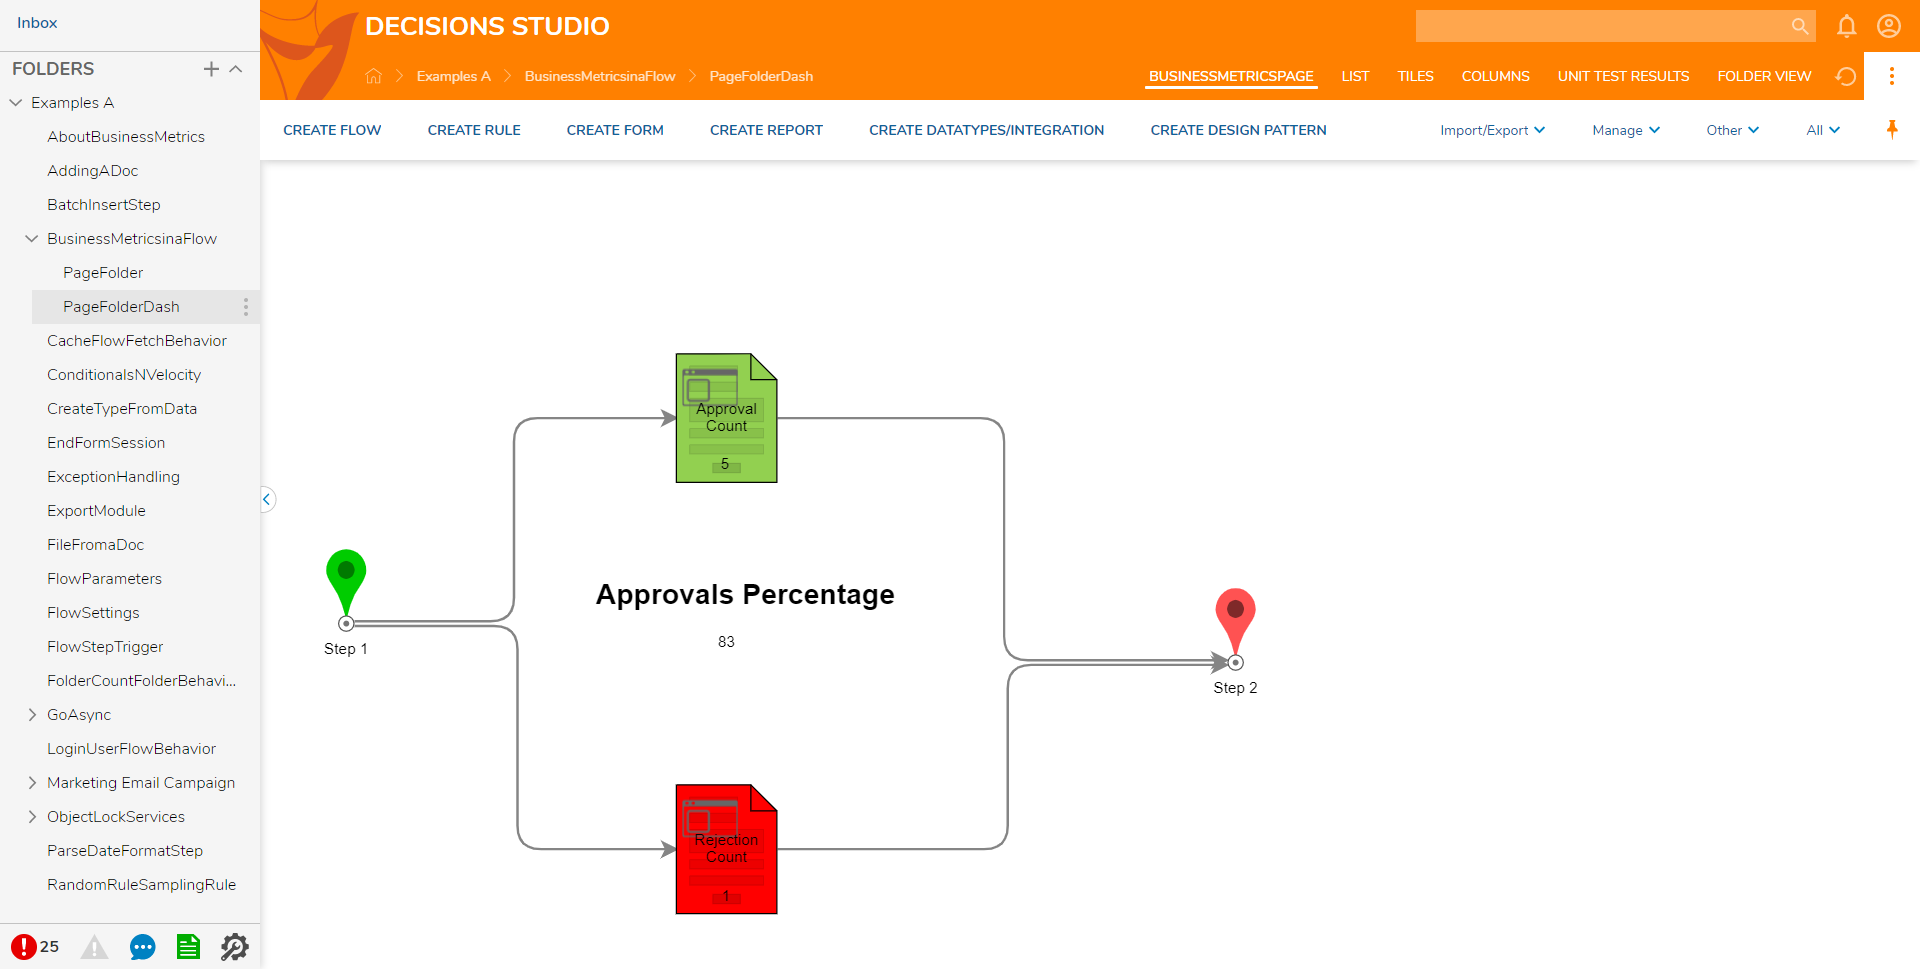
These Metrics will display the Counts for each Approval and Rejection on the Diagram Tile within the Page.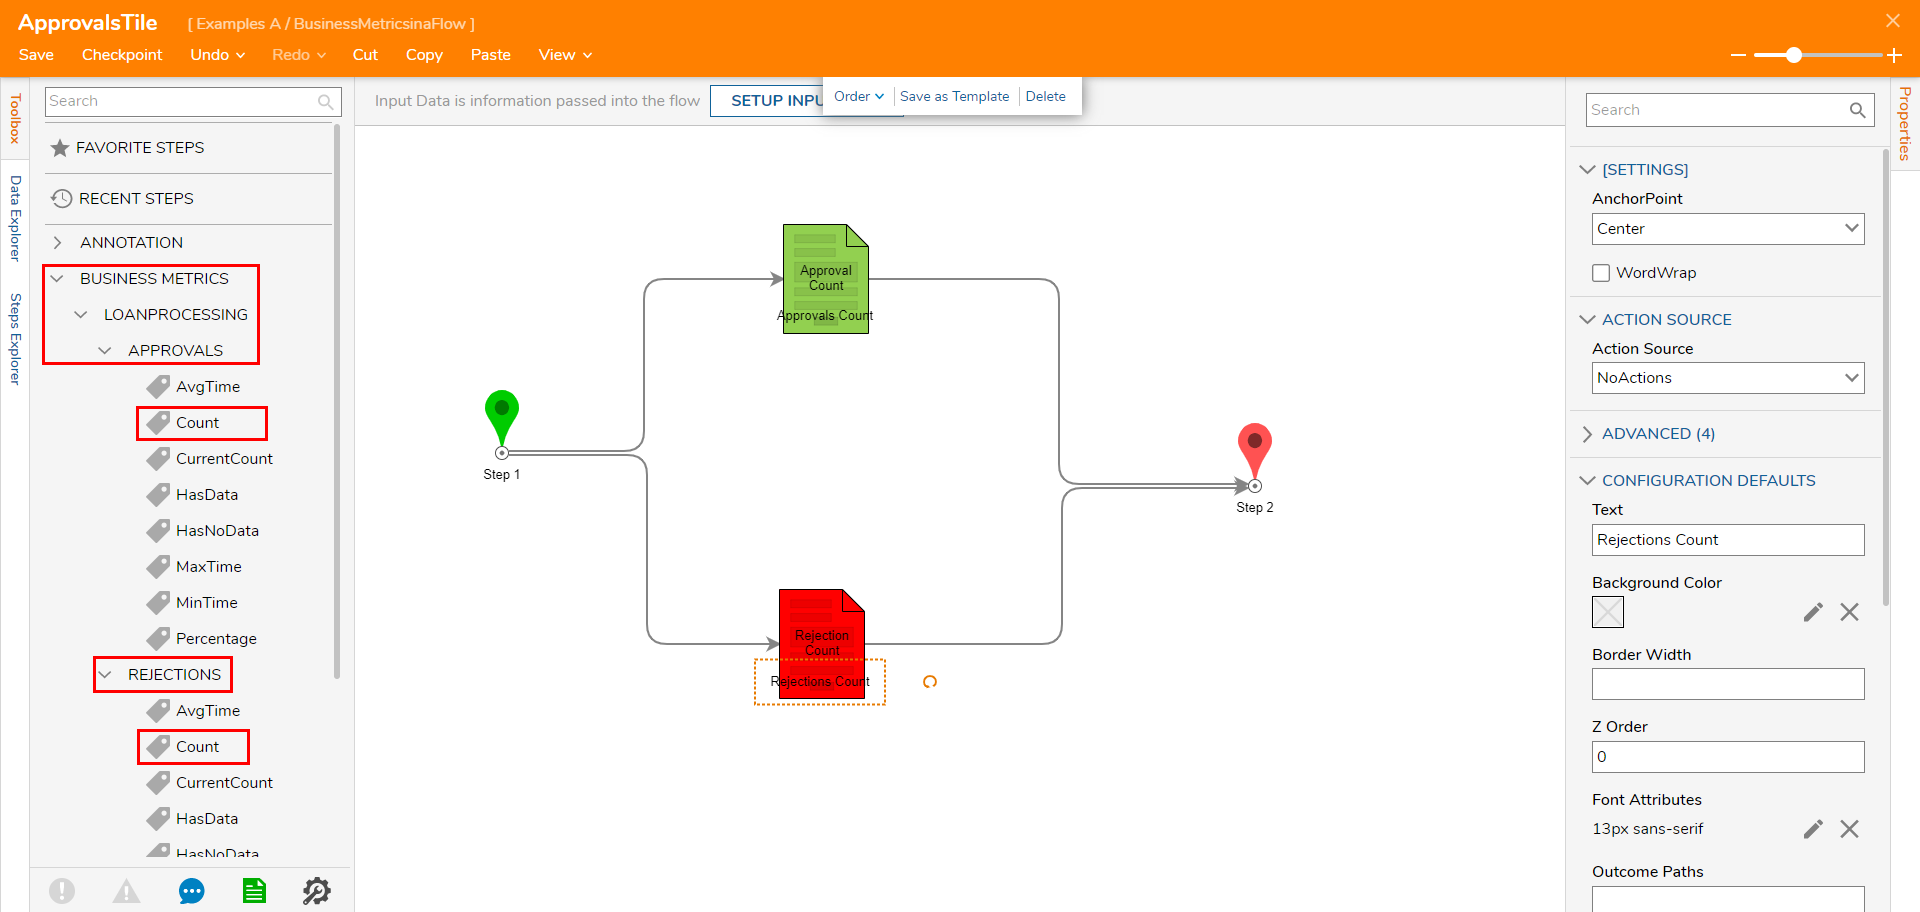
From BUSINESS METRICS > LOANPROCESSING > APPROVALS, drag Percentage in the blank space in the middle of the Flow.
The Approvals Percentage Metric will display the count of Approvals versus Rejections.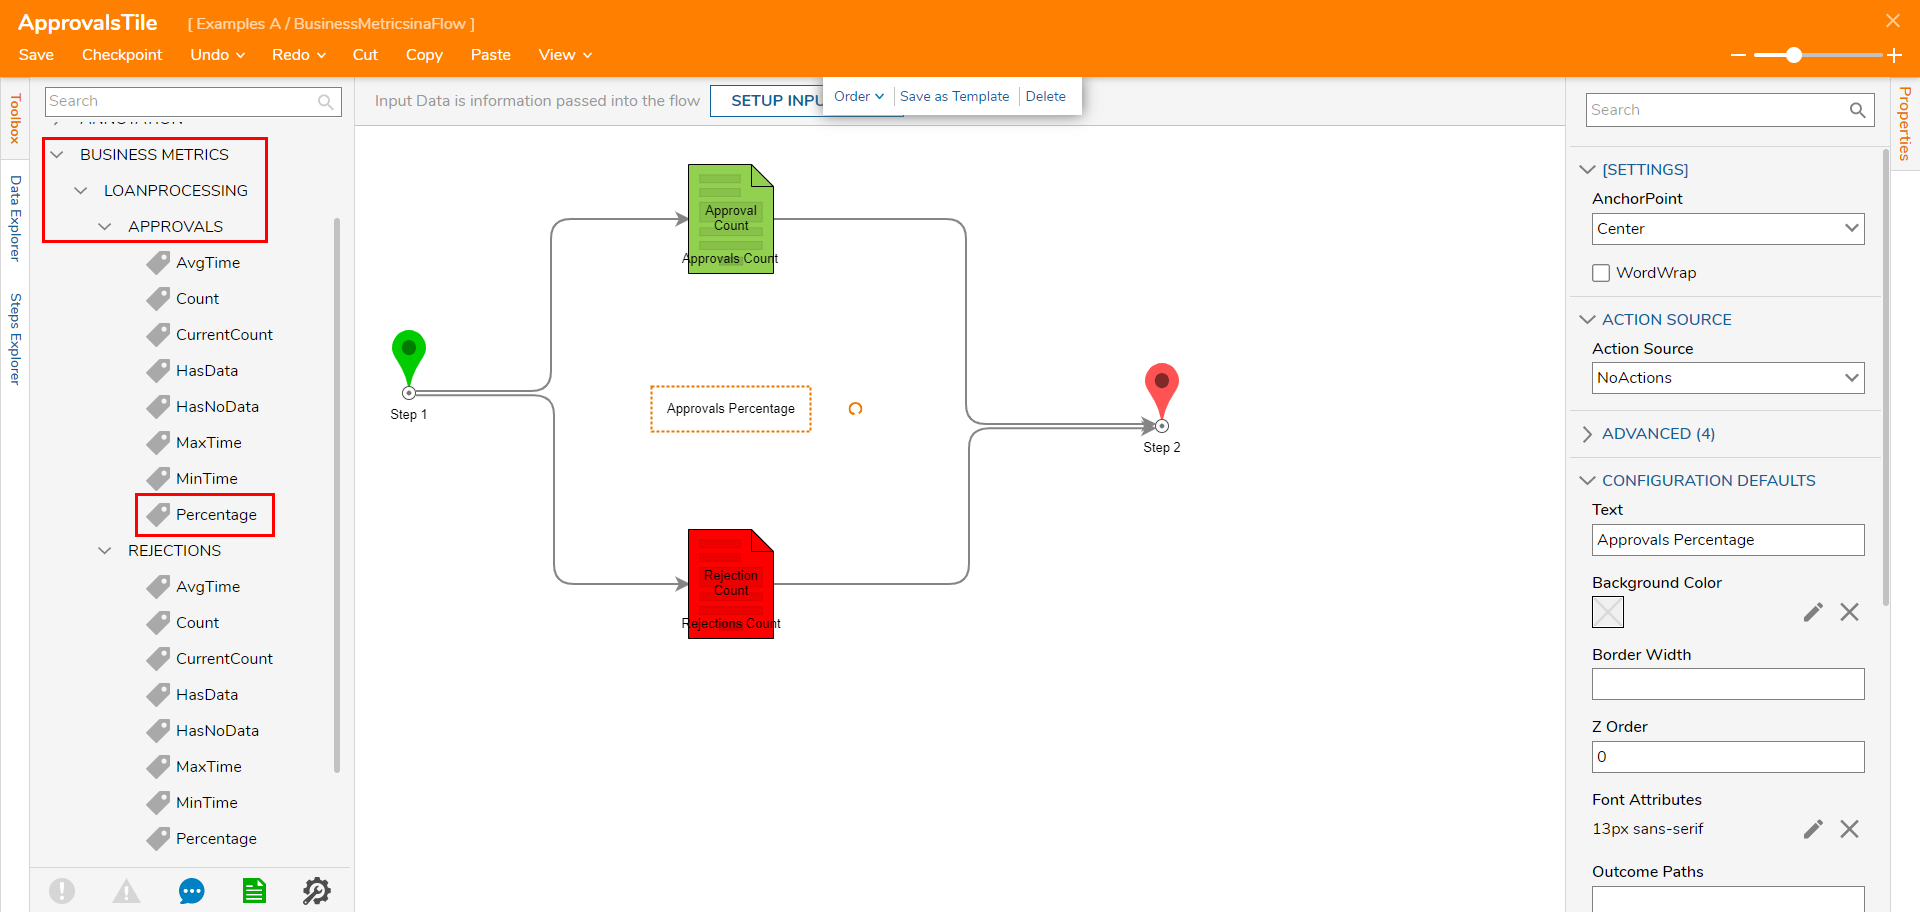
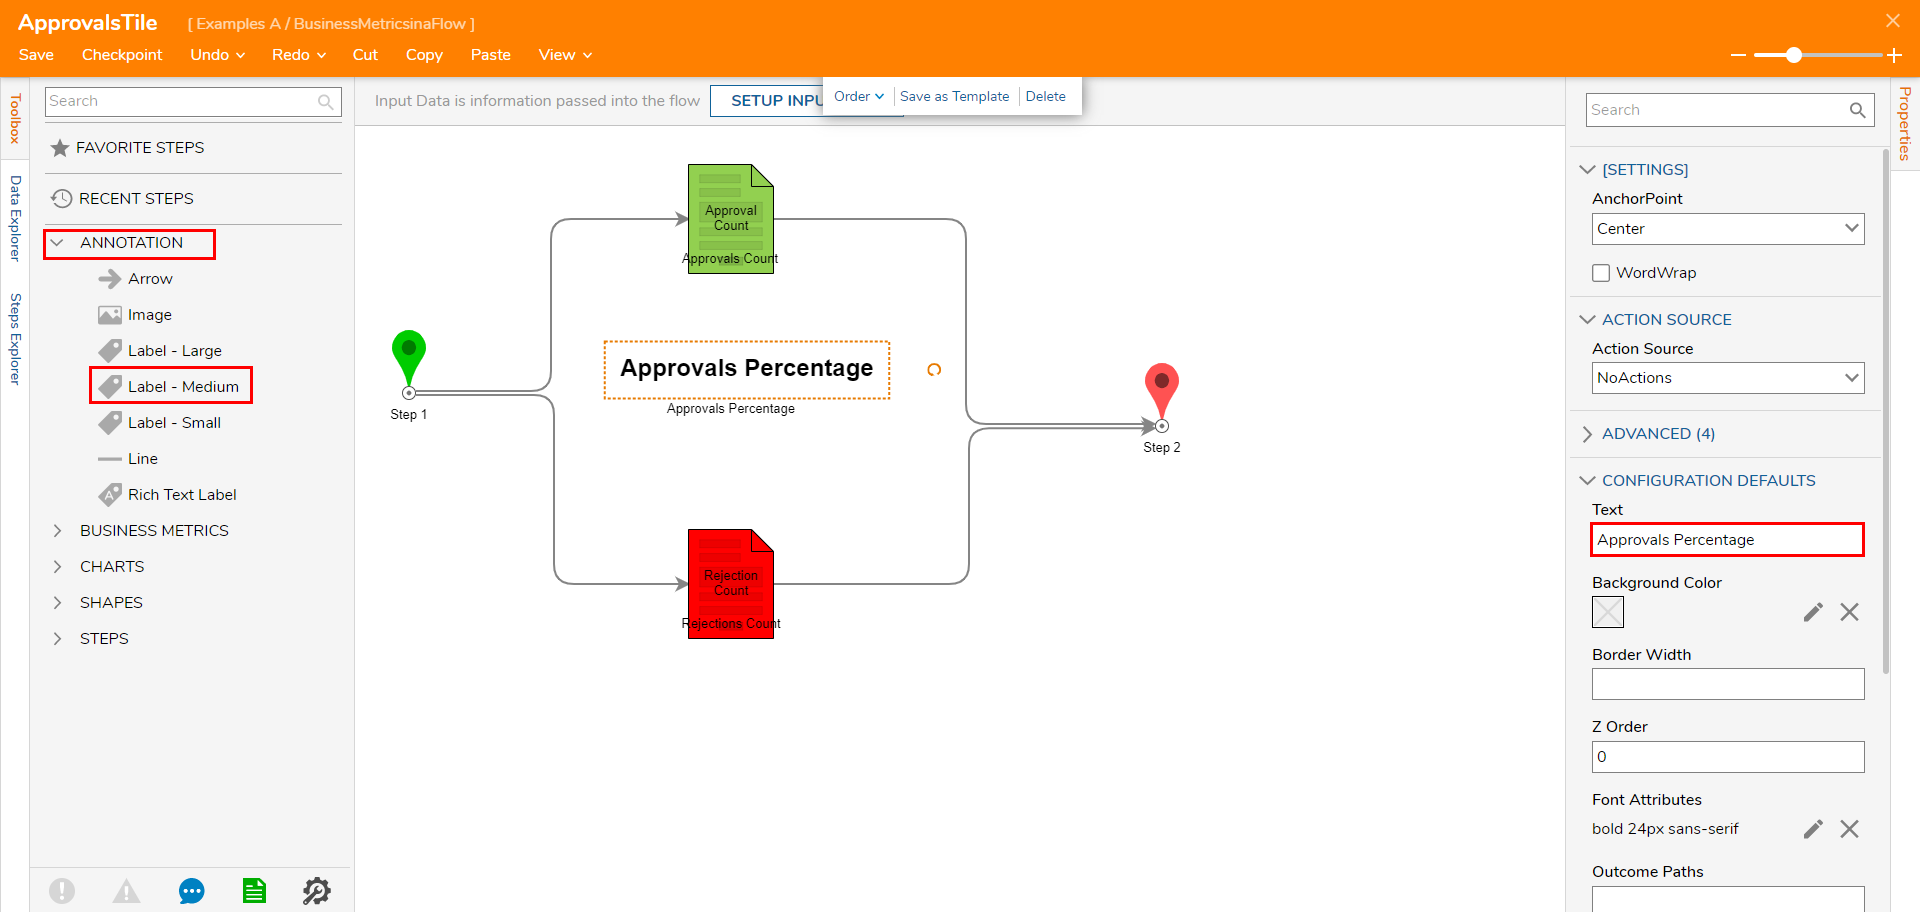
Under Toolbox > ANNOTATION, add a Label - Medium component next to the Approvals Percentage Metric; define its Text accordingly.
Save and close the Diagram Flow.
Save the Page, then close if desired.


Debug
- From Designer Project, Run the Business Metrics Flow making sure each time to select different paths.
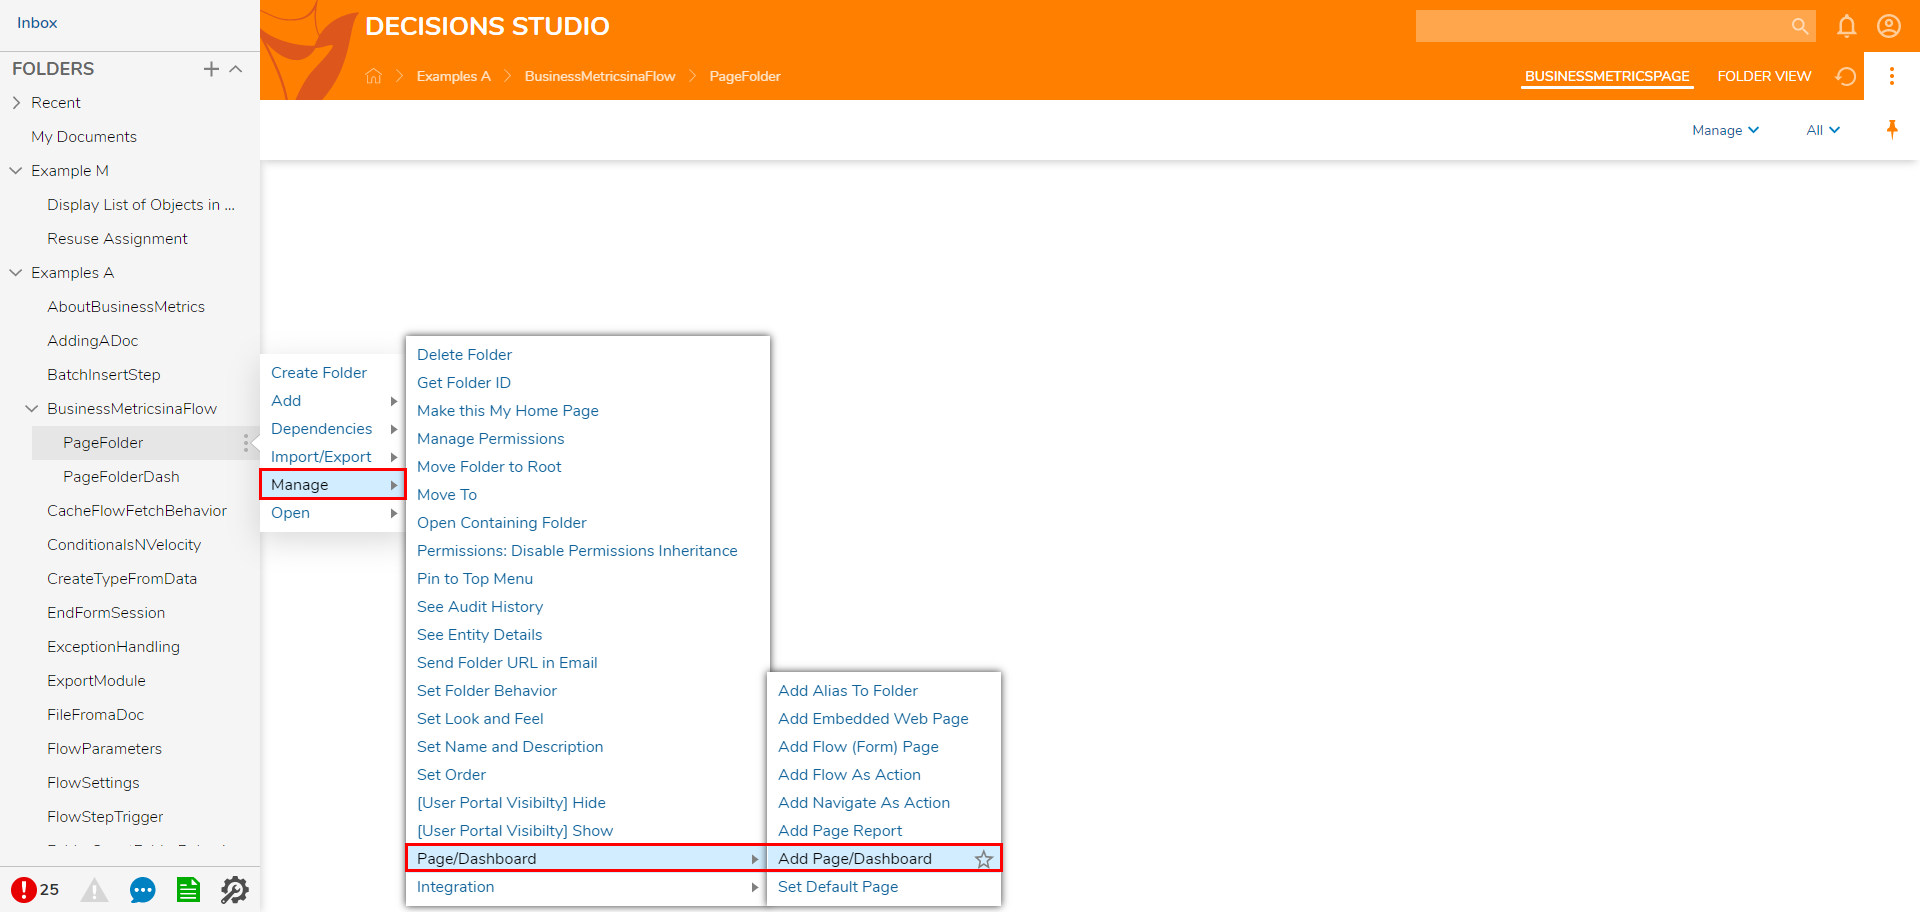
- Right-click a Designer Project and select Manage > Page/Dashboard > Add Page/Dashboard.
- Click PICK PAGE, and select the Page containing the Diagram Tile, then click SAVE.
- Navigate to the Designer Project containing the Business Metrics Page then navigate to its respective tab. The tab will display the Page containing the Diagram Tile containing the configured Business Metrics; the Approval and Rejection counts, and the Percentage of Approvals.


Was this article helpful?