Overview
A Page that contains two Reports can be configured to send data based on Row selection in the Parent Report to the Child Report for use as a filter. This allows the ability to view the information in the Child Report specific to a line item selected on the Parent Report.
This functionality can then be combined with the ability to add a Chart View and subsequently used to filter the contents of the Chart. The following document demonstrates how to use a Parent Report to filter the information displayed on its respective Child Report to display information about which Groups a selected Account belongs to.
Example
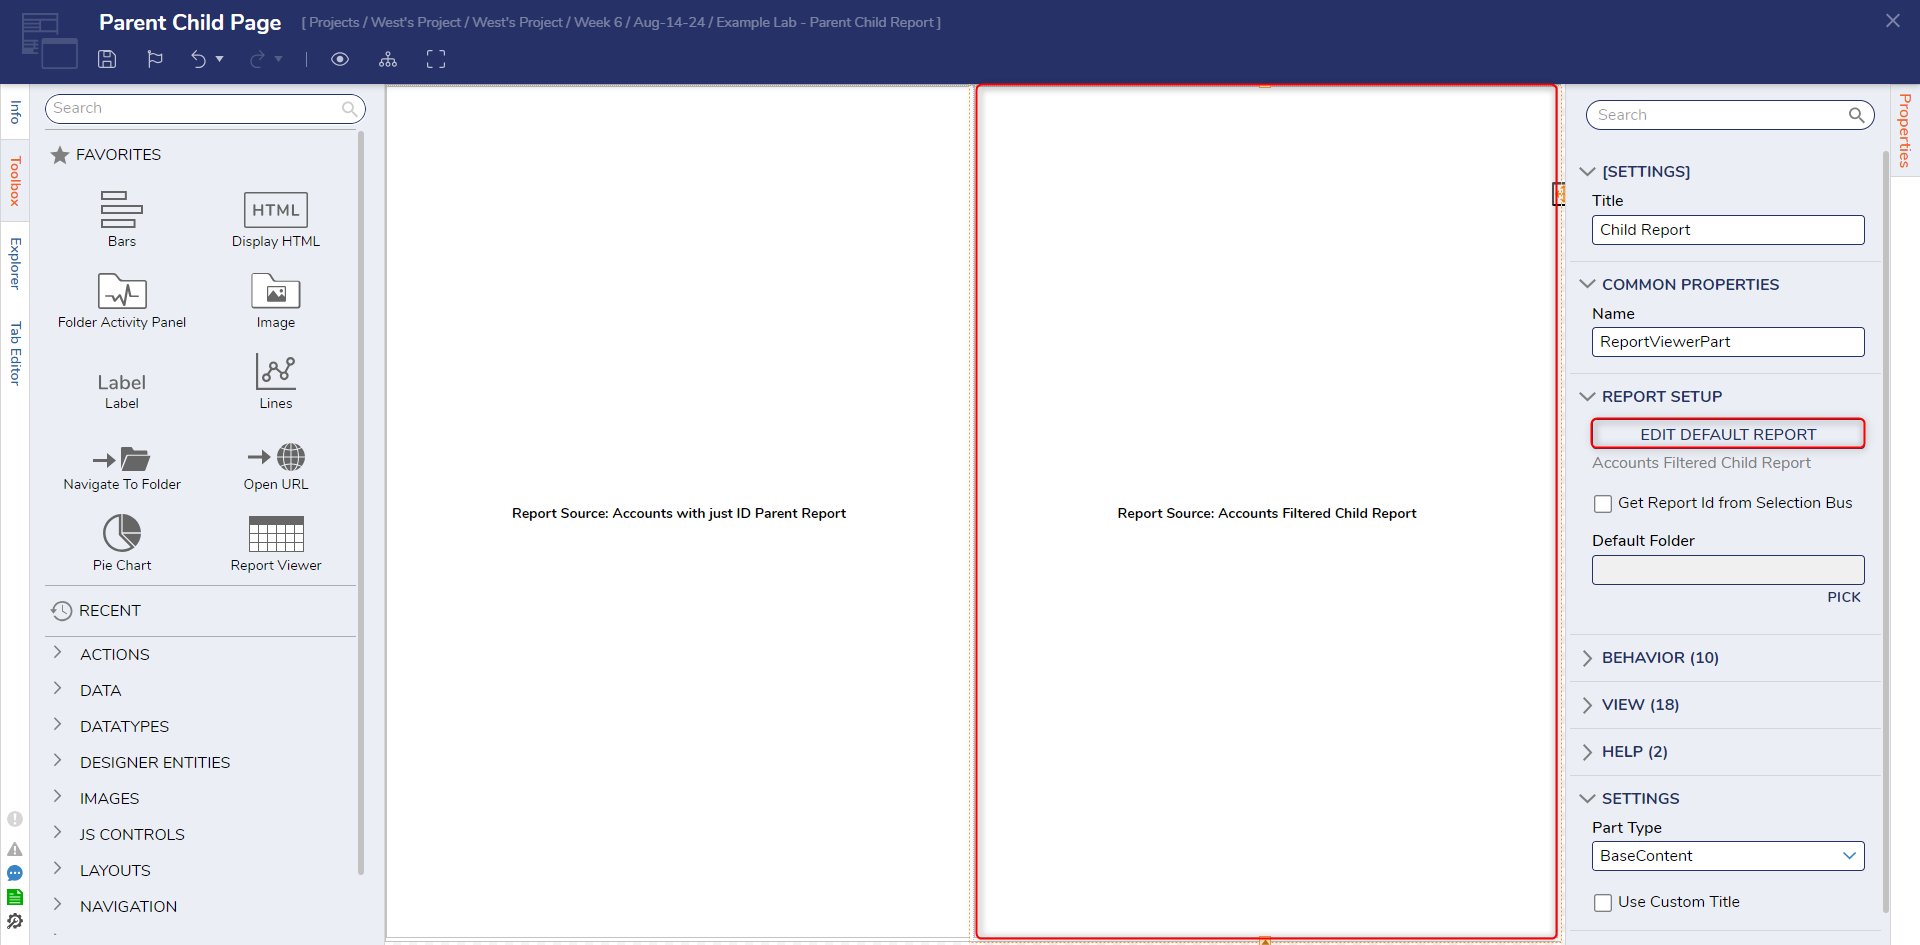
- Open a previously created Parent/Child Report. From the Page Designer, navigate to the Properties of the Report Viewer containing the Child Report, then click EDIT DEFAULT REPORT.
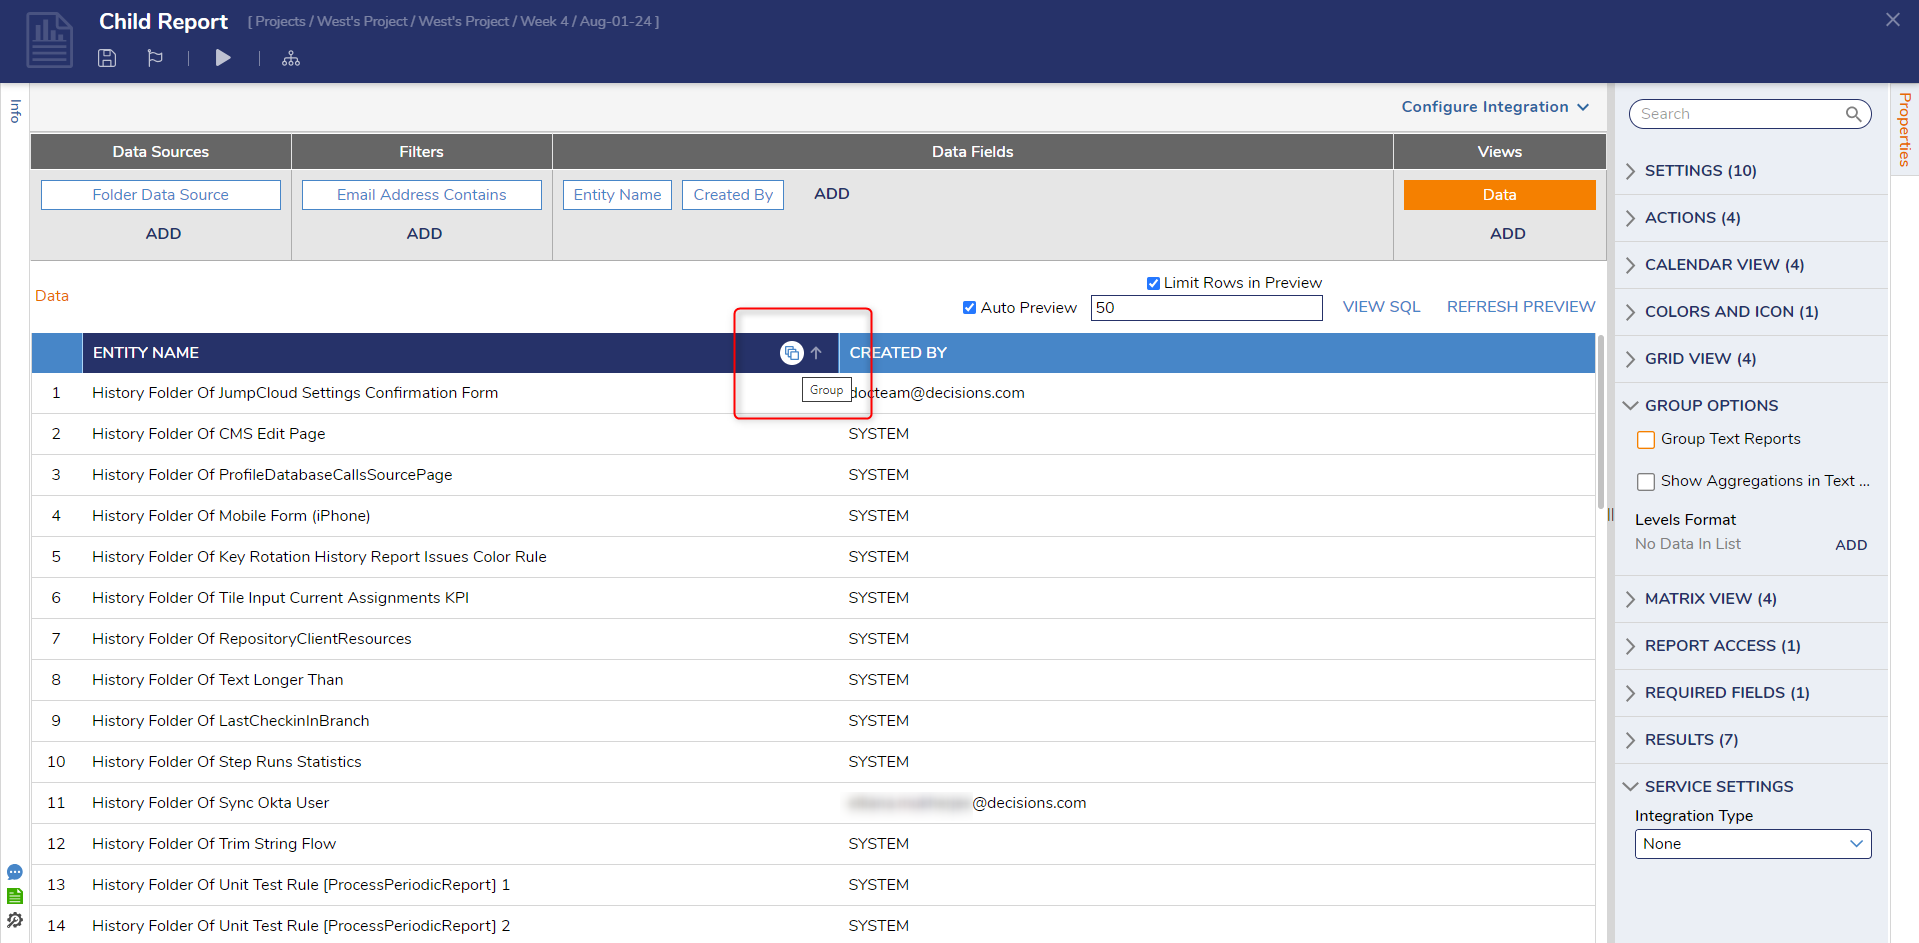
- From the Report Designer, select the row header, then pick the Group Icon
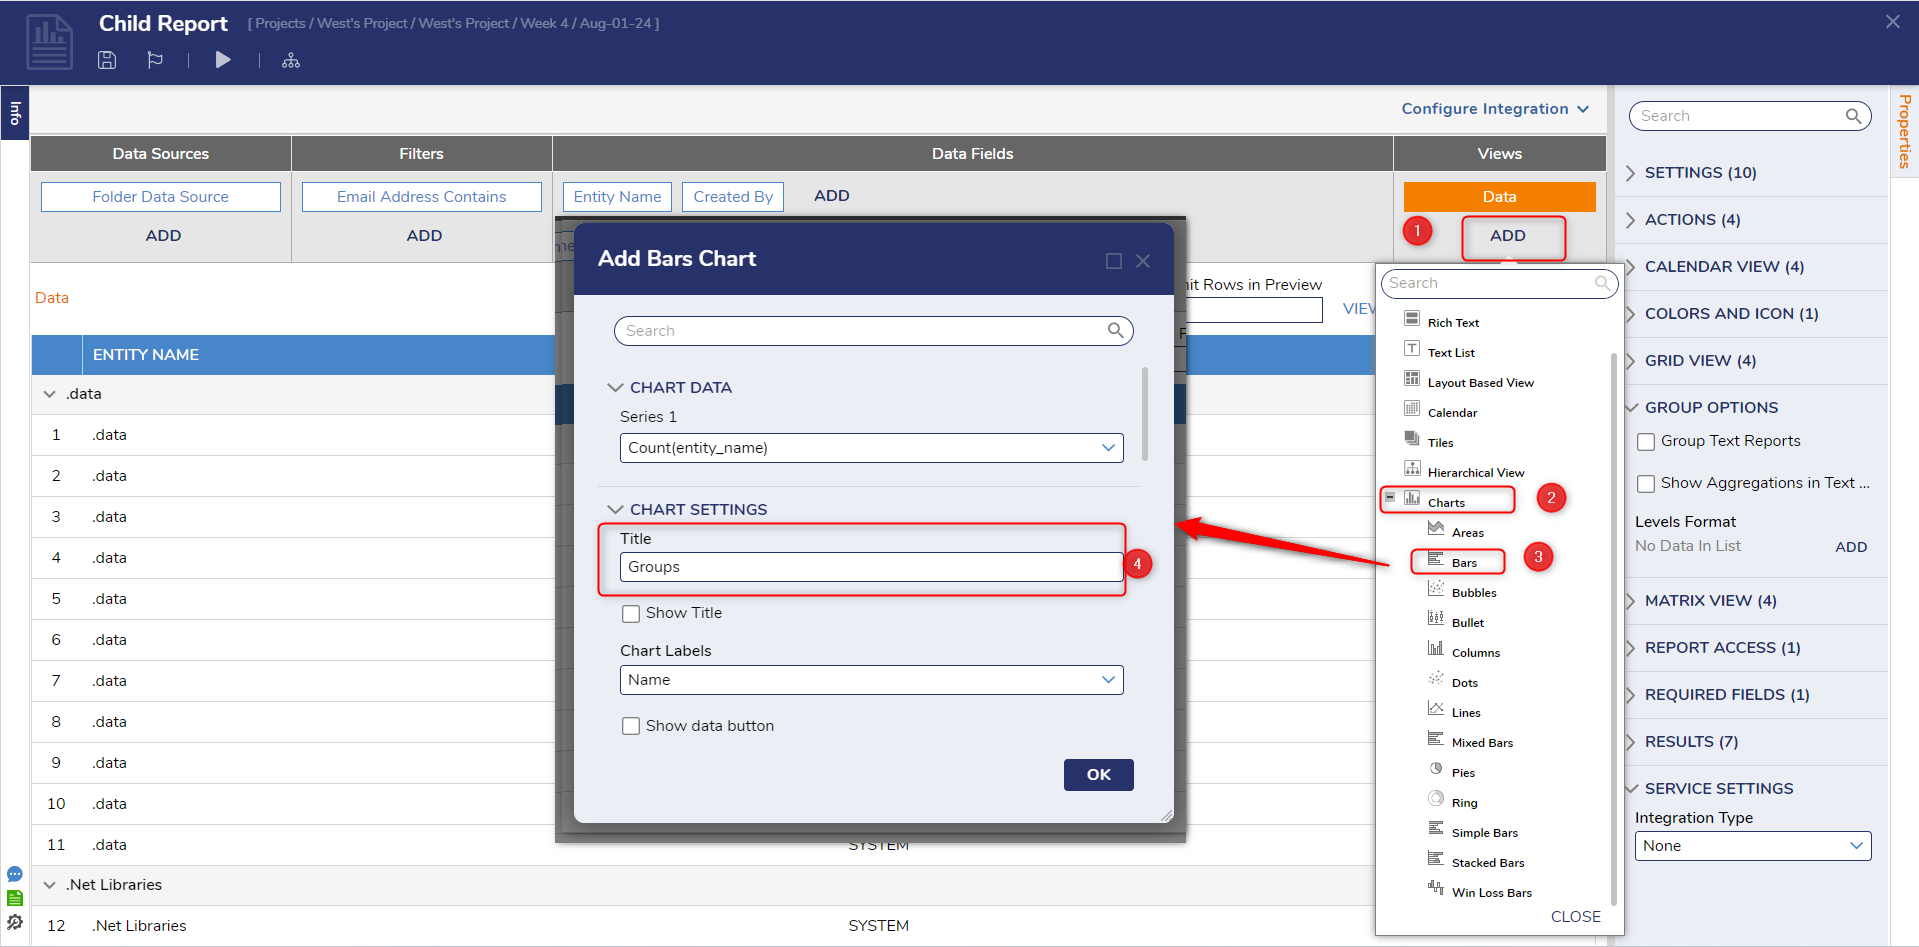
- Under Views, click Add. Then, under Charts, select Bars. From the Add Bars Chart window, provide the Title "Groups," then click OK.
- Save and Close the Report and Page Designers.
- Back in the Designer Folder containing the Page, Add the page to the Public Folder.
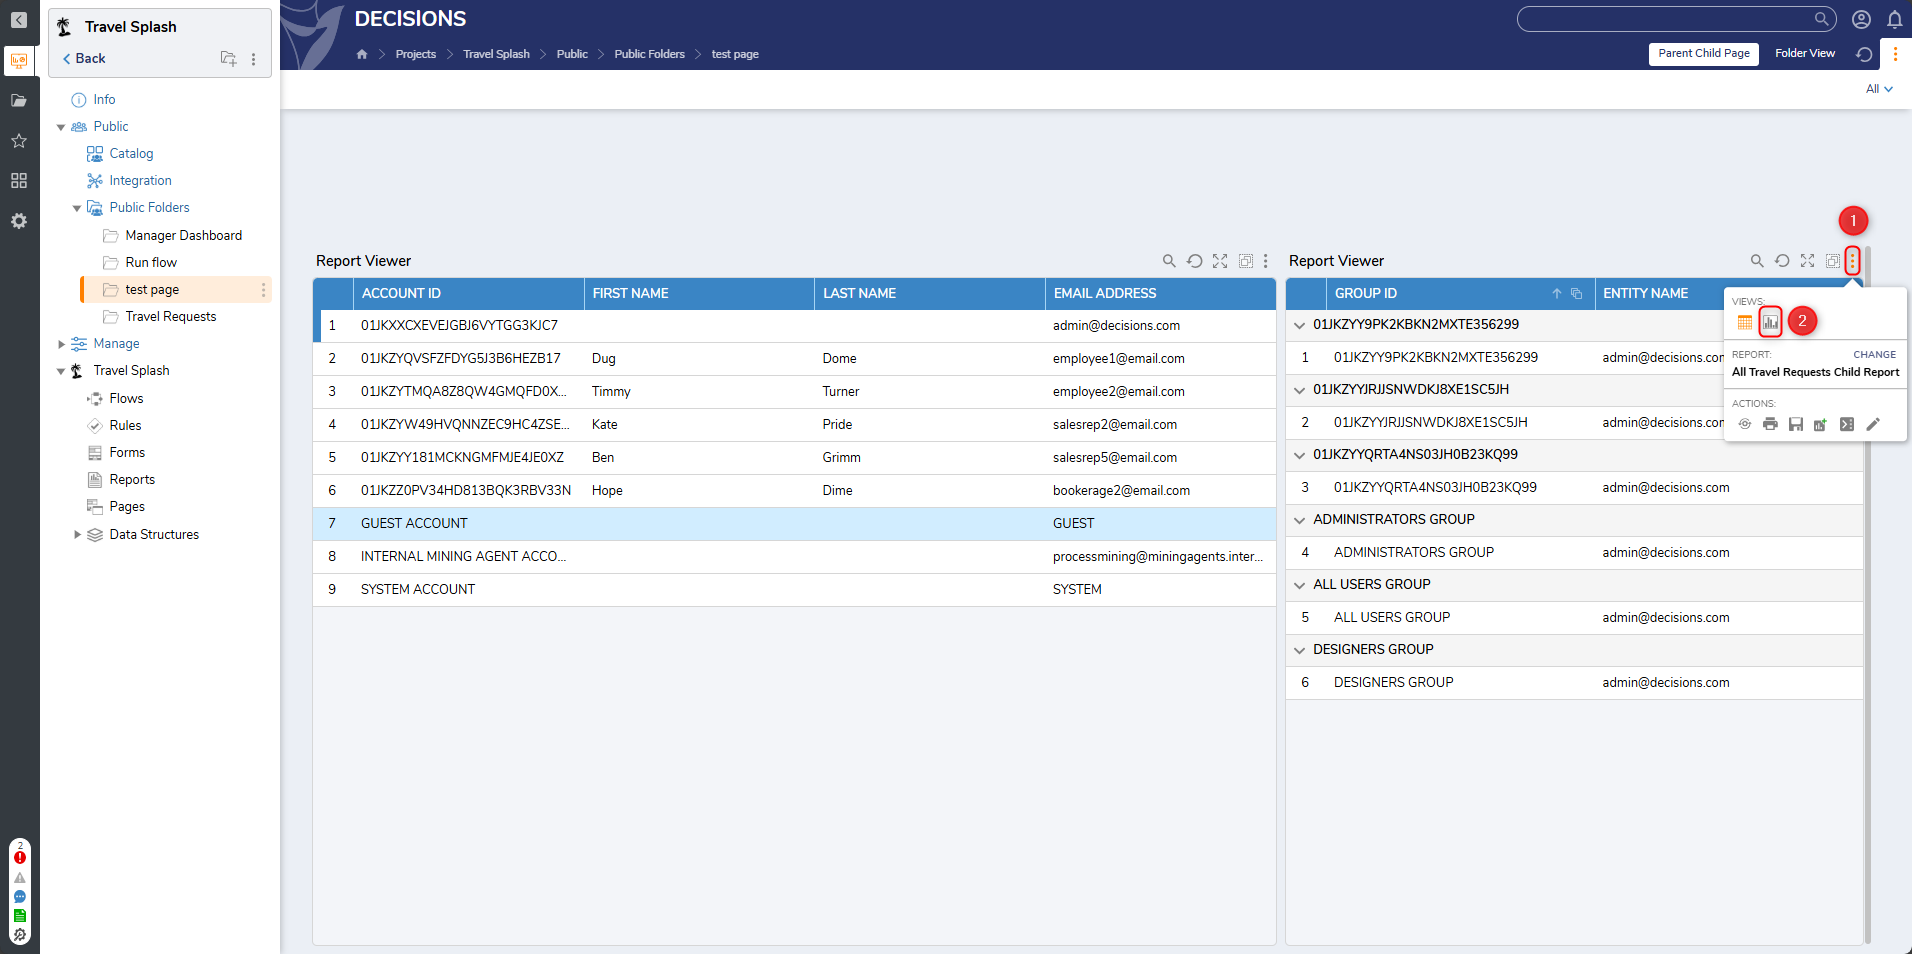
- Open the Page and select the Setting (Action Menu), icon on the Child Report and change the View from Data to Bars. PrviewAny dynamic data may not display or reflect properly within the preview window. It is advised to test these changes within an active page or folder.
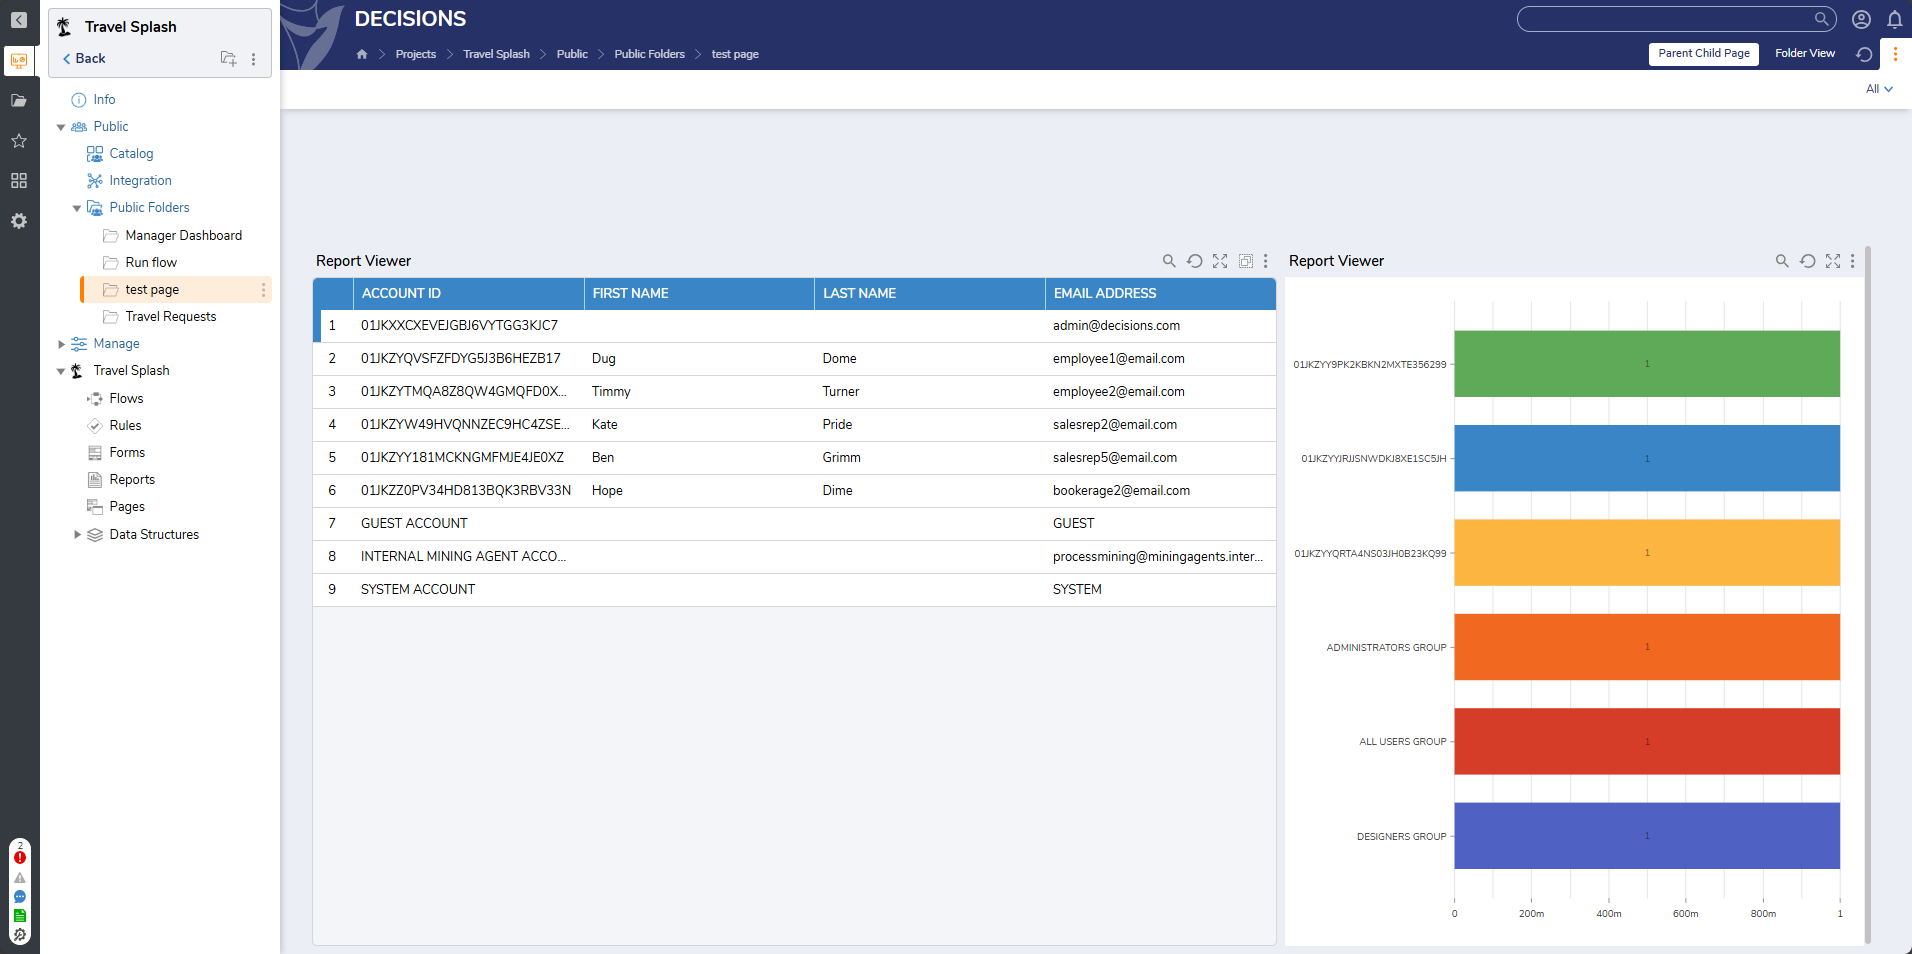
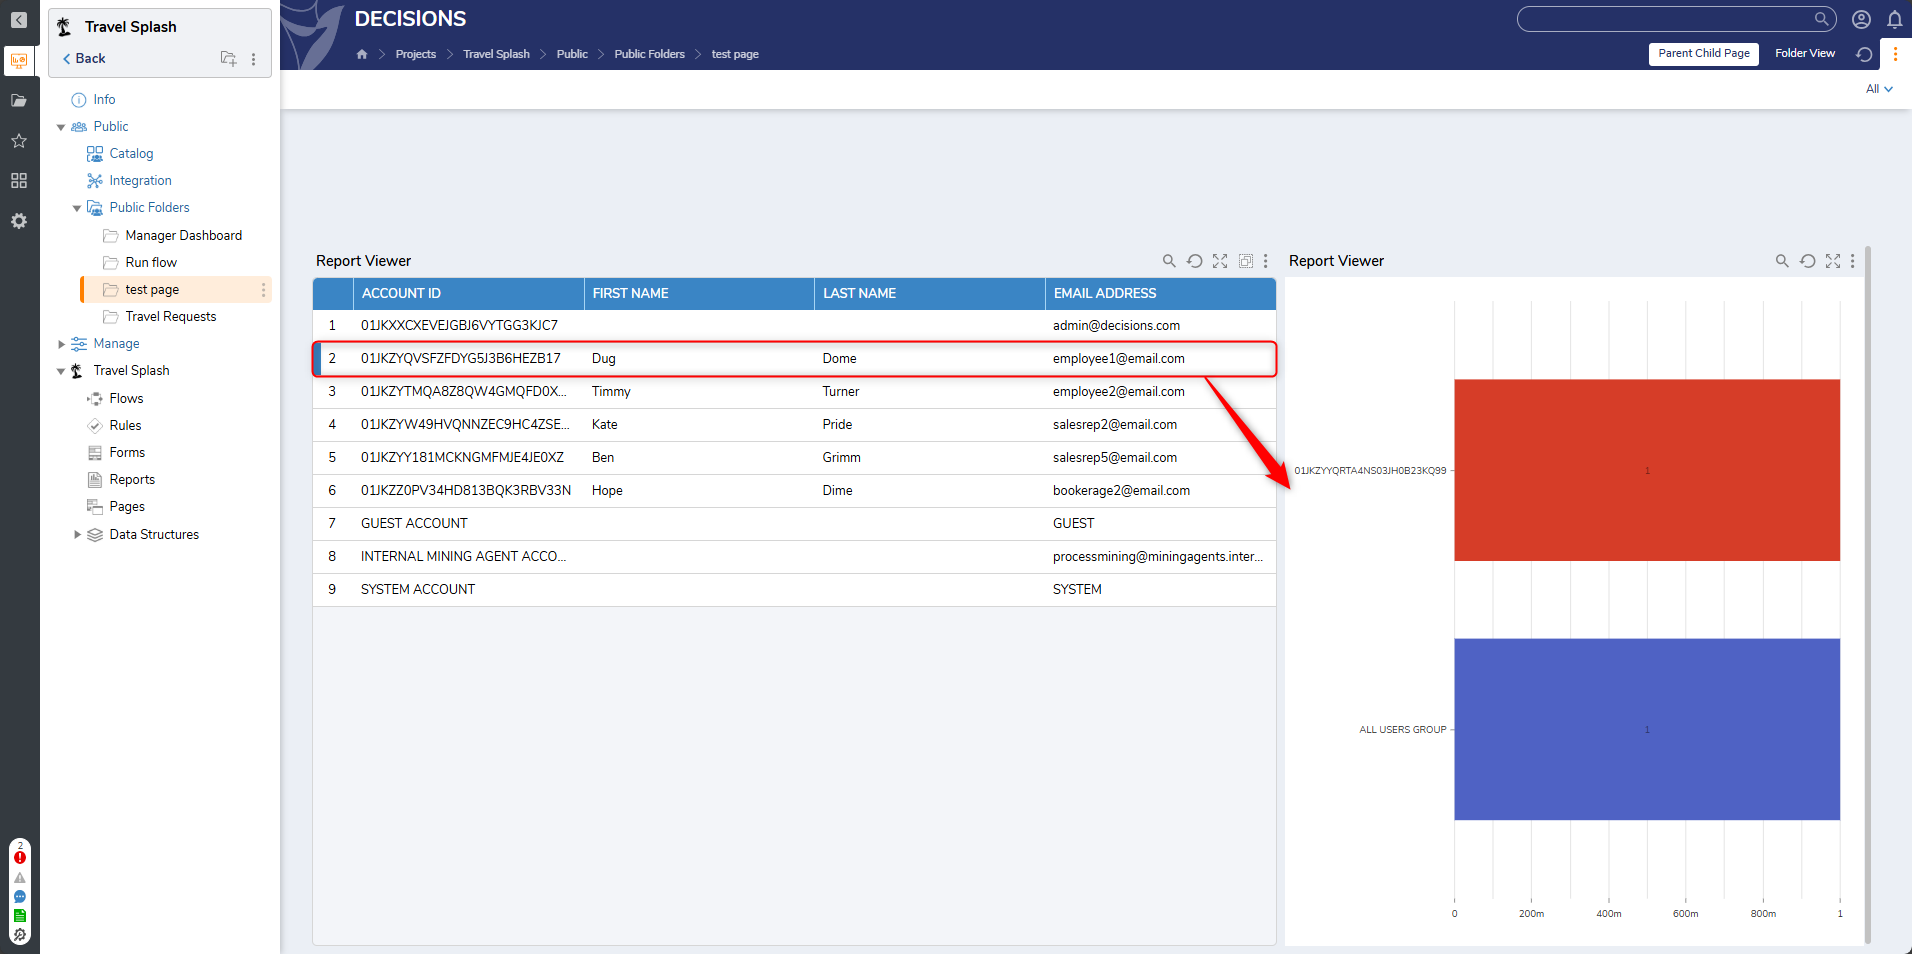
- Click different Accounts listed in the Parent Report and verify that the Child Report's Bar Chart changes to display the corresponding Groups associated with the selected Account.
For further information on Reports, visit the Decisions Forum.