Overview
Process Mining is a fully featured Object-Centric Process Mining platform. It allows the merging and reorganization of logs using multiple attributes as case IDs, as well as the association of a single event with multiple objects. The platform has numerous visualization options to view data from different perspectives so that Users can draw the best insights from them.
Logs work best with event-driven data, or data that has a time stamp and can be tracked.
Importing Logs
Like any other file, Logs are imported from the Import/Export menu at the top of the page.
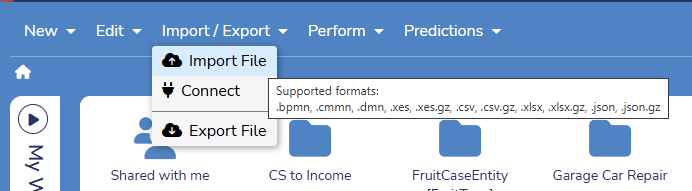
If importing a CSV file, select NO when asked if it is to be used to train a predictive model.
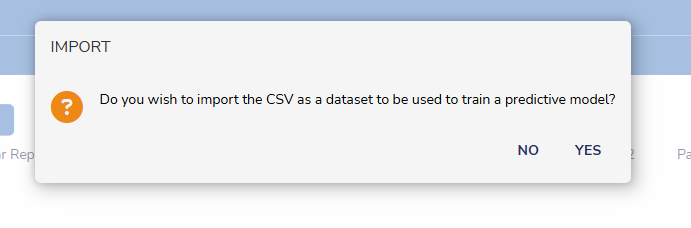
Attributes will need to be set. Case ID and Activity must be set to proceed. For more on the import process, please refer to Importing/Exporting Process Mining Data.
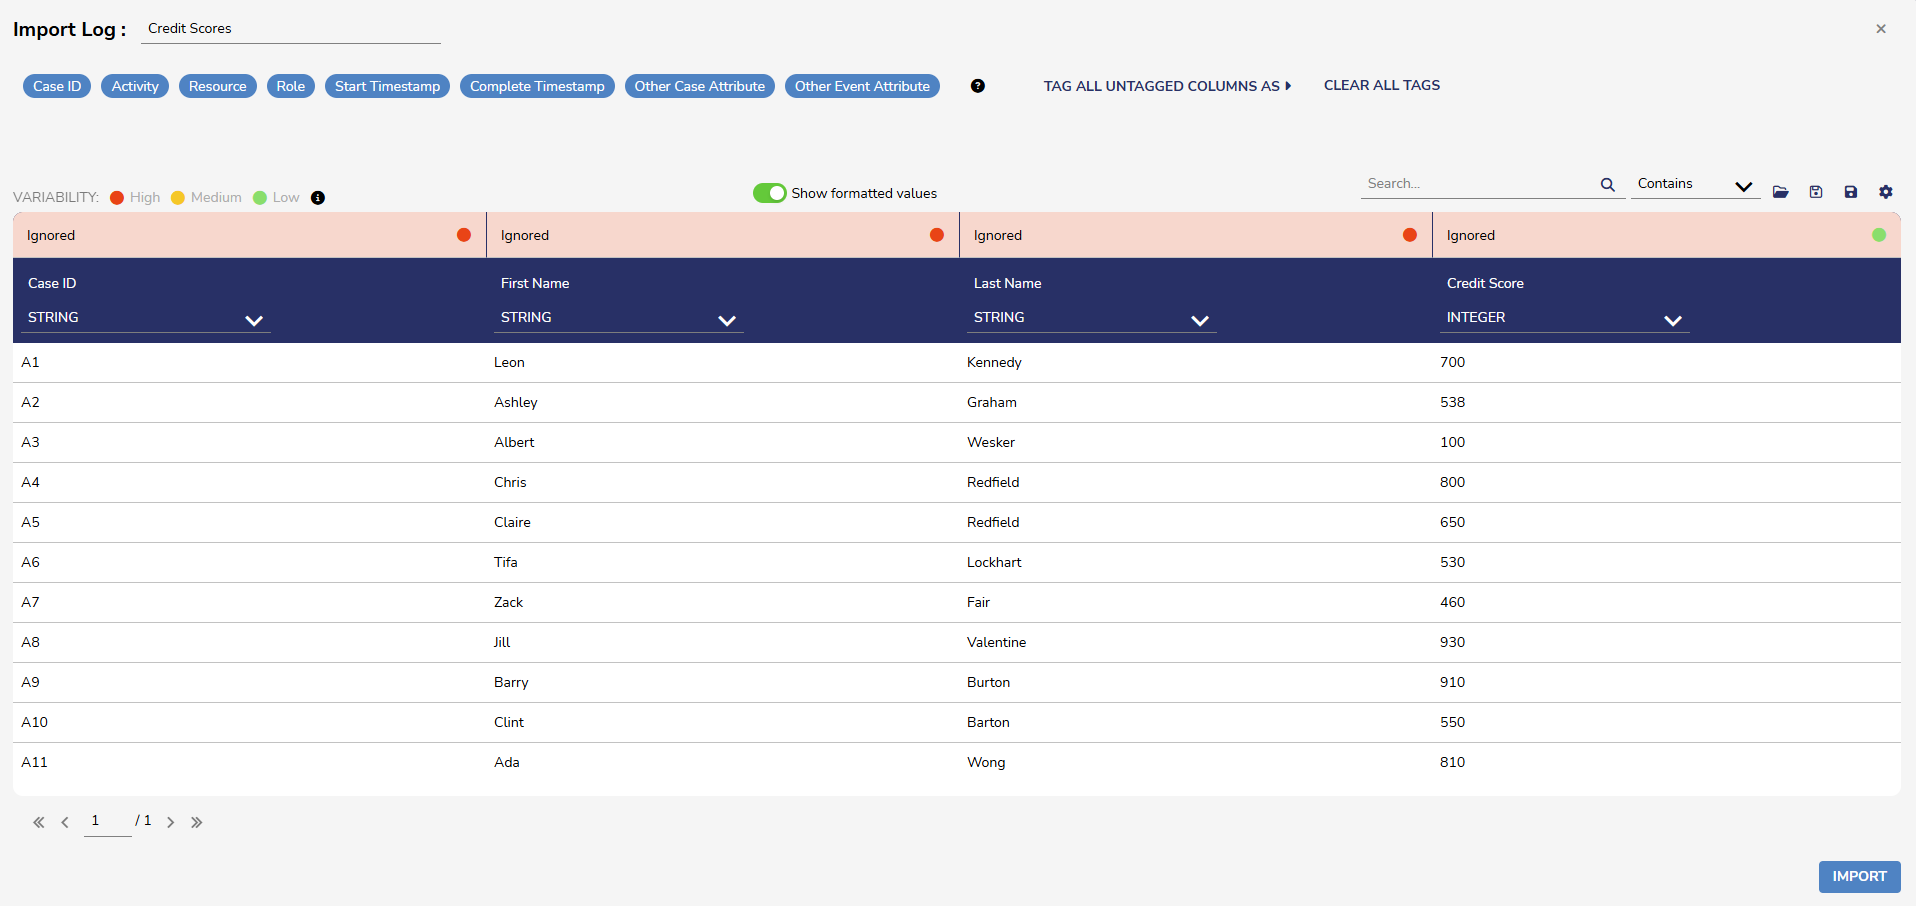
The imported Log will have an icon like this:
You can right-click on the Log to get more details about it.
Editing/Reorganizing Logs
Users can edit logs based on different attributes, such as a CaseID. Once the log is edited, a new log will be created and will reflect the new changes.
All Decisions logs and views can be edited. The following file types are supported:
- XES
- CSV
- XES.GZ
- CSV.GZ
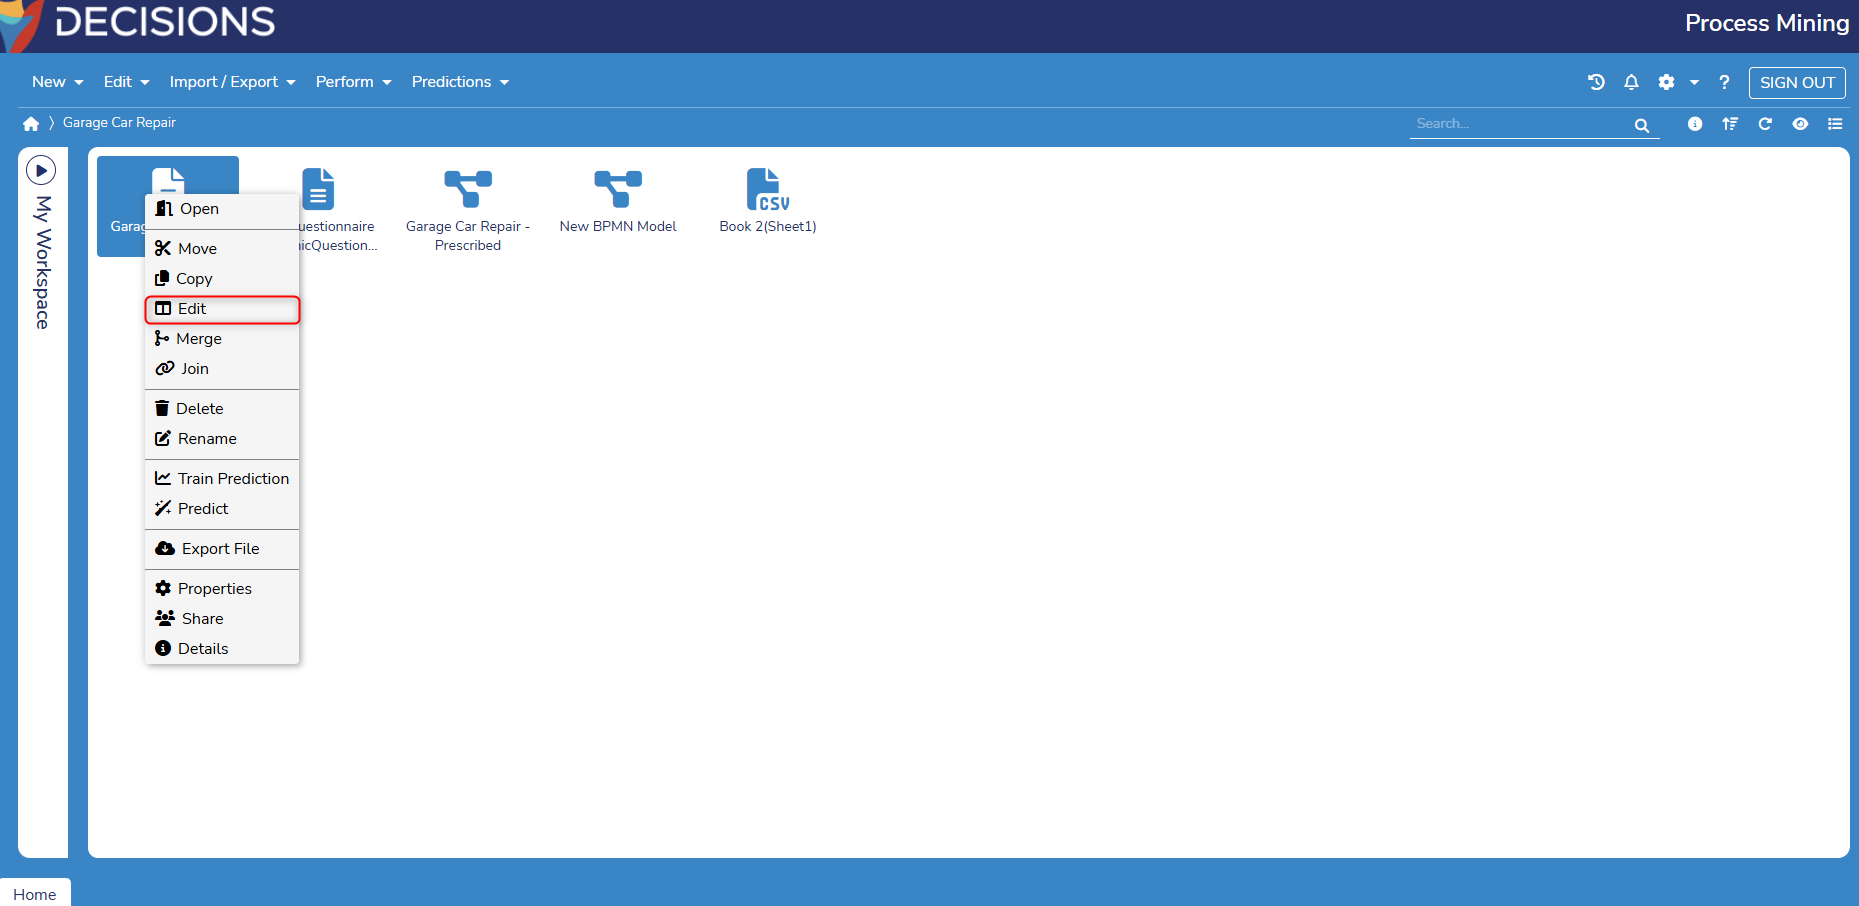
To edit a log:
- Right-click on the log in Process Mining and select Edit.
- A window to edit the log will only display if one log is selected.
- A window to edit the log will only display if one log is selected.
- From here, the log will list each attribute with a dedicated row. Attributes will be listed with their current name and type, as editable text or combo boxes.
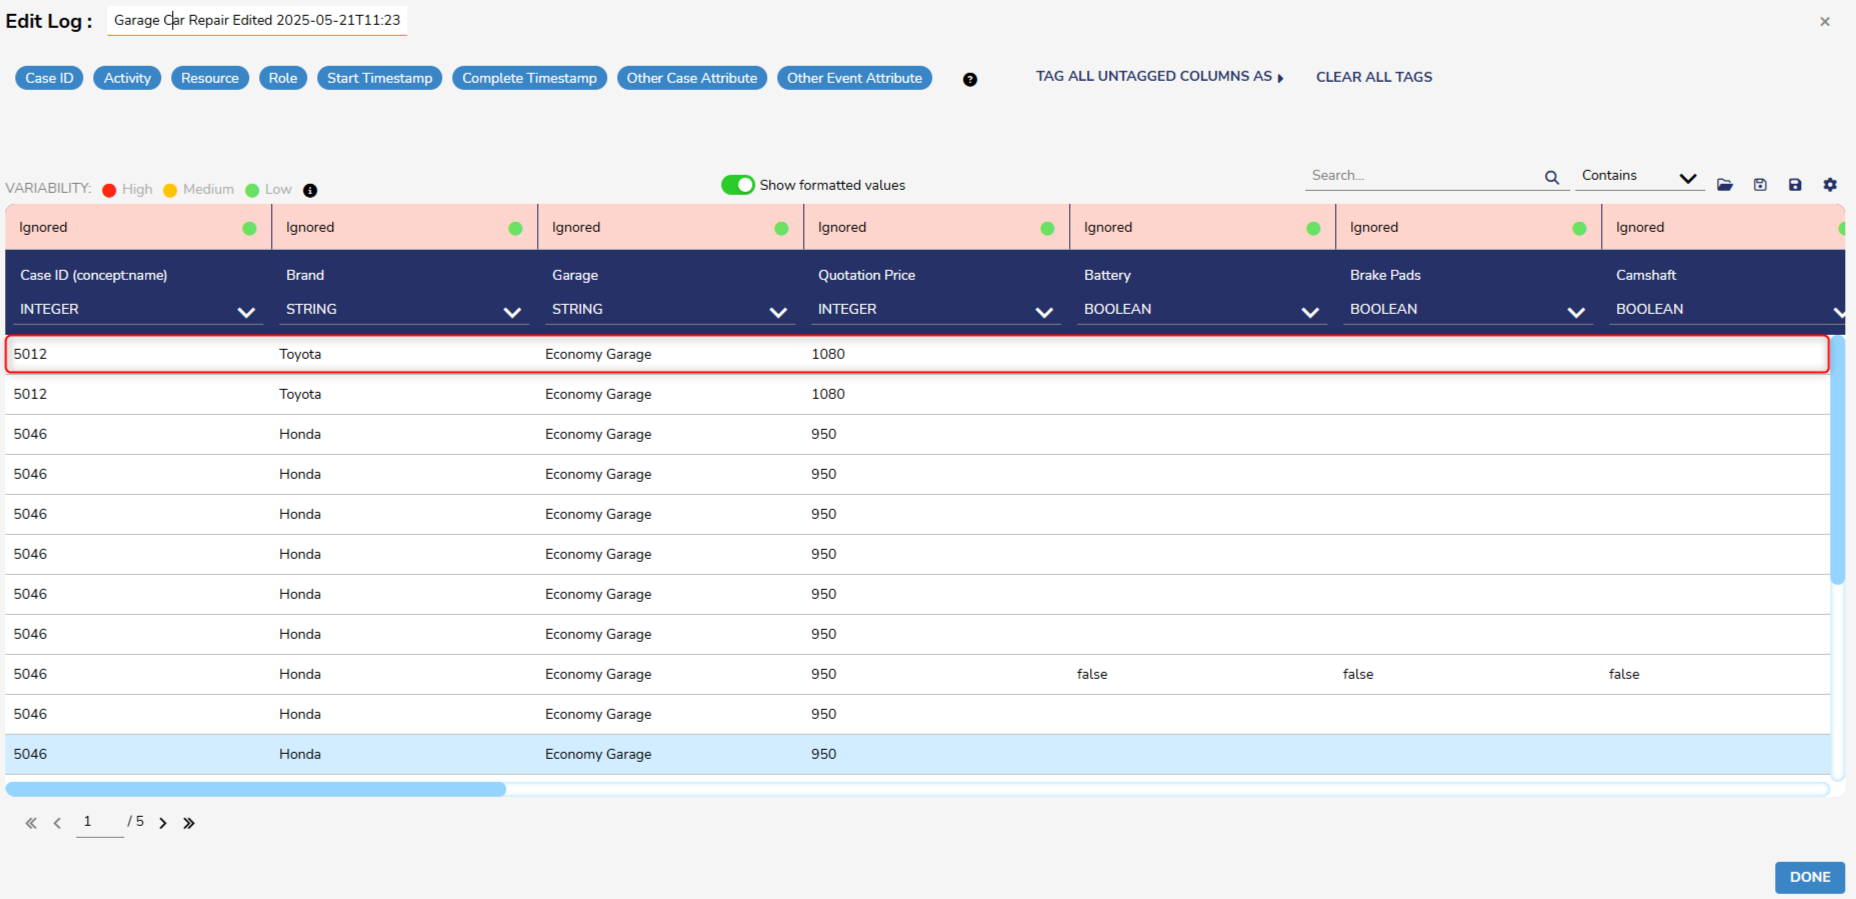
- By default, the log should display the default name for each attribute.
- These fields can be edited to reflect the name each attribute should have in the final edited log.
- By default, the log should display the default name for each attribute.
.png)
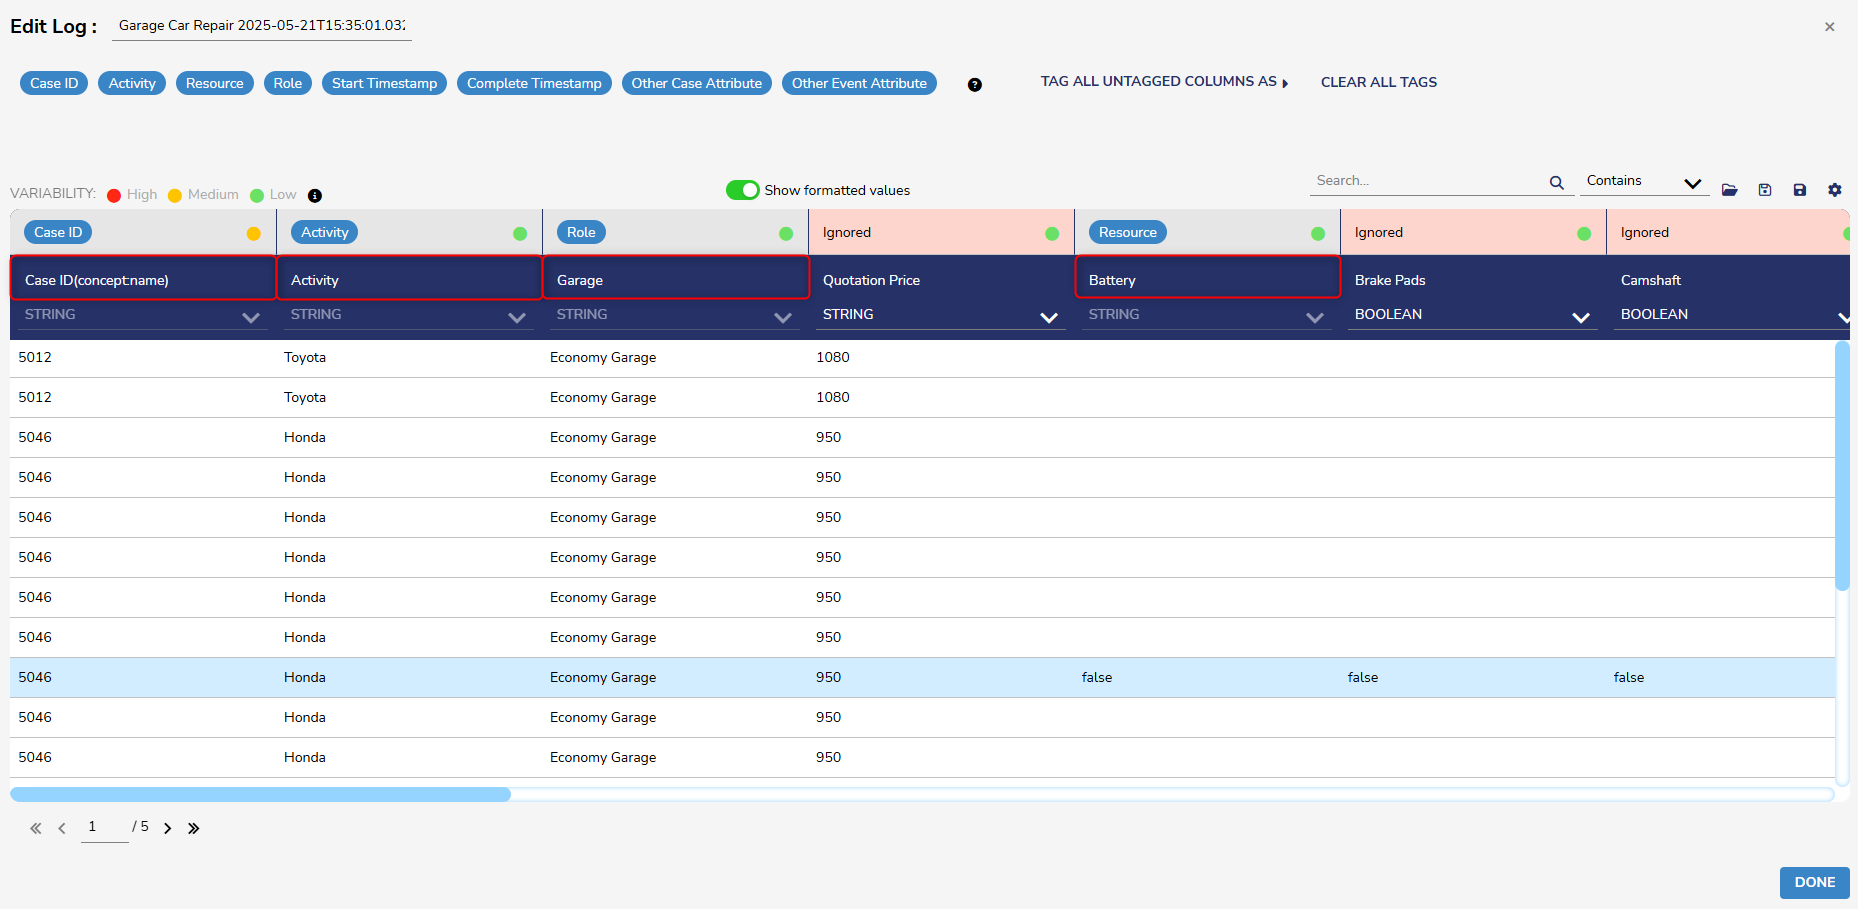
- Columns with red headers will be ignored. Columns can be imported by dragging and dropping a tag from the top panel to the desired column, or by right-clicking on the column and selecting the desired tag. To remove a tag, double-click on it or drag it back to the panel.
.gif)
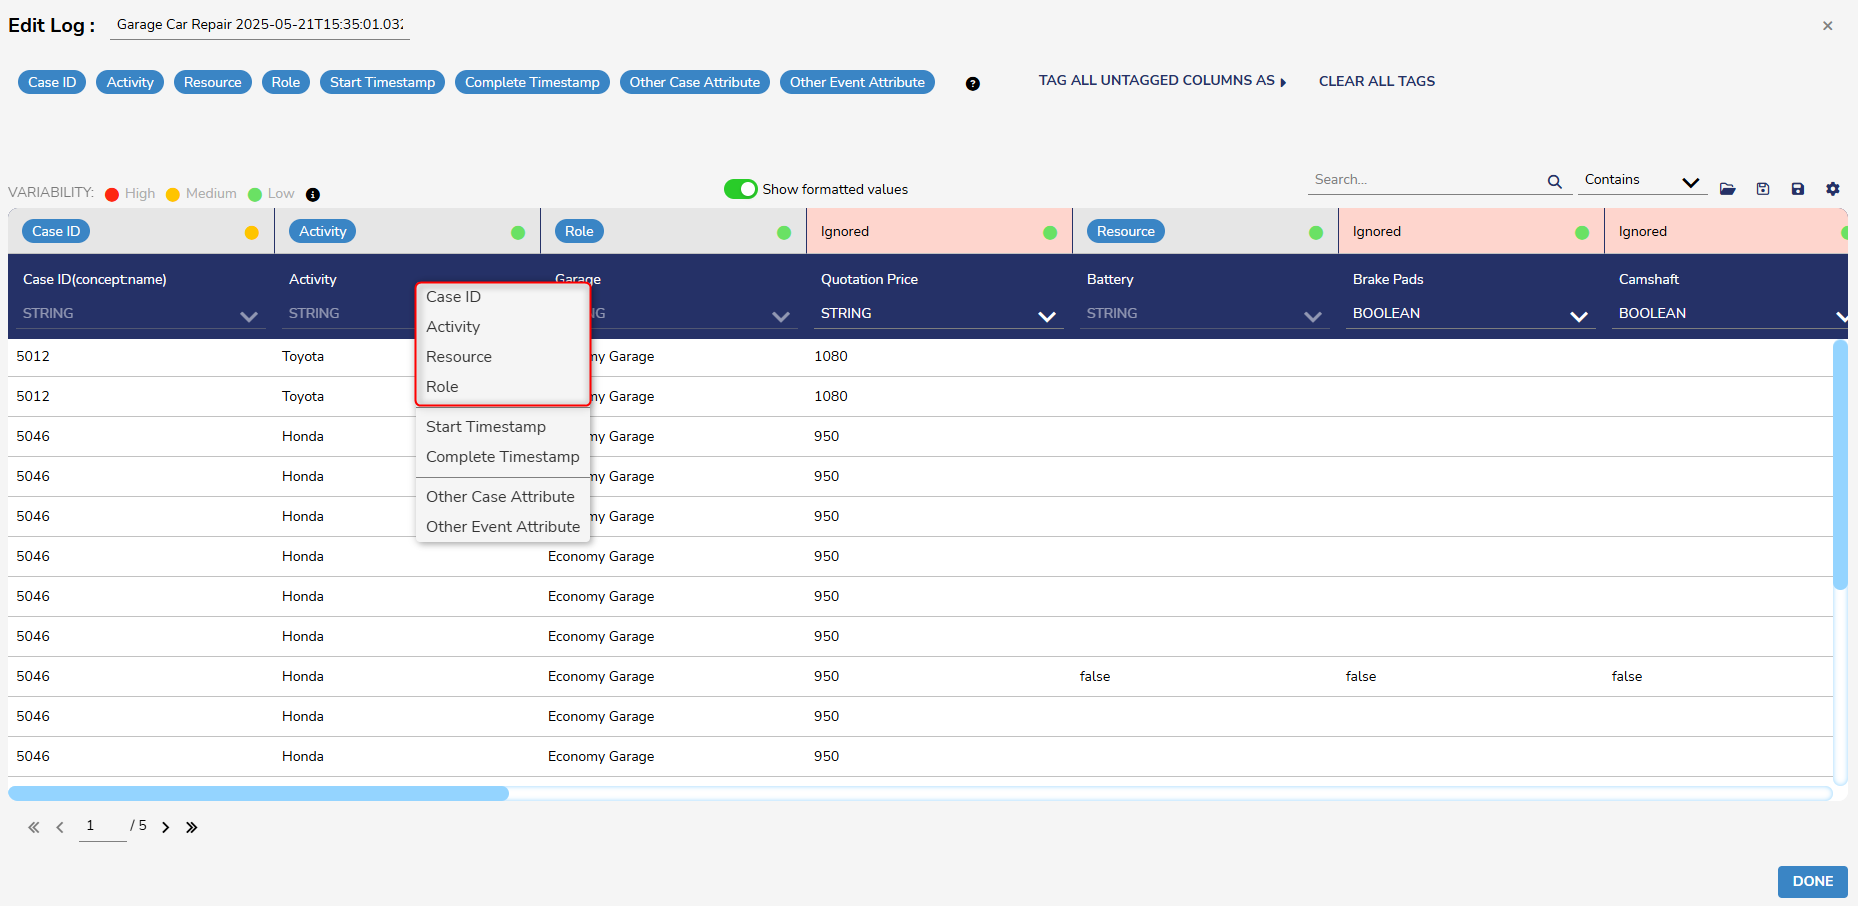 This example demonstrates how to import a column by right-clicking on it.
- The following requirements must be met before the log can be saved:
- The log must have a Case ID function, an Activity Name function, and a Timestamp function.
- Once the desired specifications have been made, the log can be saved by clicking either of these buttons.
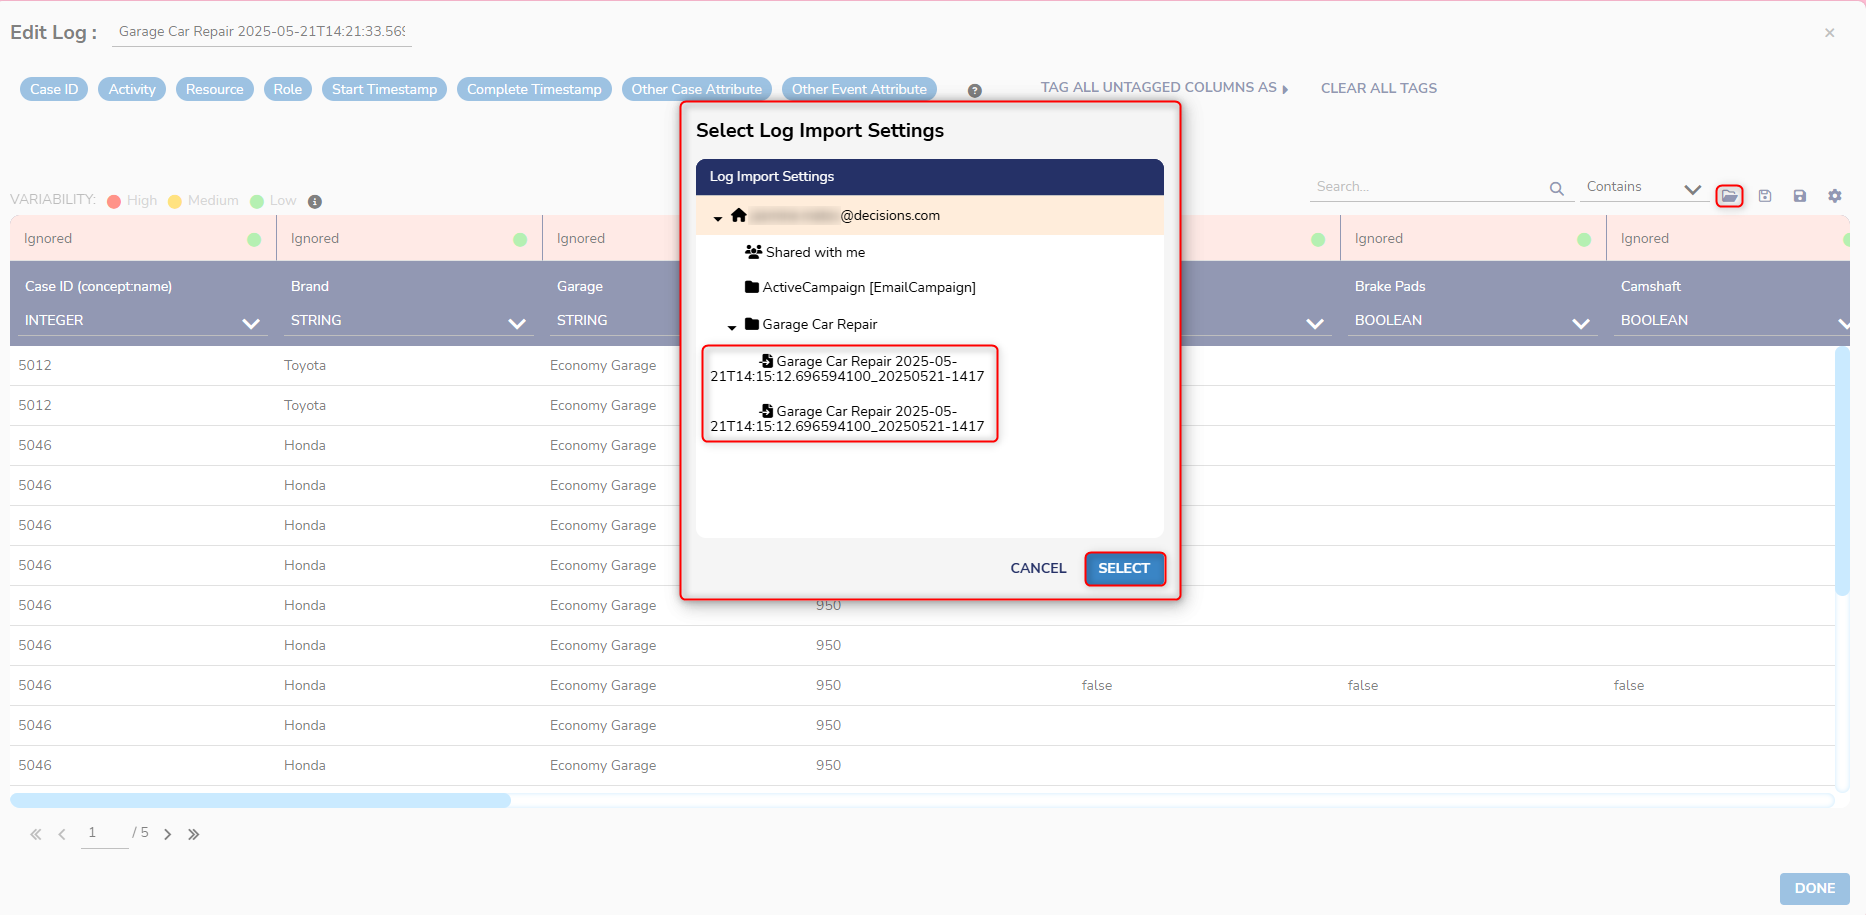
- From here, Users can select which folder to save the updated Log.
.png)
Once the settings are saved, Users who edit logs in the future can select these settings to load previous changes by selecting the Log Import Settings button.
Merging Logs
Users can merge multiple logs (at least two or more) and generate a new log from the sequence of inputs. Cases with the same Case ID should be joined in a single case.
To merge multiple Logs, right-click on a Log and select Merge. Then, pick ADD LOGS to pick the Log or Logs that will be merged with the original. The Attributes that will make up the merged Log can be chosen by clicking on them. All Attributes are selected by default.
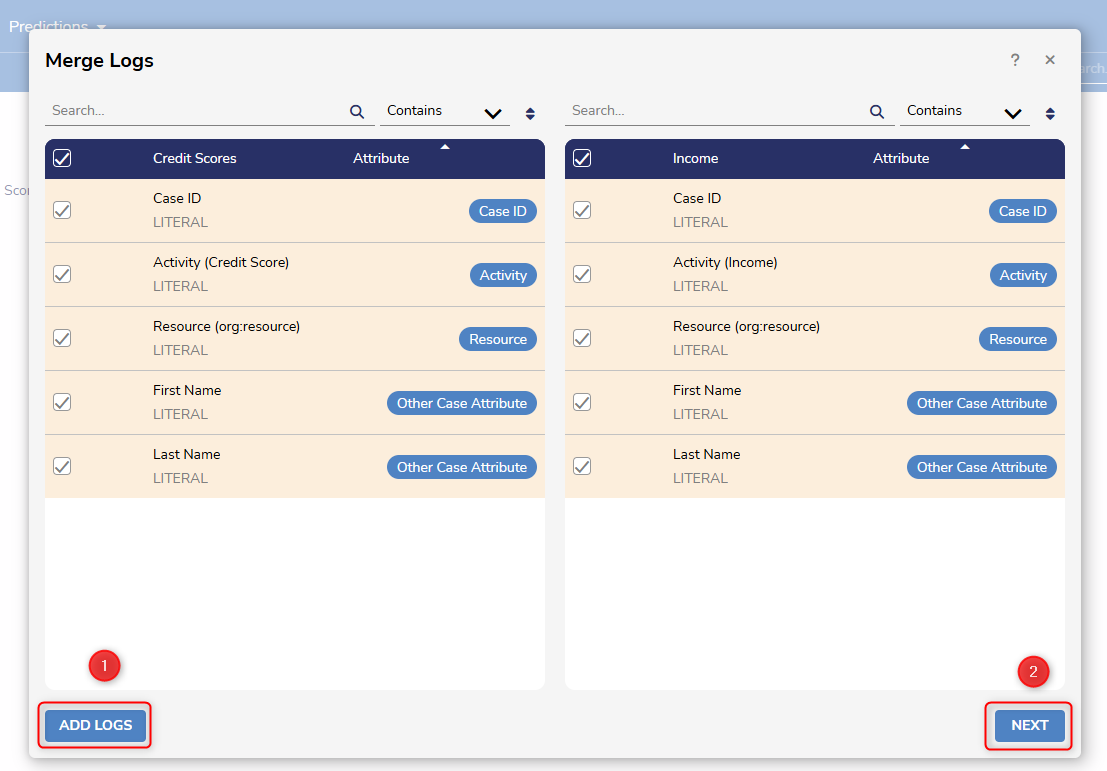 After clicking NEXT, Attribute labels will need to be paired. This can be done manually, or Users can have Process Mining automate it by clicking the magic wand icon in the middle of the screen.
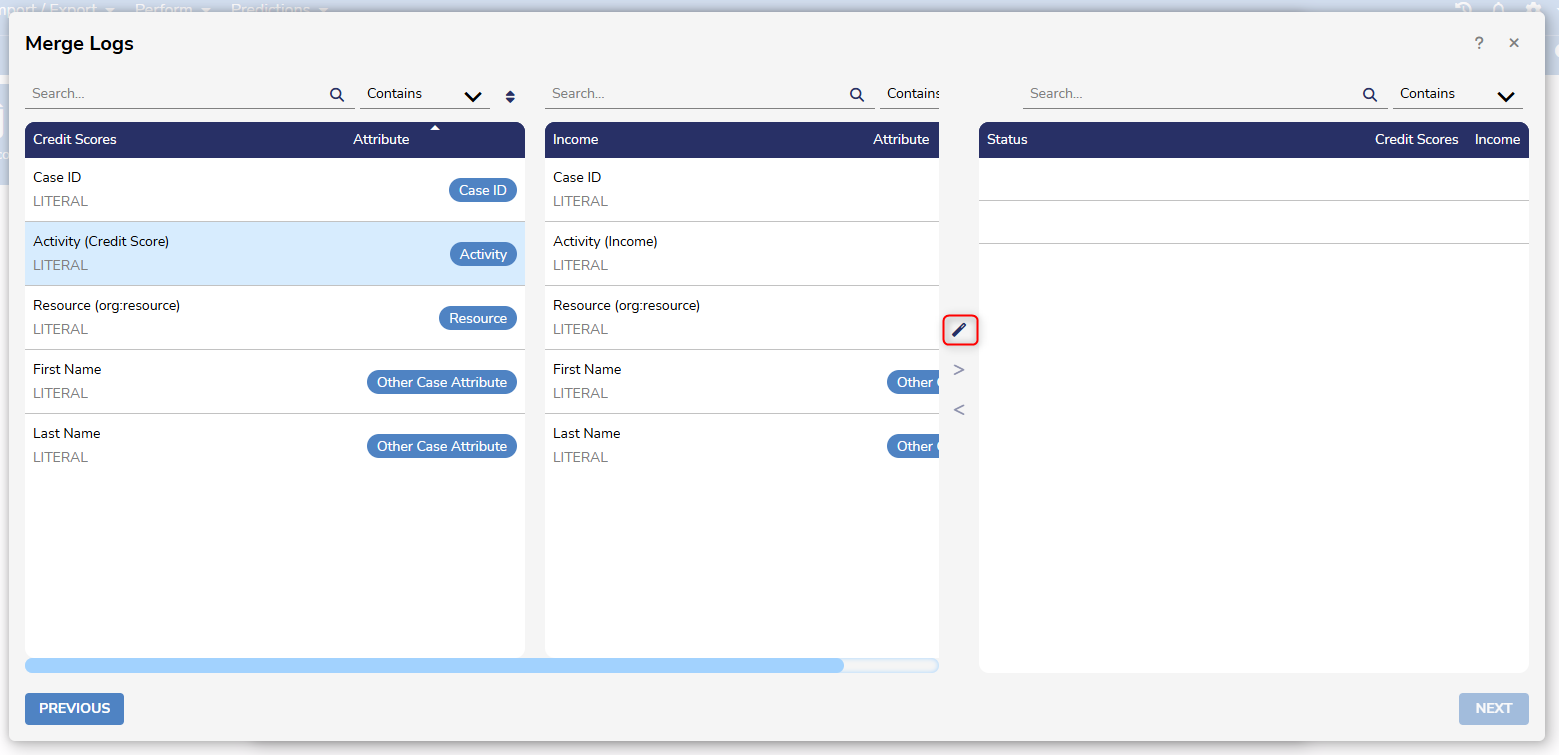 After clicking NEXT, Users will be taken to a screen similar to the Import Log screen, where Attributes will need to be labeled.
Columns with red headers will be ignored. To import a column, drag and drop a tag from this panel to the desired column, or alternatively, right-click on the column and select the desired tag. To remove a tag, double-click on it or drag it back to this panel.
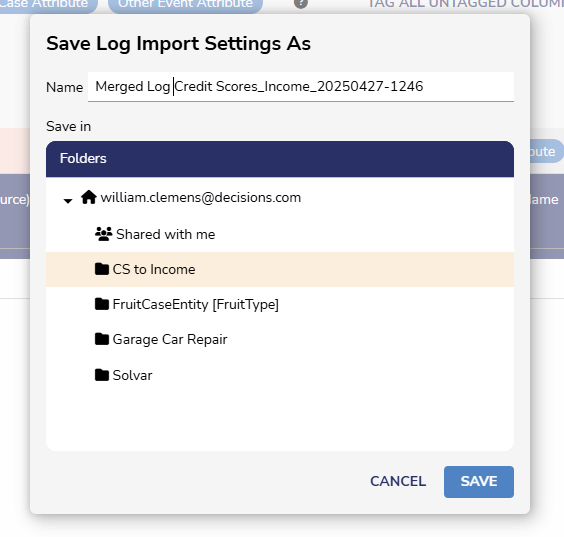
After that is complete, choose where the merged Log should be saved.
 Once the Merge Log is saved, Users can set the order in which data is sorted. Then, Users can navigate to the Analyzer screen to begin visualizing their data. See Process Map Analyzer Overview to learn more about how to view and use data.
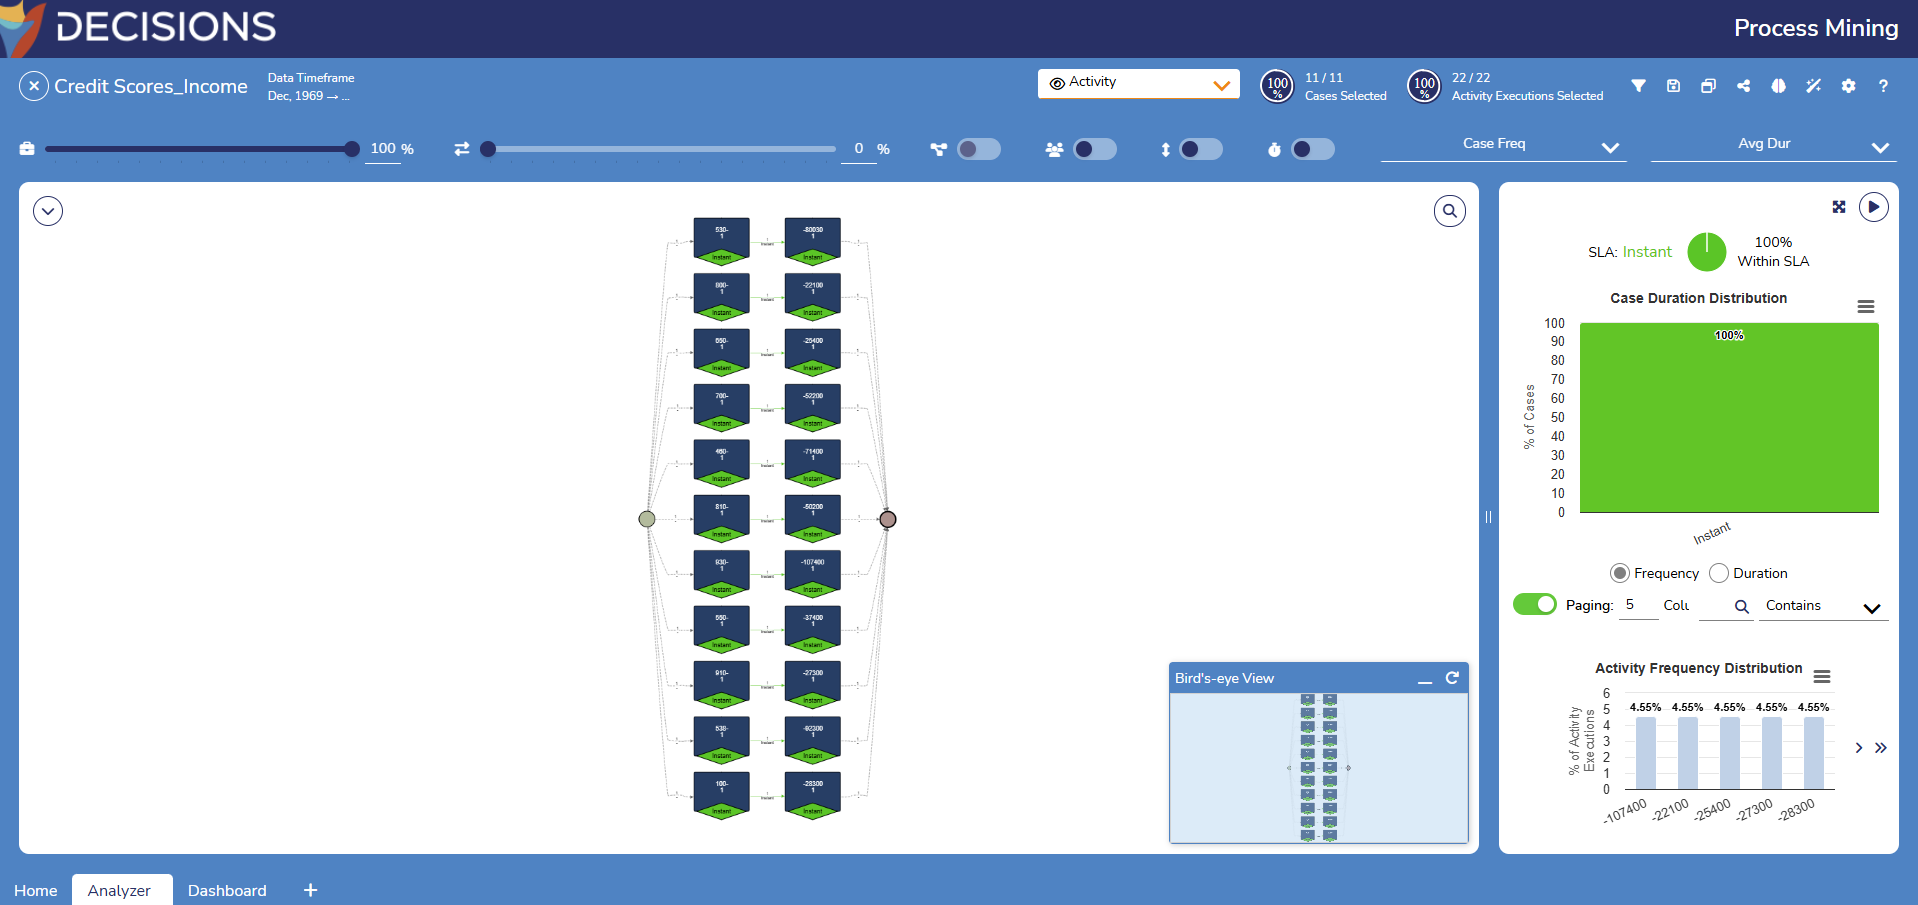
Joining Logs
Users can extend datasets with additional attributes from another dataset by joining logs.
Process Mining supports joining Event Logs and Imported CSV files. Below are the available file combinations:
- Event Log with CSV
- Event Log with Event Log
- CSV with CSV
- CSV with Event Log
To create a Join:
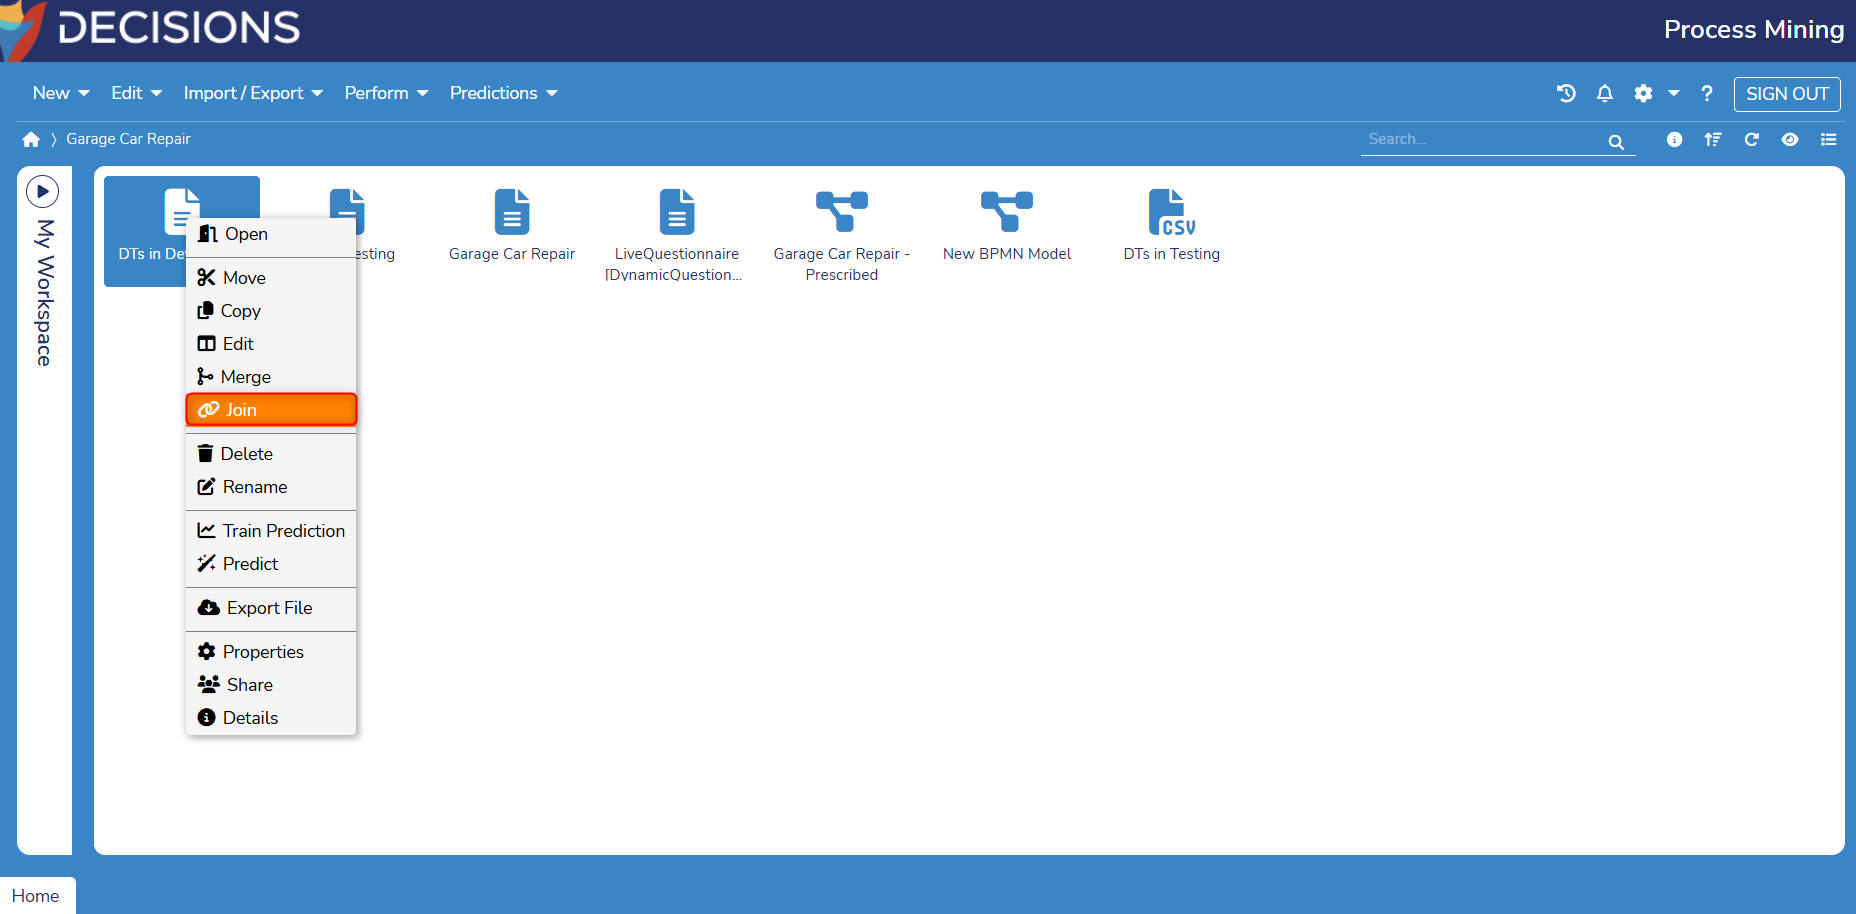
- Right-click on an Event Log or CSV File in Process Mining and select Join. In this example, an Event Log is used.
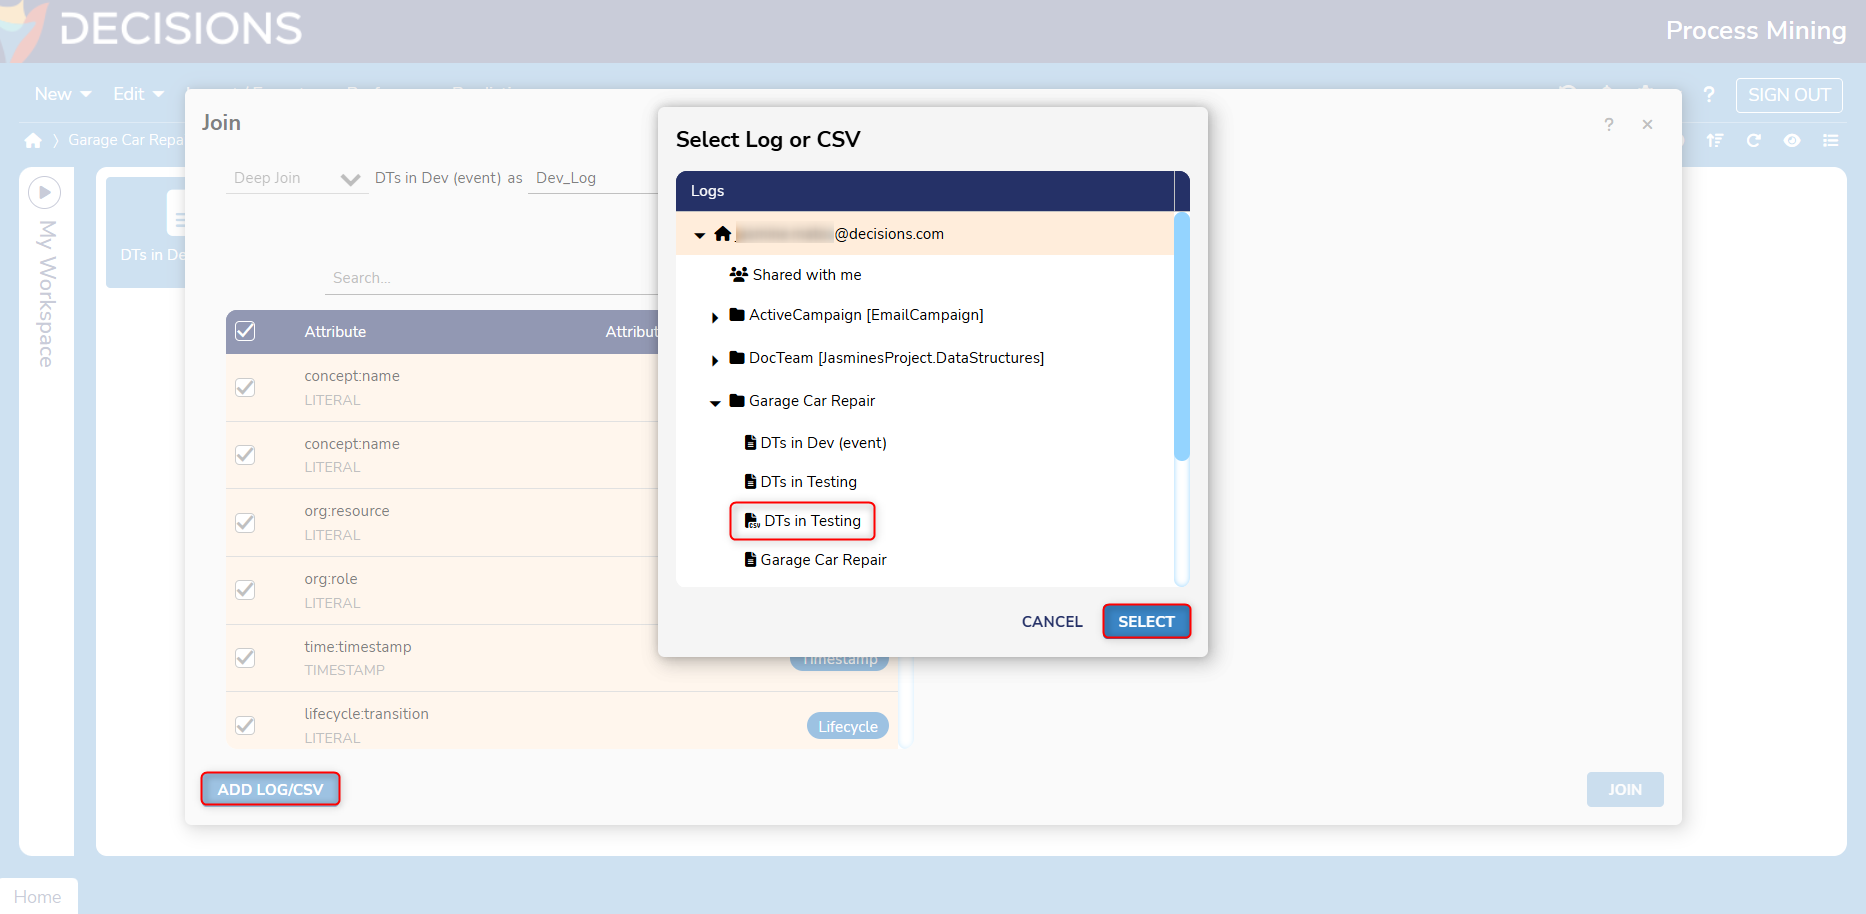
- From here, select Add Log/CSV to choose a Log/CSV file that will be joined with the selected Log/CSV file. In this example, the Event Log is being joined with a CSV file.
- Joins between two datasets can only occur if there is a common attribute between them. This can either be an event attribute or case attribute.
- Choose a name for each dataset.
- Specify the desired condition when the two datasets will be joined. Multiple conditions can be specified using AND/OR. In this example. OR, Folder_name, and Concept: name (Case ID) are used.
- AND: Includes all specified conditions for joining.
- OR: checks for one of the specified conditions.
.png)
- Event Attributes are only present in Event Logs. For example, if the first dataset in a Join is a CSV file, the Join cannot be based on event attributes.
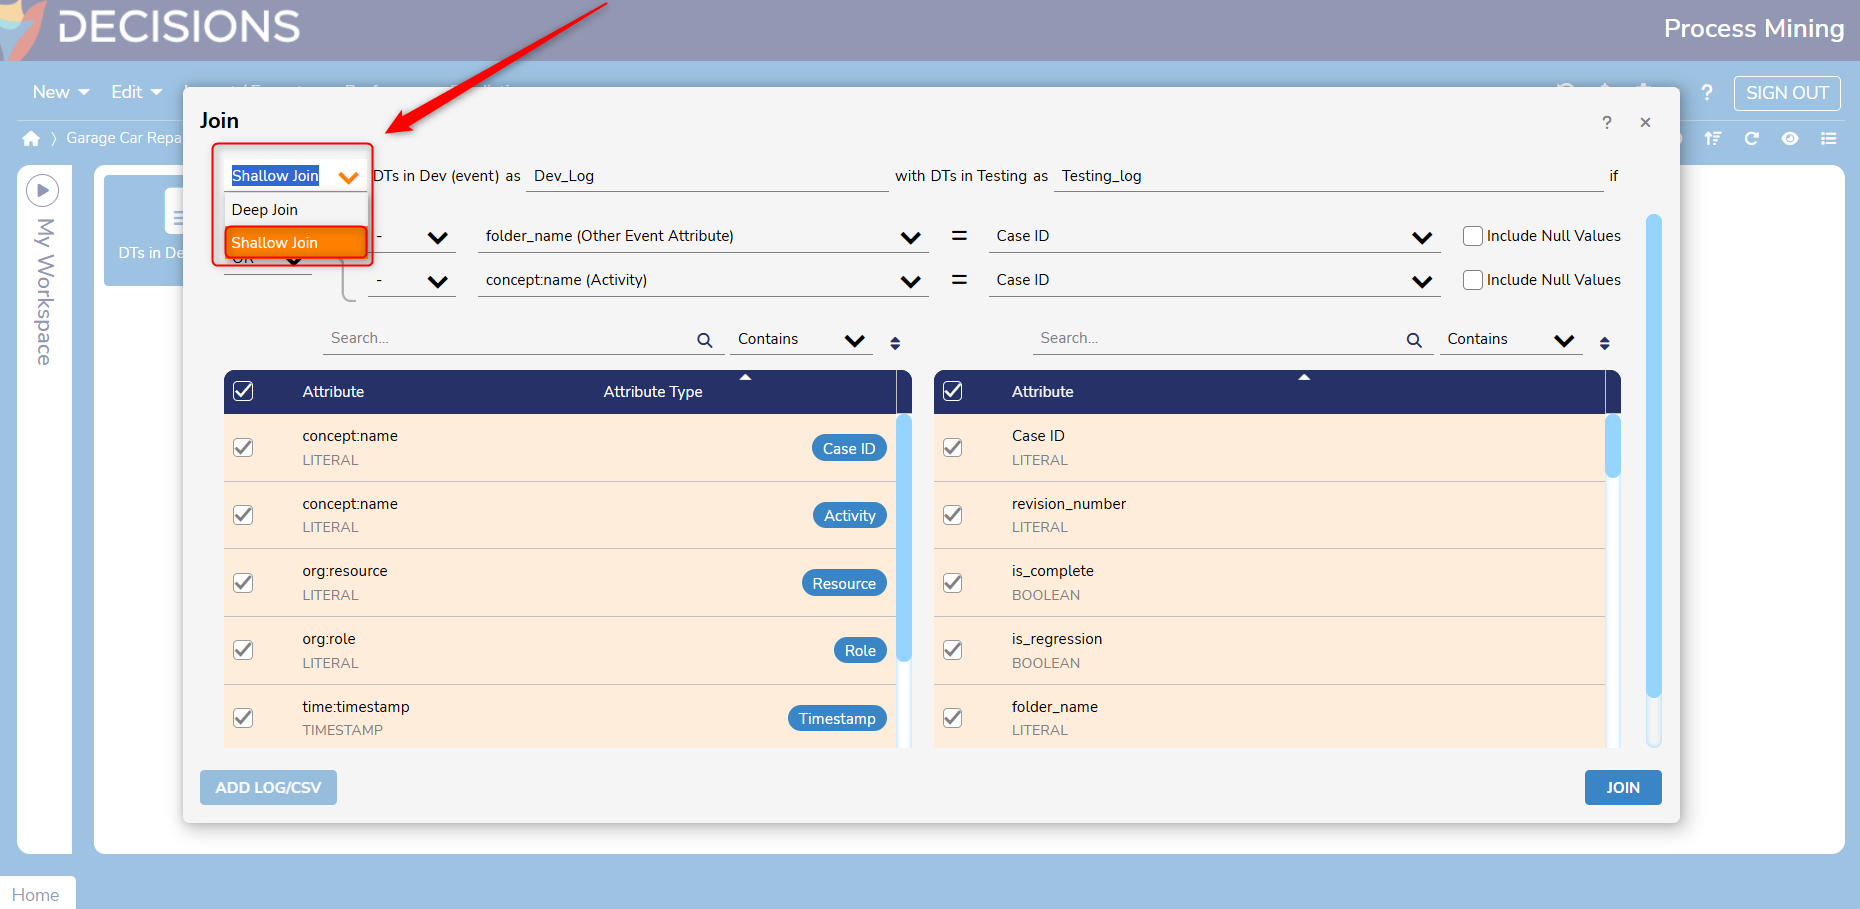
- Choose whether the Join is a Deep or Shallow Join. In this example, a Shadow Join is created.
- Shallow Joins combine rows based on matching events (such as an Activity) and keep the same identifier (CaseID) for all rows in the dataset.
- Deep Joins access different combinations of attributes and retrieve unique identifiers for each combination.
- Select desired attributes for each dataset. Attribute names will vary depending on the data that is included in the CSV/Event Log.
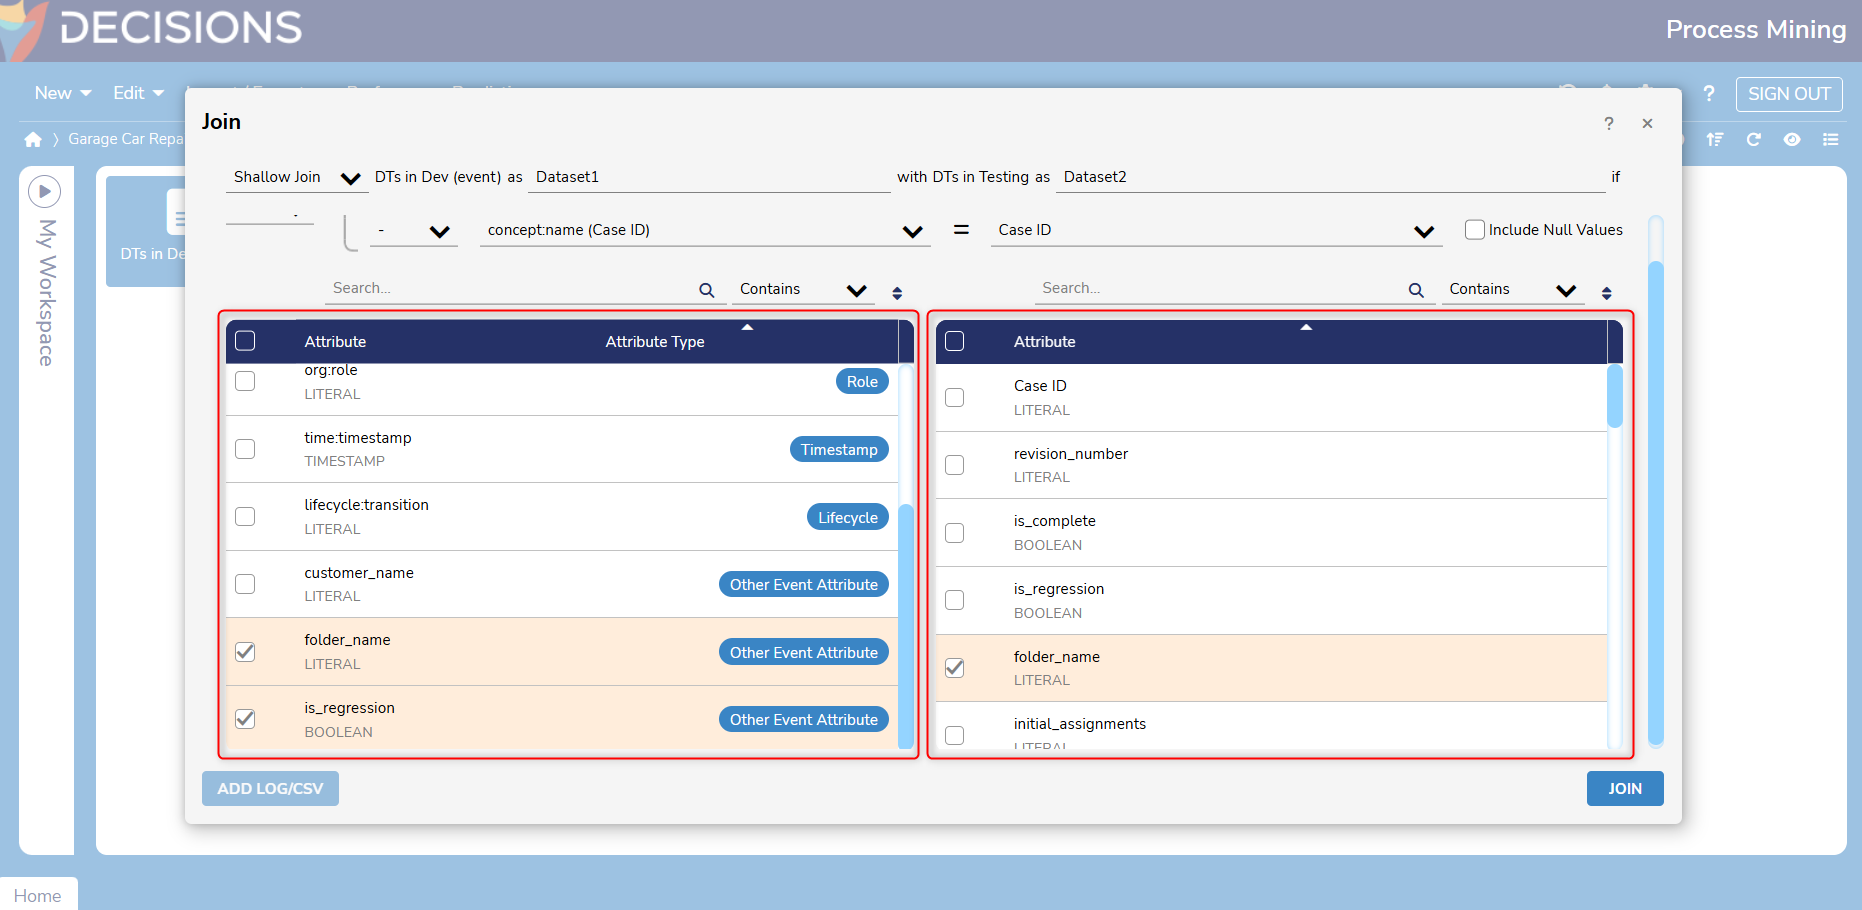
- Event Attributes are only present in Event Logs. For example, if the first dataset in a Join is a CSV file, the Join cannot be based on event attributes.
- Once the specifications have been set, click Join to create the Joined Log.
- Once the Log has been created, save it in a desired location.
.gif)
- Once the Joined Log is saved, Users can open the Log to reference the selected attributes in Plugins (Diagnoser, Cost Analyzer, etc.) and Dashboards.
- For example, Users can navigate to the Variant Explorer plugin and select the Filter Log.
- From here, Users can add the Attribute Filter and change Cases to Events. The attributes selected for the Join should now appear.
.gif)
- From here, Users can add the Attribute Filter and change Cases to Events. The attributes selected for the Join should now appear.
- For example, Users can navigate to the Variant Explorer plugin and select the Filter Log.
Log Best Practices
Hot Data VS Cold Data
For each event log, Users may set the data timeframe to keep in memory for faster analysis.
The data is divided into hot and cold data. Hot data is defined as the most recent data that is analyzed frequently. Hot data is stored in memory to allow faster analysis. On the other hand, cold data is defined as old data that is not analyzed frequently. Cold data is stored on disk, which may lead to a slower analysis.
Dividing data into hot and cold allows faster analysis of the most recent and interesting data in memory without running into memory shortage issues, caused by loading all data in memory.
Setting Hot Data Window Size
Users may set the hot data window size to unlimited to load and analyze all data in memory. This is suitable for smaller event logs. Alternatively, Users may set the hot data window size to a fixed number of months or years, in which case, the most recent data that falls into the hot data window is loaded in memory. For example, if the hot data window size is set to six months, the cases that have started within the last six months are considered as hot data and loaded in memory.
It is recommended to set the hot data window size such that it is large enough to keep the most frequently analyzed data in memory to speed up the user's regular analysis. An estimate of the memory usage of hot data is provided to assist you with setting the hot data window size and with avoiding running out of memory.
Default VS Custom Timeframe For Analysis
When opening an event log, by default, only the data that falls within the hot data window is included in the analysis, provided that the hot data window is not set to zero month/year. This is to allow faster opening of an event log, as well as faster analysis of the most recent and interesting data. On the other hand, if the hot data window is set to zero month/year, by default, all (cold) data will be included in the analysis, which may lead to slower opening of an event log and slower analysis.
After opening an event log, each user may select a custom data timeframe if they need to perform their analysis on data that is not included in the default timeframe. Their selected data timeframe can include hot data, cold data, or a combination of both. For example, if the hot data window is set to six months, by default, only the cases that fall in the hot data window (which are cases that started in the last six months) are included in the analysis. Now, if a user wants to perform their analysis on the data from the last twelve months, after the log is opened, they can manually specify a custom data timeframe of the last twelve months (that includes six months of cold data and six months of hot data).
Feature Changes
| Description | Version | Release Date | Developer Task |
|---|---|---|---|
| Users can now reorganize logs based on various attributes. A new log will be created, reflecting any changes that are made. | 3.2 | September 2024 | [DT-041494] |
| Users can merge multiple logs and generate a new log resulting from the input sequence. | 3.3 | November 2024 | [DT-040094] |
| Event Logs can now have additional attributes added to them using JOIN queries. | 3.3 | November 2024 | [DT-041864] |