Process Map Analyzer Overview
- 06 May 2025
- 4 Minutes to read
- Print
- DarkLight
Process Map Analyzer Overview
- Updated on 06 May 2025
- 4 Minutes to read
- Print
- DarkLight
Article summary
Did you find this summary helpful?
Thank you for your feedback!
Overview
The Process Map Analyzer enables Users to transform event log data into an interactive Process Map, with several built-in features to satisfy various use cases, such as annotation.
Navigating to the Process Map Analyzer
Double-clicking on an event log automatically navigates to the Process Map Analyzer tab, which houses the event log's Process Map.
The Process Map consists of a green start node, a red end node, activities, and handovers. All branches in a process are represented.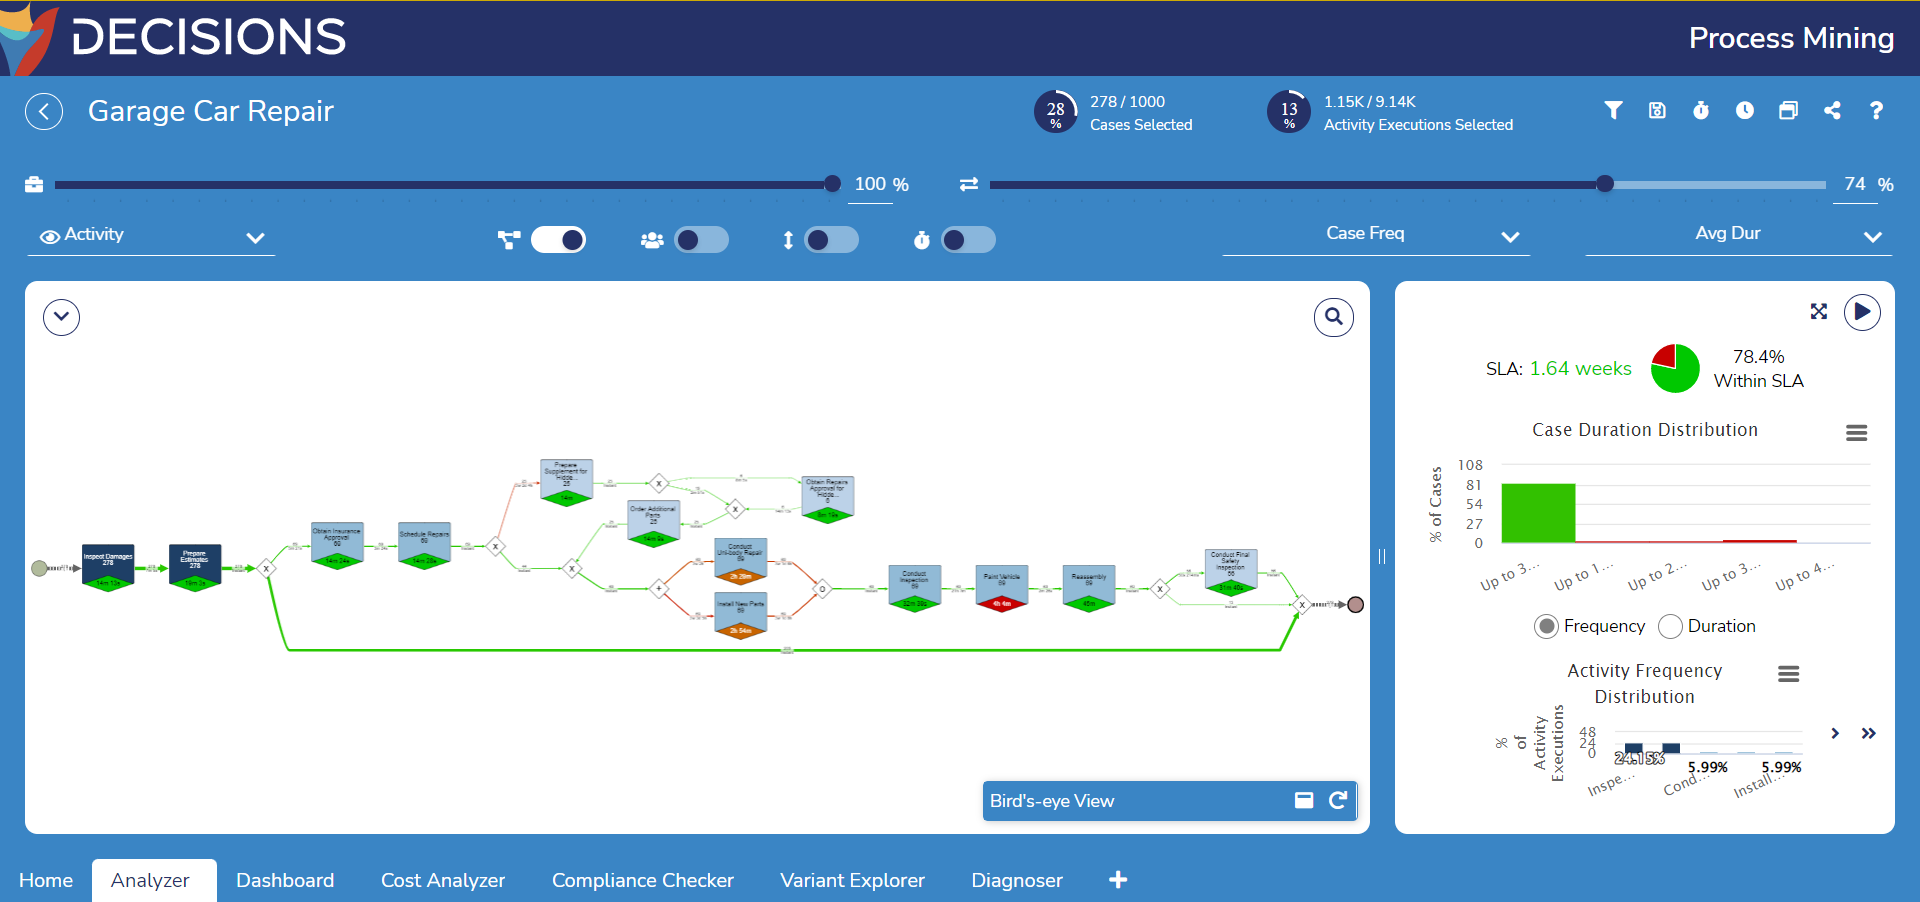
Activities and Handovers
Activities are chronologically organized from left to right. It is represented as a pentagonal shape with a diamond inside.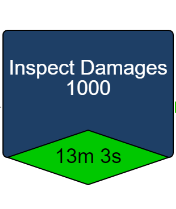
In addition to the activity's name, the shape changes its appearance based on the following information:
| Information Type | Definition | Appearance |
|---|---|---|
| Primary Information | Displays information under the first Dropdown menu at the top right of the Process Map. | Affects the color of the main pentagonal shape. |
| Secondary Information | Displays information under the second Dropdown menu at the top right of the Process Map. | Affects the color of the diamond. |
| Frequency | Signals the occurrences of an activity within all executions in the process. | Affects the color lightness; darker means higher frequency For durations, green and red represent short and long respectively. |
Handovers are transitions from one activity to another, represented as arcs between the start and end nodes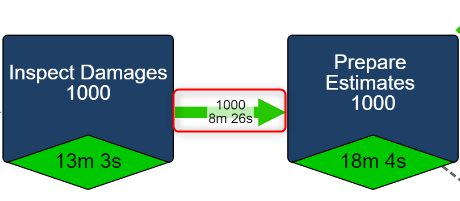
Similar to activities, handovers also display primary and secondary information; however, the thickness of the handover symbolizes frequency instead of assuming frequency is not selected in the primary information Dropdown menu.
Altering the Process Map View
Process Maps offer various customization options, such as view to highlight infrequent behavior, discover relations between elements, etc.
Interaction Drop Down Menu
These options alter the Process Map by displaying interactions between different resources, roles, or any other process involved elements.
Sliders
The Activity and Handover sliders above the map adjust how much/little infrequence activities and/or handovers are displayed on the Process Map.
Reducing the slider removes the number of elements in the graph.

Toggle Buttons
The toggle buttons located above the Process Map alter the Process Map. The following table describes their functions ordered from left to right.

| Icon | Function |
|---|---|
| Connected Squares | Toggles between viewing the event log as a Process Map or a BPMN model |
| Group of People | Toggles visibility of roles involves in the process |
| Up and Down Arrow | Toggles layout between horizontal and vertical |
| Stopwatch | Toggles color of activities and handovers according to their SLA; requires at least one type of primary and/or secondary information regarding duration |
Primary and Secondary Information Drop Down Menu
These Drop-down menus change which primary and/or secondary information is displayed for the activities and handovers.
Map Drop Down Menu
Expanding this drop-down menu presents further options to customize the Process Map:
.png)
Corner Box - Resize Map
The corner-box icon automatically adjusts the Process Map to fit the dimensions of its containing window.
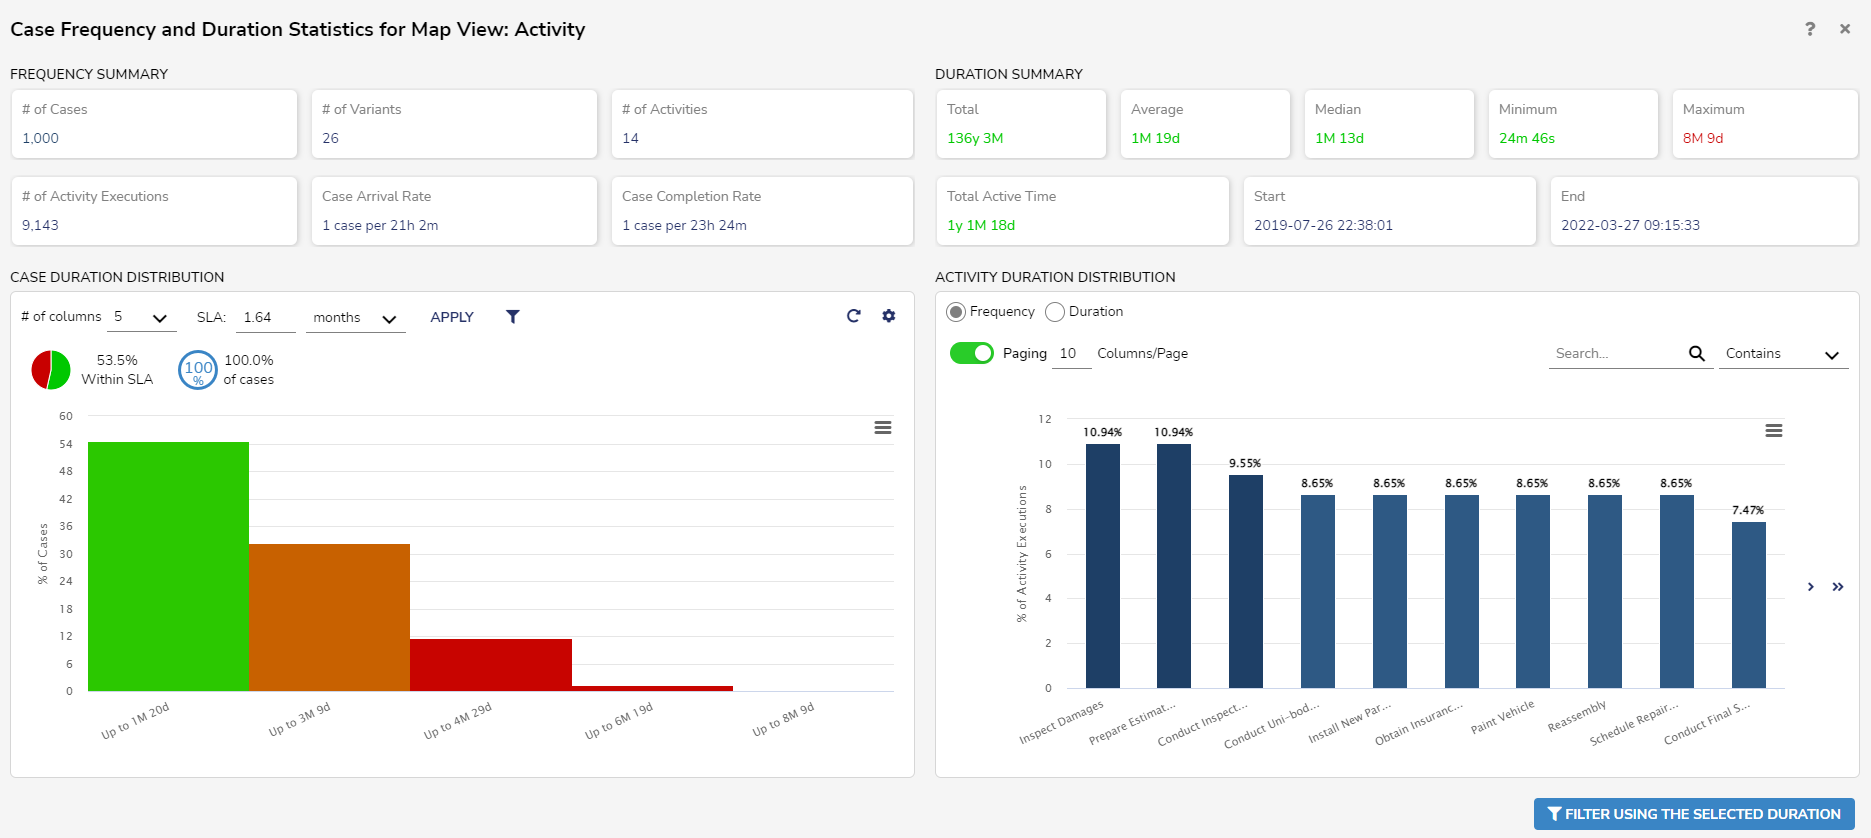
Bar Chart - Duration and Frequency View
The bar chart icon opens the duration and frequency statistics of the process.
Play Button > Diamond - Log Animation
All entries within the event log may be replayed within the map to provide a chronological, dynamic representation of each execution in a process. The animation's bird's-eye view allows for easier detection of process hotspots and bottlenecks as well as for easier comparison of executions with multiple variants.
Upon selecting the diamond icon, the Log Animation Settings window will appear, allowing for animations to show one or multiple variants and what color represents them.
The Synchronize Cases checkbox toggles the timelines of the executions so the animation of all cases starts at the same time.
The Synchronize Variants checkbox toggles the timelines of the executions so the animation of all variants starts at the same time.
Play Button > Computer - Process Simulation
Process simulation enables simulation of multiple process improvement scenarios to discover the most optimal outcome(s). Starting the simulation directly from the map automatically extracts the simulation parameter values, such as duration distribution of activities, from the event log to populate the corresponding fields in the Simulator.
Map Drop Down Menu: File Options
Clicking the File button reveals an additional set of options.

File > Create Case Entity
This option enables Users to create a Case Entity on the associated Decisions Automation Server after filling in the required details.

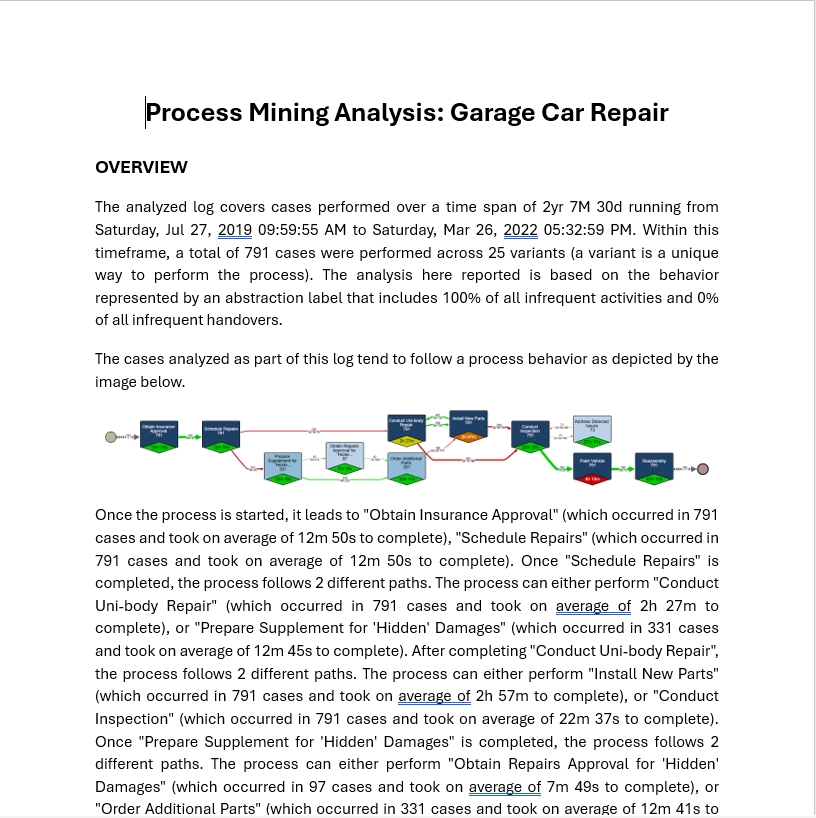
File > Download Process Mining Analyst Report
The Process Mining Analyst Report is exported as a Word Document and contains the following elements:
- An overview of the associated processes
- Time duration of the entire process
- Customized sections (chosen before the Report is downloaded)
Downloading the Process Mining Analyst Report
- To download the Report, navigate to the Process Map and select Download Process Mining Analyst Report.
- From here, Users can choose which sections will be included in the Report.
- Users who are downloading the Report for annotation purposes must select Insights in addition to the desired sections before clicking Ok.
- From here, Users can choose which sections will be included in the Report.

- Once the Report is downloaded, Users can proceed with annotating or viewing as desired.

File > Save as BPMN
Allows Users to save the changes to the Process Map to a selected Folder.
Please note that Users will not be able to click this option until Discover BPMN is turned on.
.gif)
File > Download Icon > Download Map as Image
Downloads the Process Map as either a PNG or a JPEG image file. The file's resolution and dimensions can be manually configured.
Side Panel
The right panel displays distributions of execution, activity, or handover durations. Double-clicking on an activity or handover will open its duration distribution, while double-clicking on either the start or end node displays the executions instead.
By default, the event log's side panel shows a top chart displaying execution duration and a bottom chart displaying frequency/duration distribution of activities. Users may return to this view by double-clicking the start node.
Double-clicking on an activity displays the duration distribution of an activity at the top chart, while the bottom chart displays the frequency distribution of resources performing that activity.
Double-clicking on a handover displays the duration distribution of a handover, while the bottom chart displays the frequency distribution of the resource performing its target activity if available. Otherwise, it will be blank.
 The default SLA is set to the average case/activity/handover duration, depending on what the duration distribution chart is displaying.
Users may change the SLA by expanding the distribution charts panel by clicking on the expand arrow icon. In the new window, SLA may be configured under the Case Duration Section.
Was this article helpful?