Overview
While users can upload and use their own images as icons, the platform has thousands of icons in the library that users can choose from to customize Designer Elements. Users can style the icons by using the color picker editor or a hex code. Icons on a Report can be applied using a Report Row Icon Flow. The Report Row Icon Flow allows the user to define complex logic in order to apply different icons to rows and/or columns in the Report.
The following example demonstrates how to add icons using the Report Row Icon Flow; a Report using the Accounts Data Source will have a checkmark icon styling if the account can use the Portal.
Notes
- Icons Can Also Be Set For Columns
- Remove the Icon Flow from the Report Properties panel. Select the Can Use Portal Data Field, in the Properties panel, navigate to Color Rules and select 'Add New'. Choose the Flow created in the above example and apply the same input configurations
- Icon Type must be set to Image on the Report Viewer
- If you are receiving an error saying "Icon Type must be set to image on Report Viewer" review this forum post for the resolution: Icon Type must be set to Image on the Report Viewer
Example
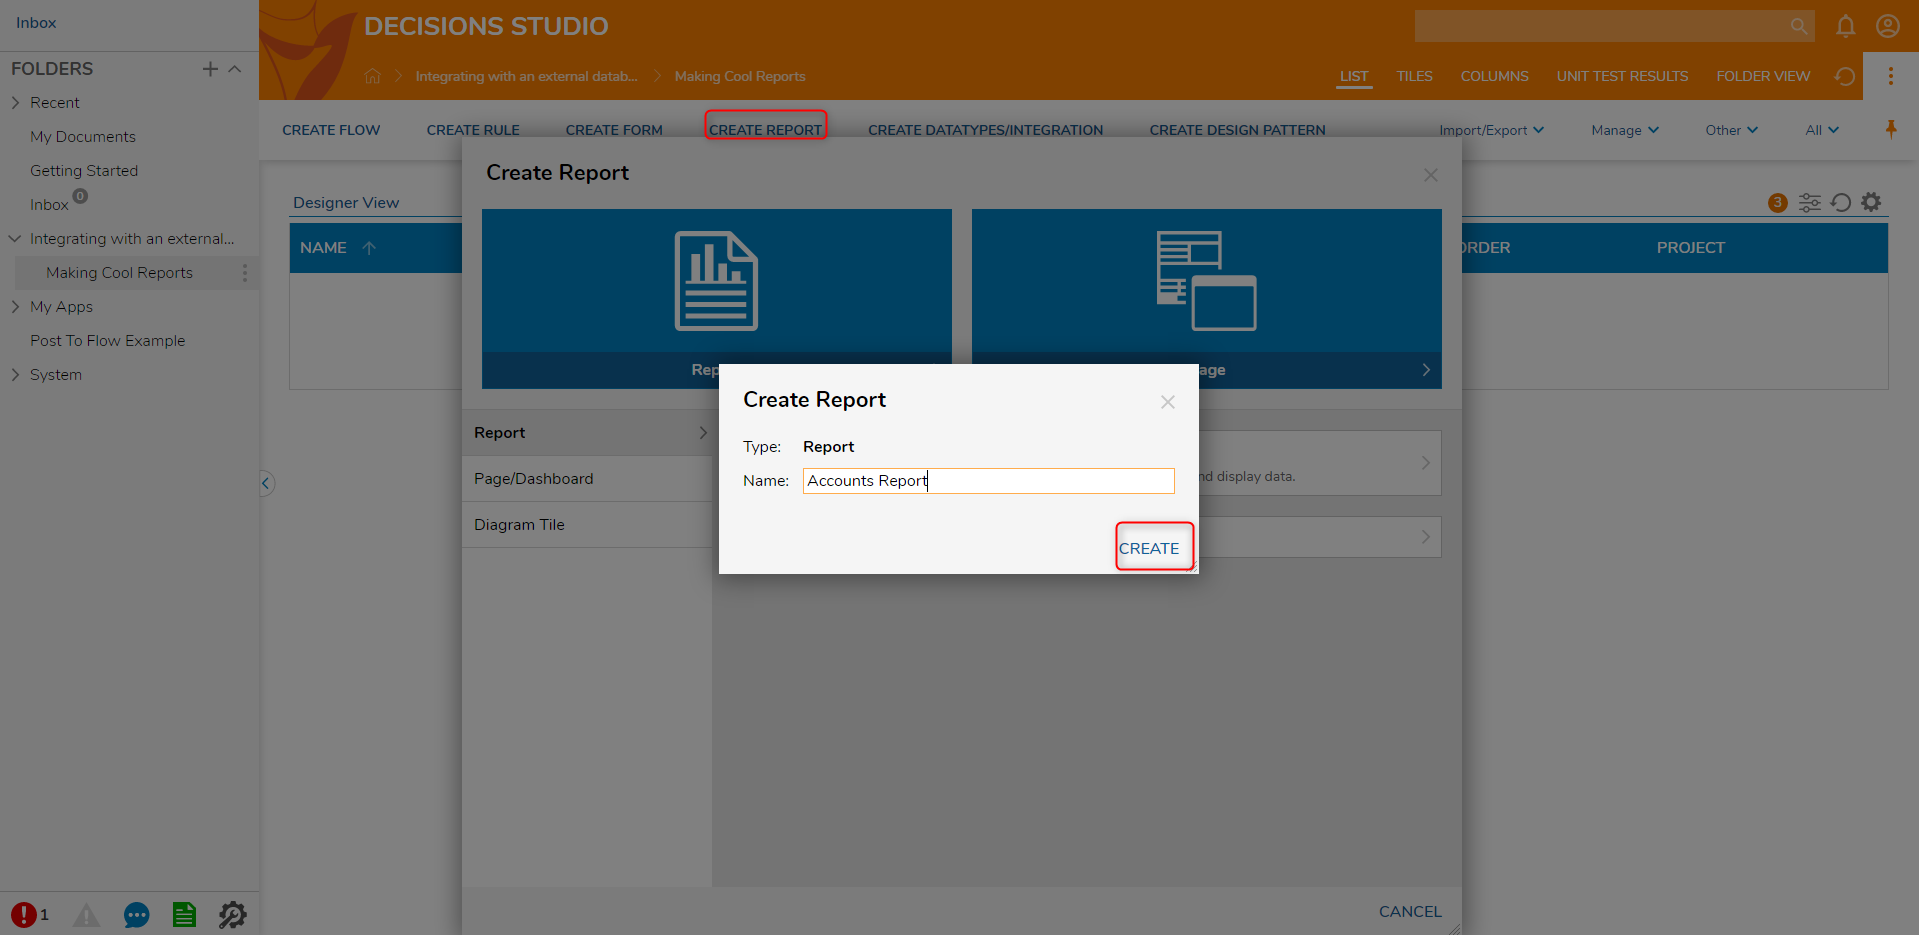
- Begin by selecting 'Create Report' in a Designer Project Folder. Name the Report and select 'Create'.
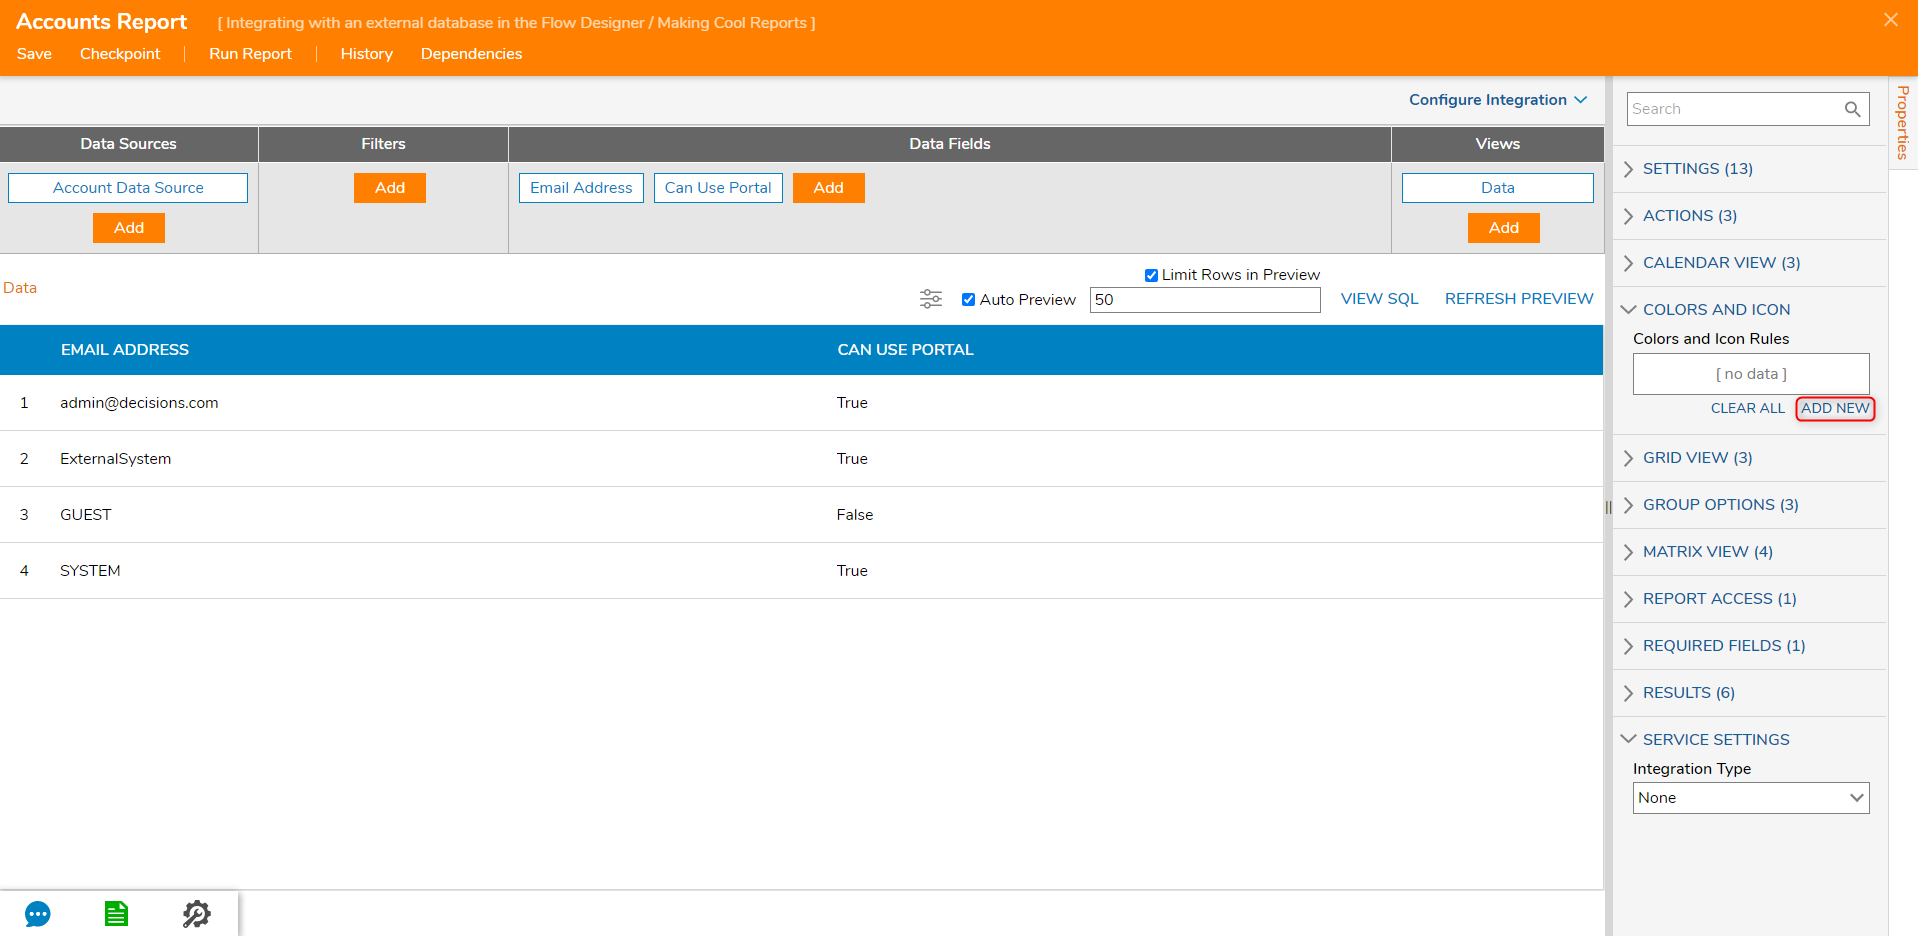
- The Report will use the Account Data Source. The Data Fields for the Report are Email Address and Can Use Portal.
- In the Properties panel, expand the Colors and Iconsection and select 'Add New'.
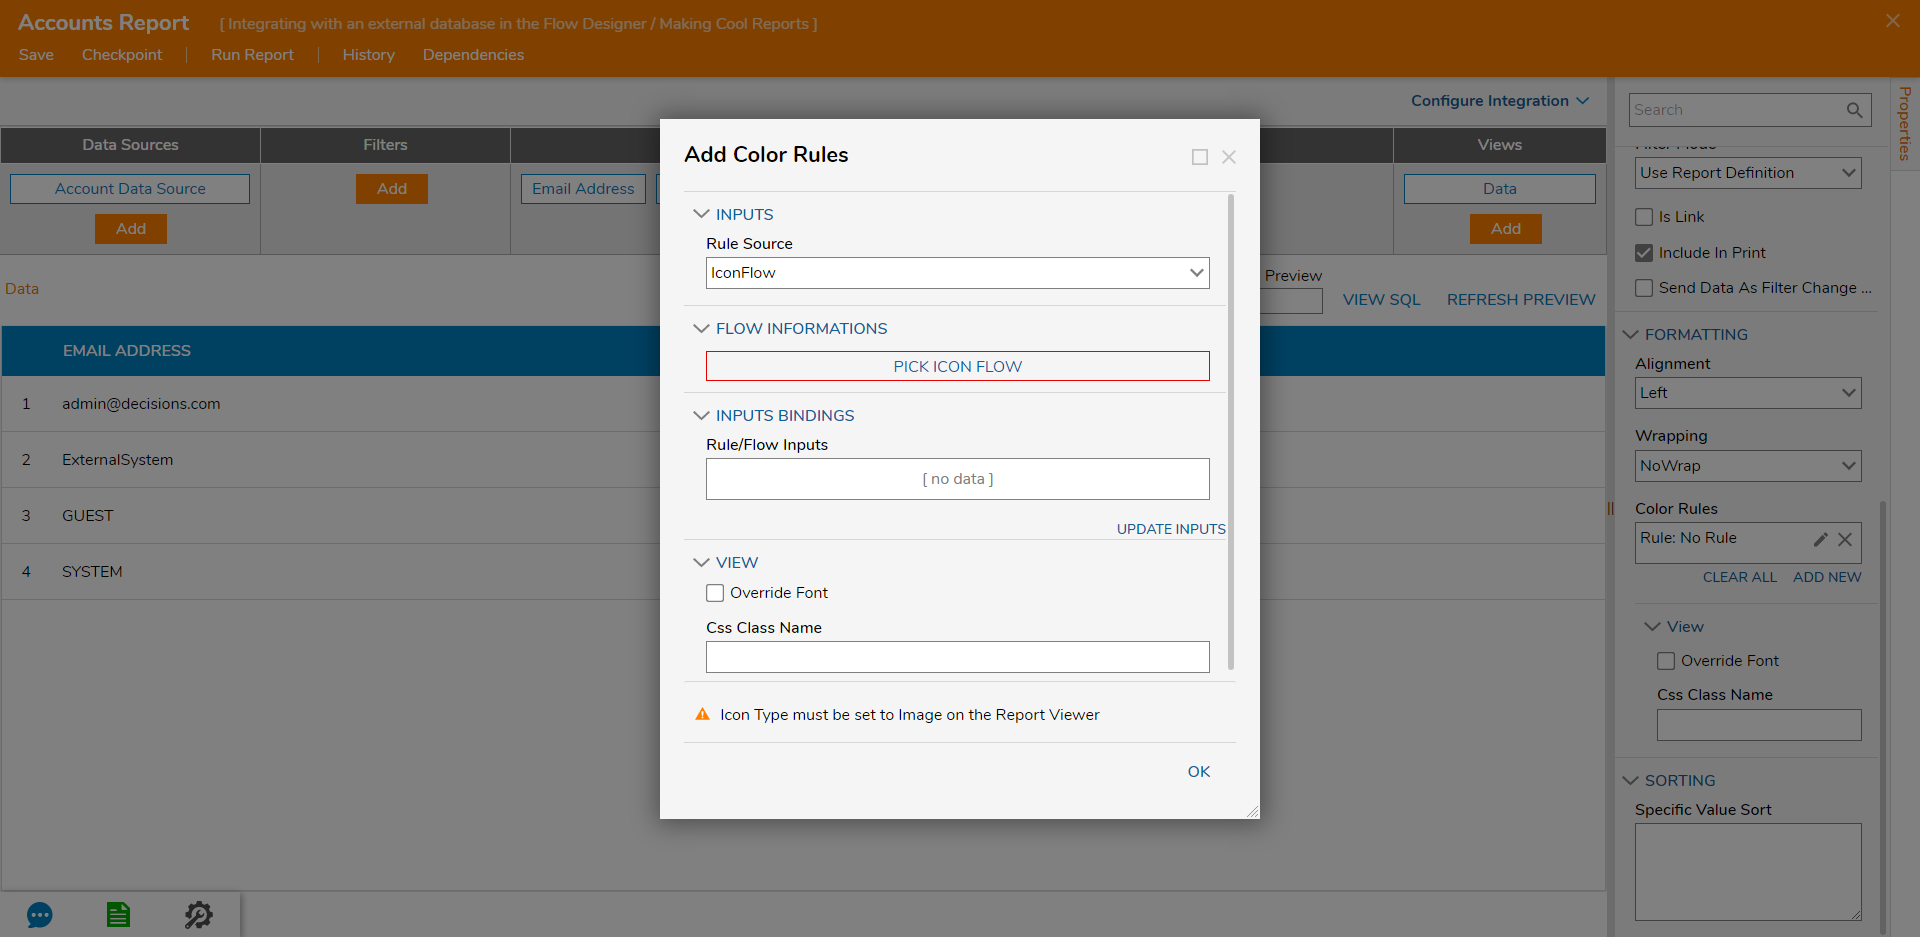
- In the resulting dialog, locate the Rule Source drop-down and choose Icon Flow, then select 'PICK ICON FLOW'. Name the Flow then select 'Create'.
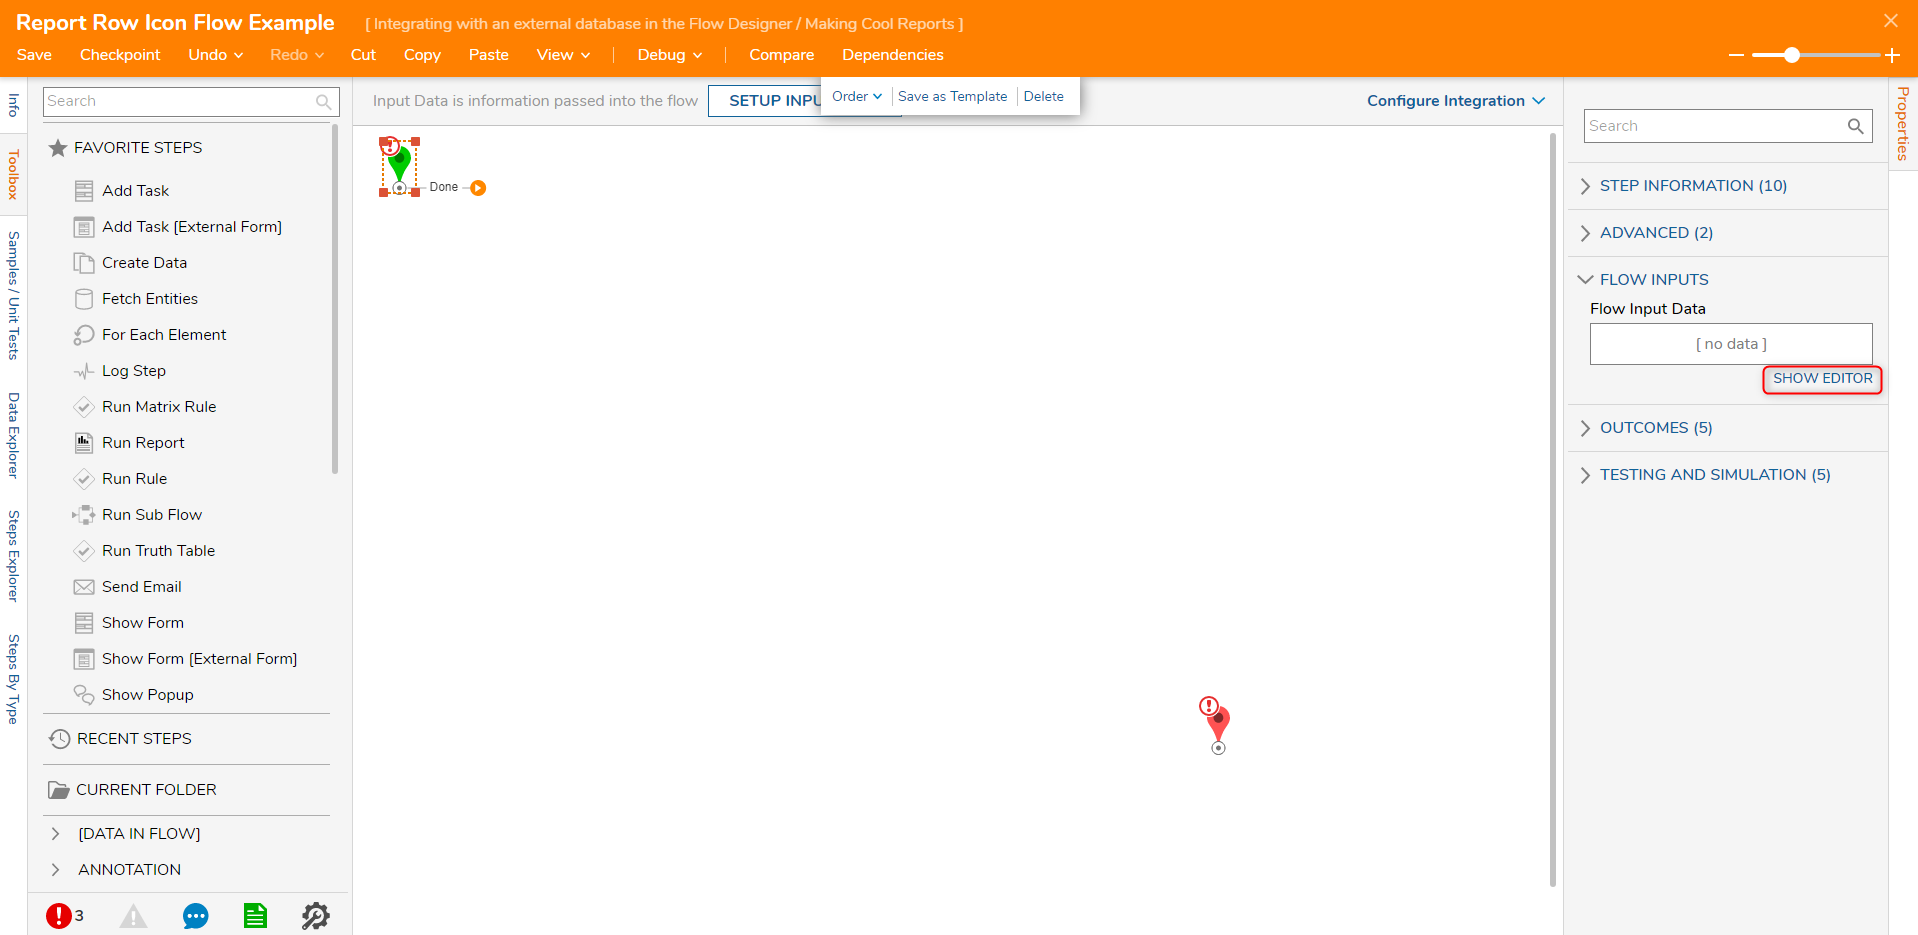
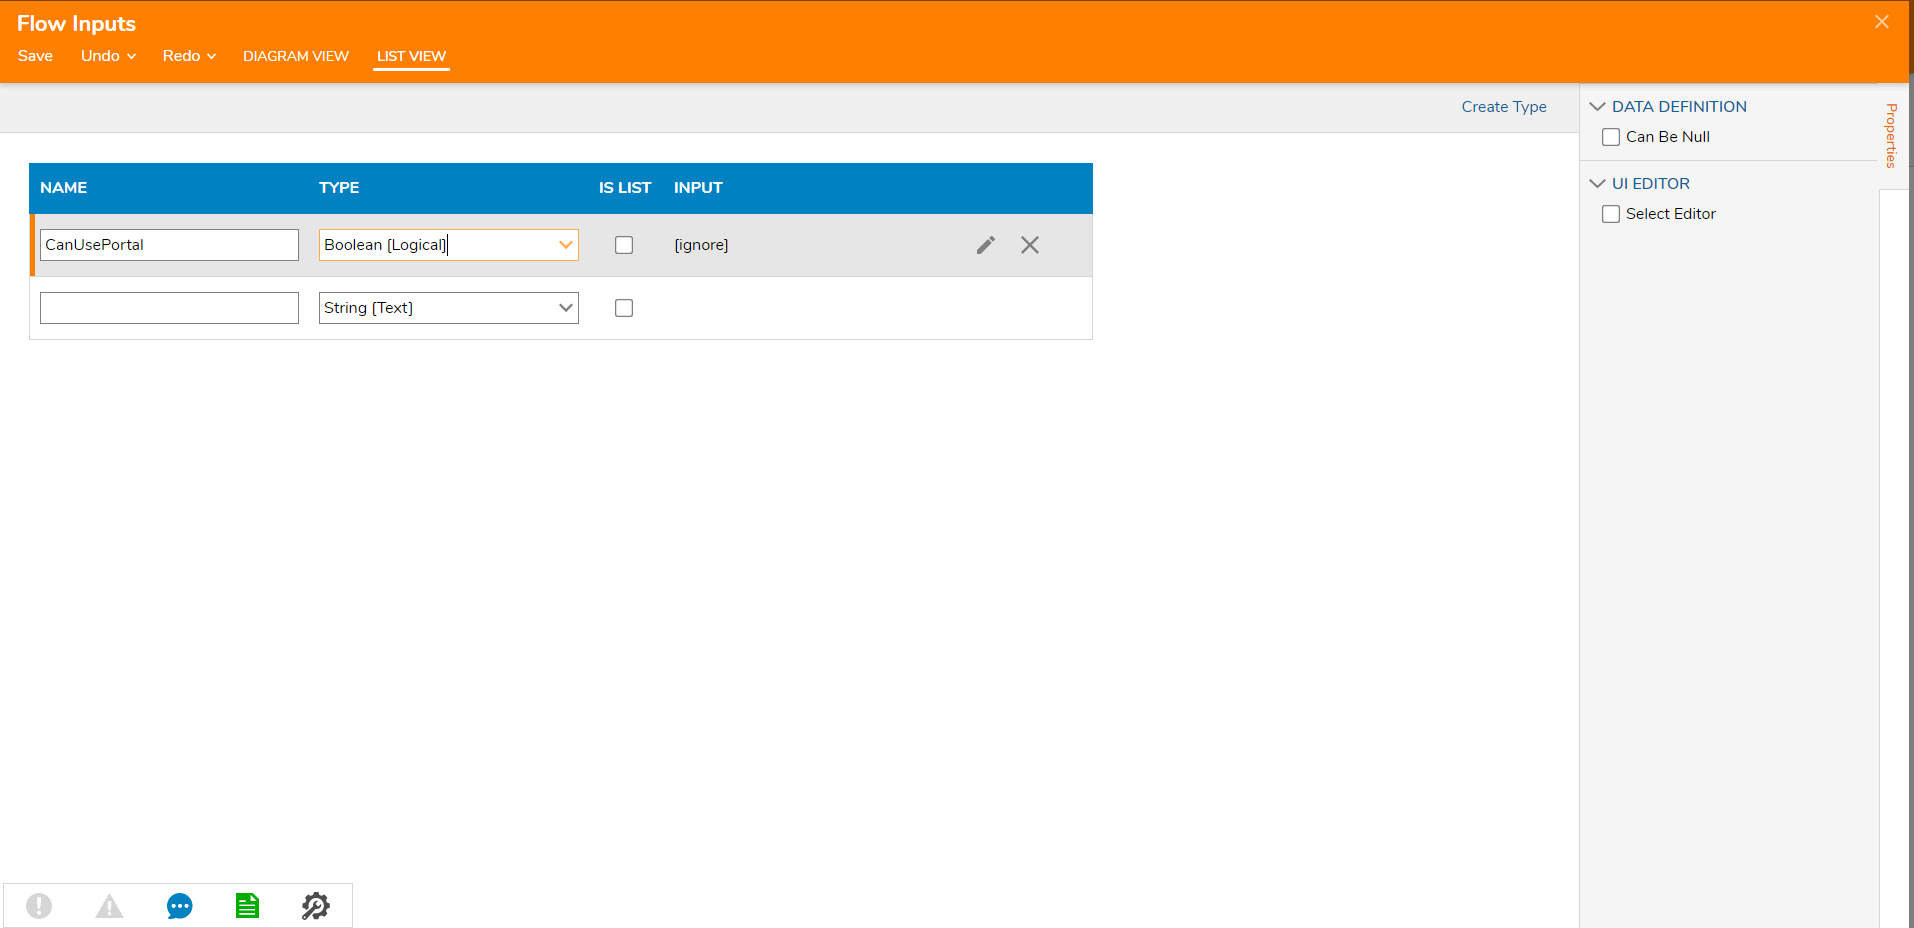
- In the Flow Designer, select the Start step and navigate to the Properties panel. Under Flow Data > Flow Input Data select 'Show Editor'. In the Data Definitions dialog, add "CanUsePortal" and choose Boolean as the Type, select 'Close'.
- Next, add Create Data step from the Favorite Steps category. On the Create Data step under Data Definitions, select 'Show Editor'.
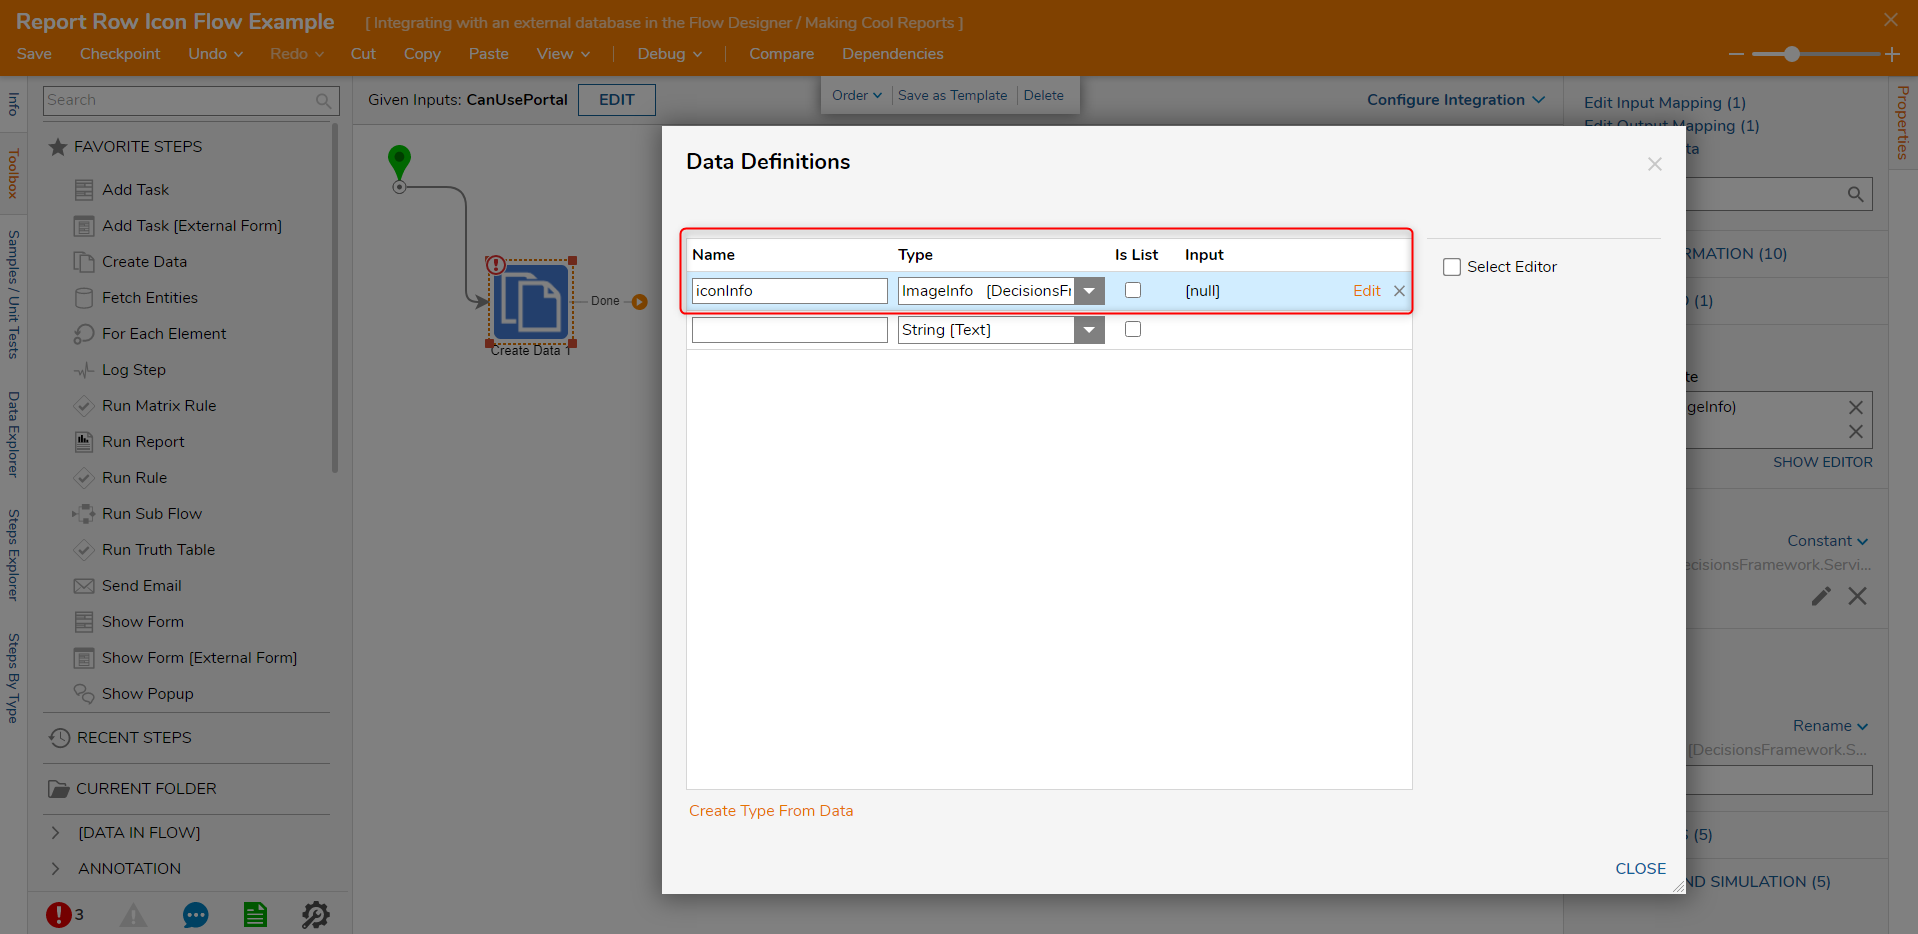
- In the resulting dialog, create the Icon data. Name the data "IconInfo" then in the Type drop-down menu search for and select the ImageInfo type.
- Next, add a Value Is True step by searching for 'Value Is True' in the steps toolbox.
- In the Properties panel under Inputs, select the Flow Input Data "CanUsePortal" for the Value.
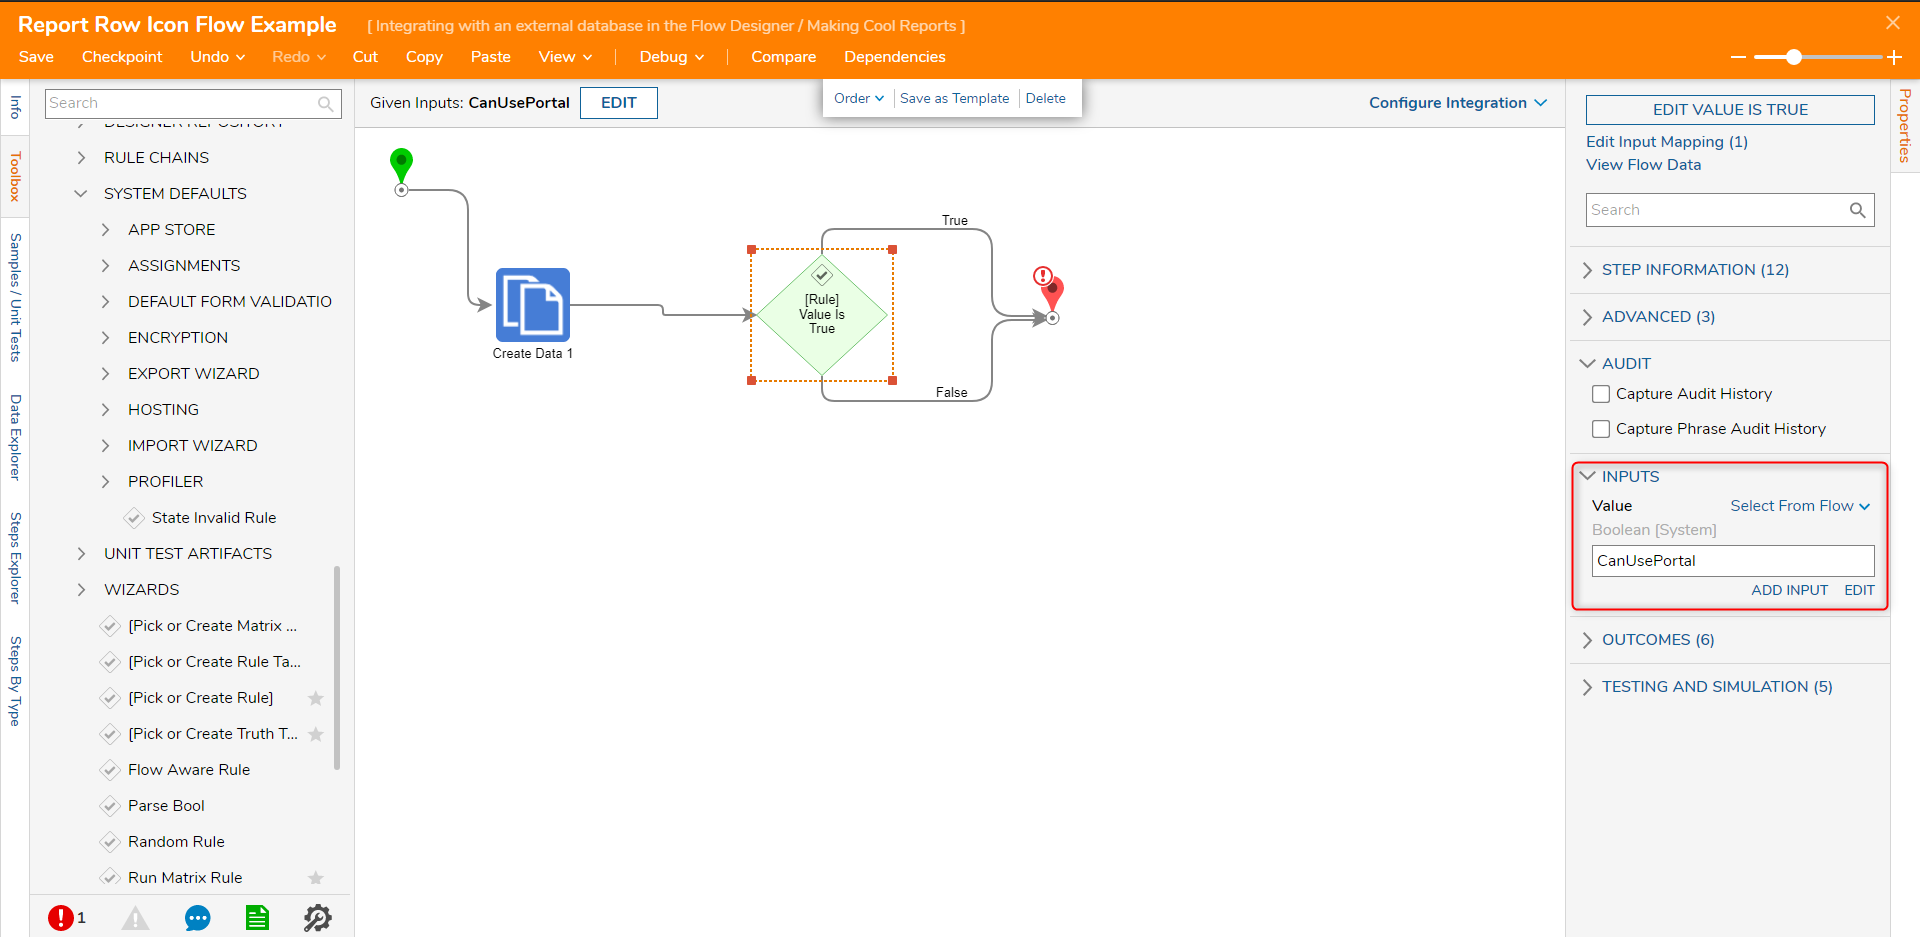
- On the True and False outcome from the Is Value Truestep, add two more 'Create Data' steps.
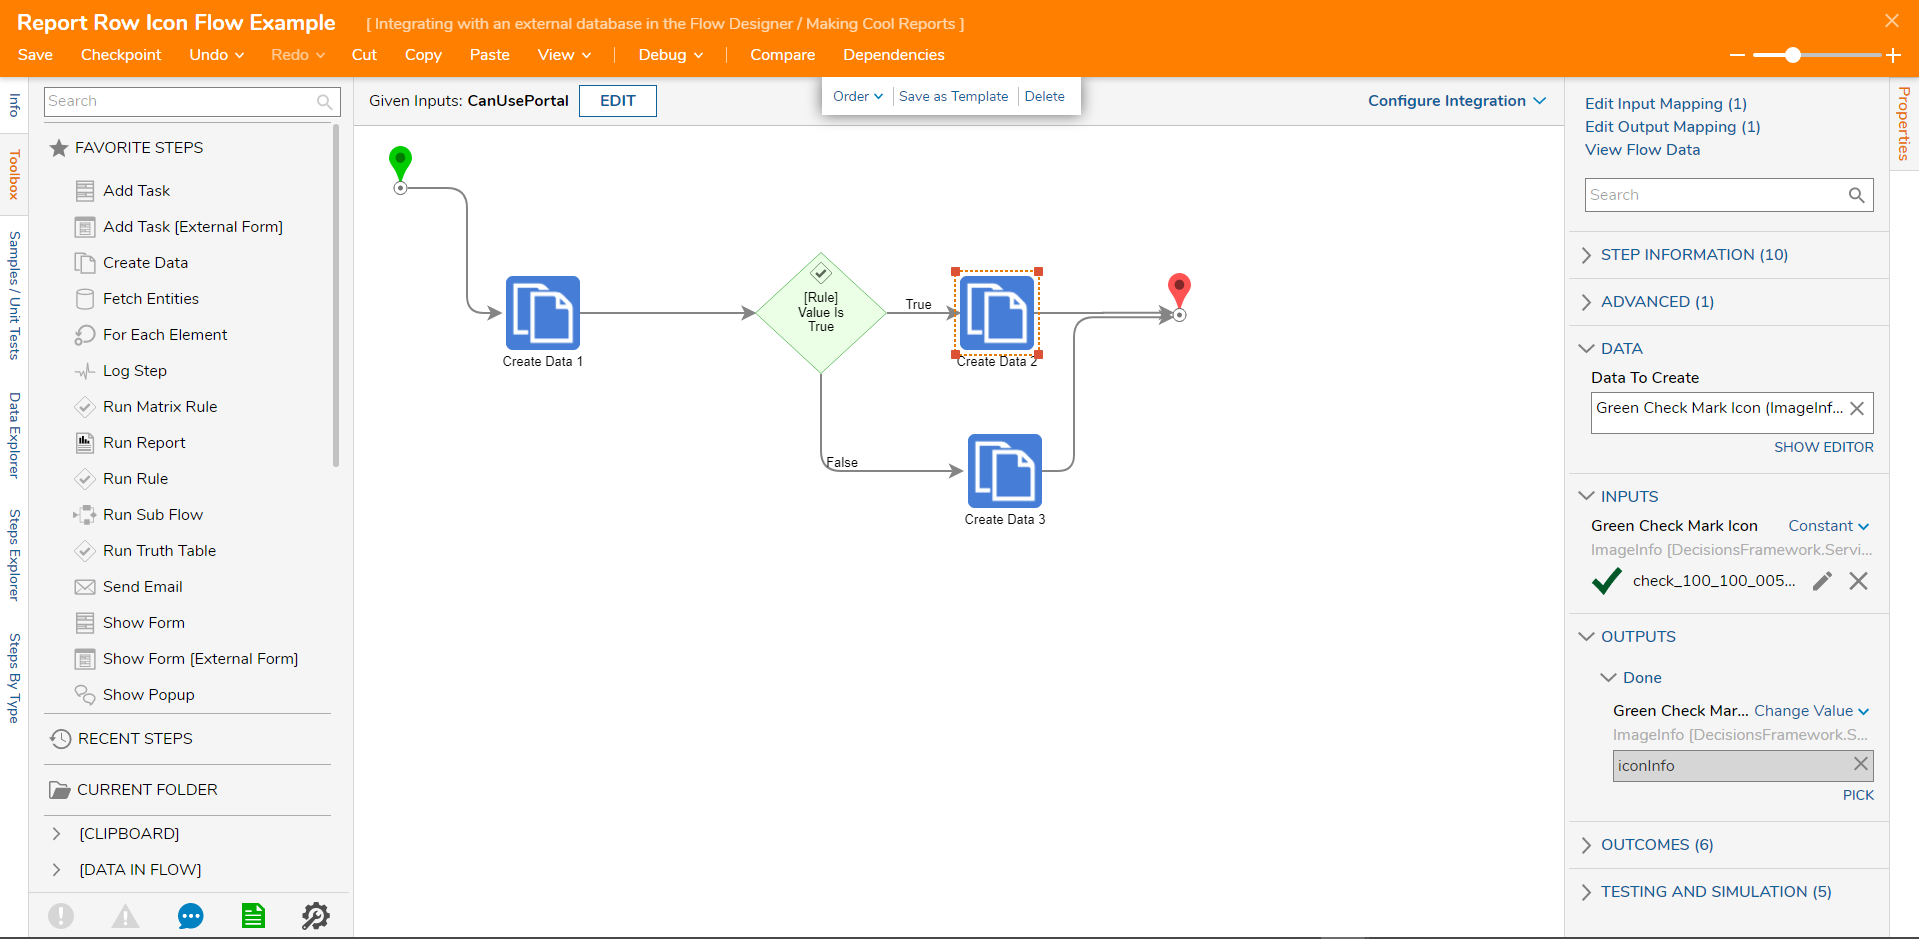
- On the True path Create Data step, declare a variable of the type 'ImageInfo'.
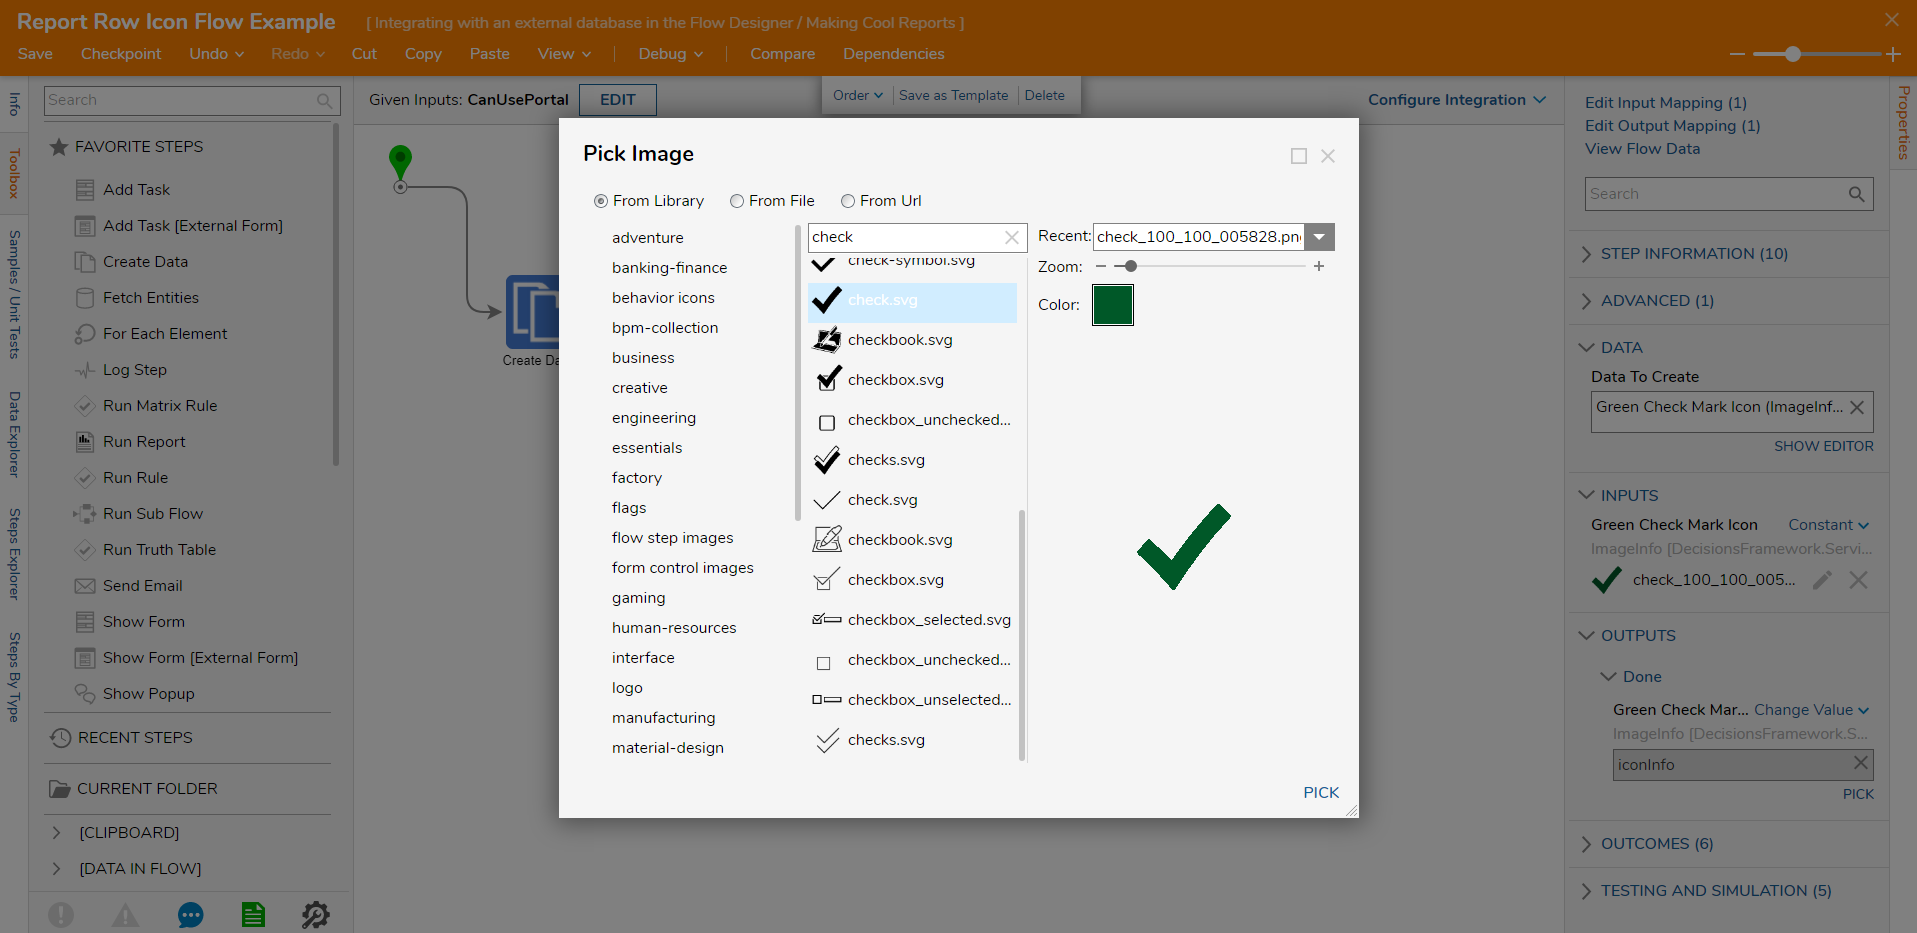
- Set the input to constant and pick an image. Perform the same steps on the create data step on the false path.
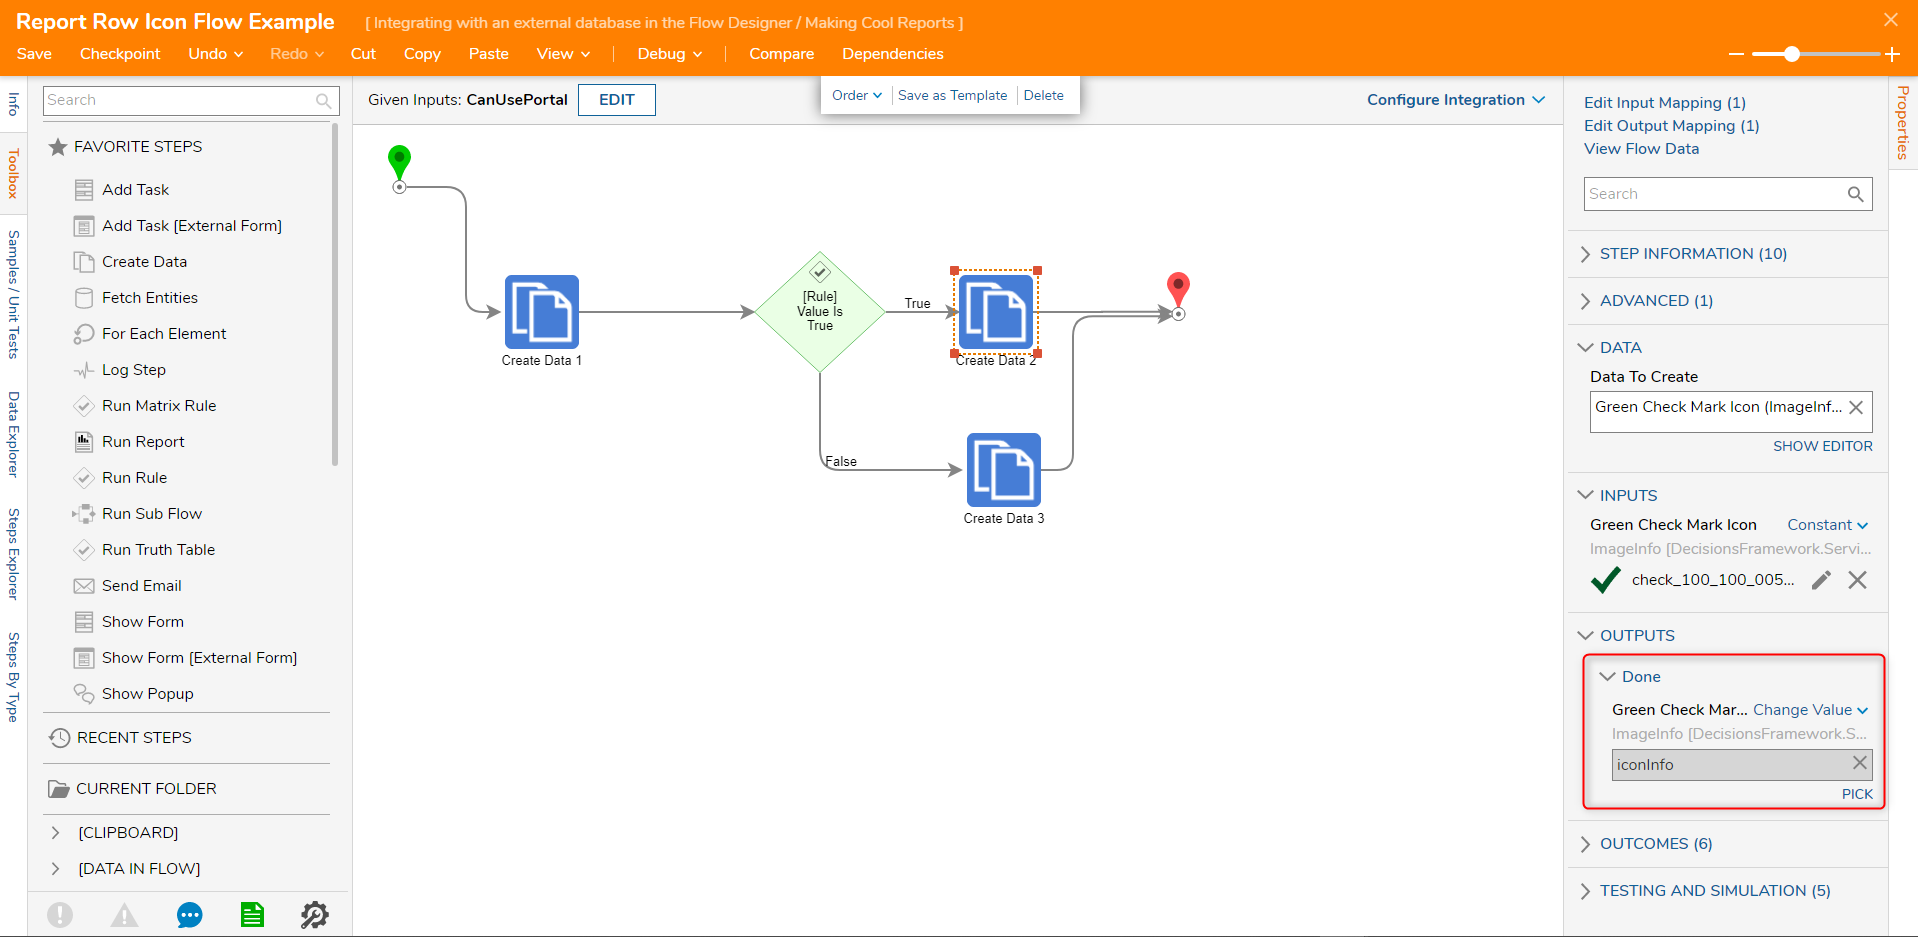
- On the output of both create data steps, set them to 'Change Value'. Map them to the icon info variable.
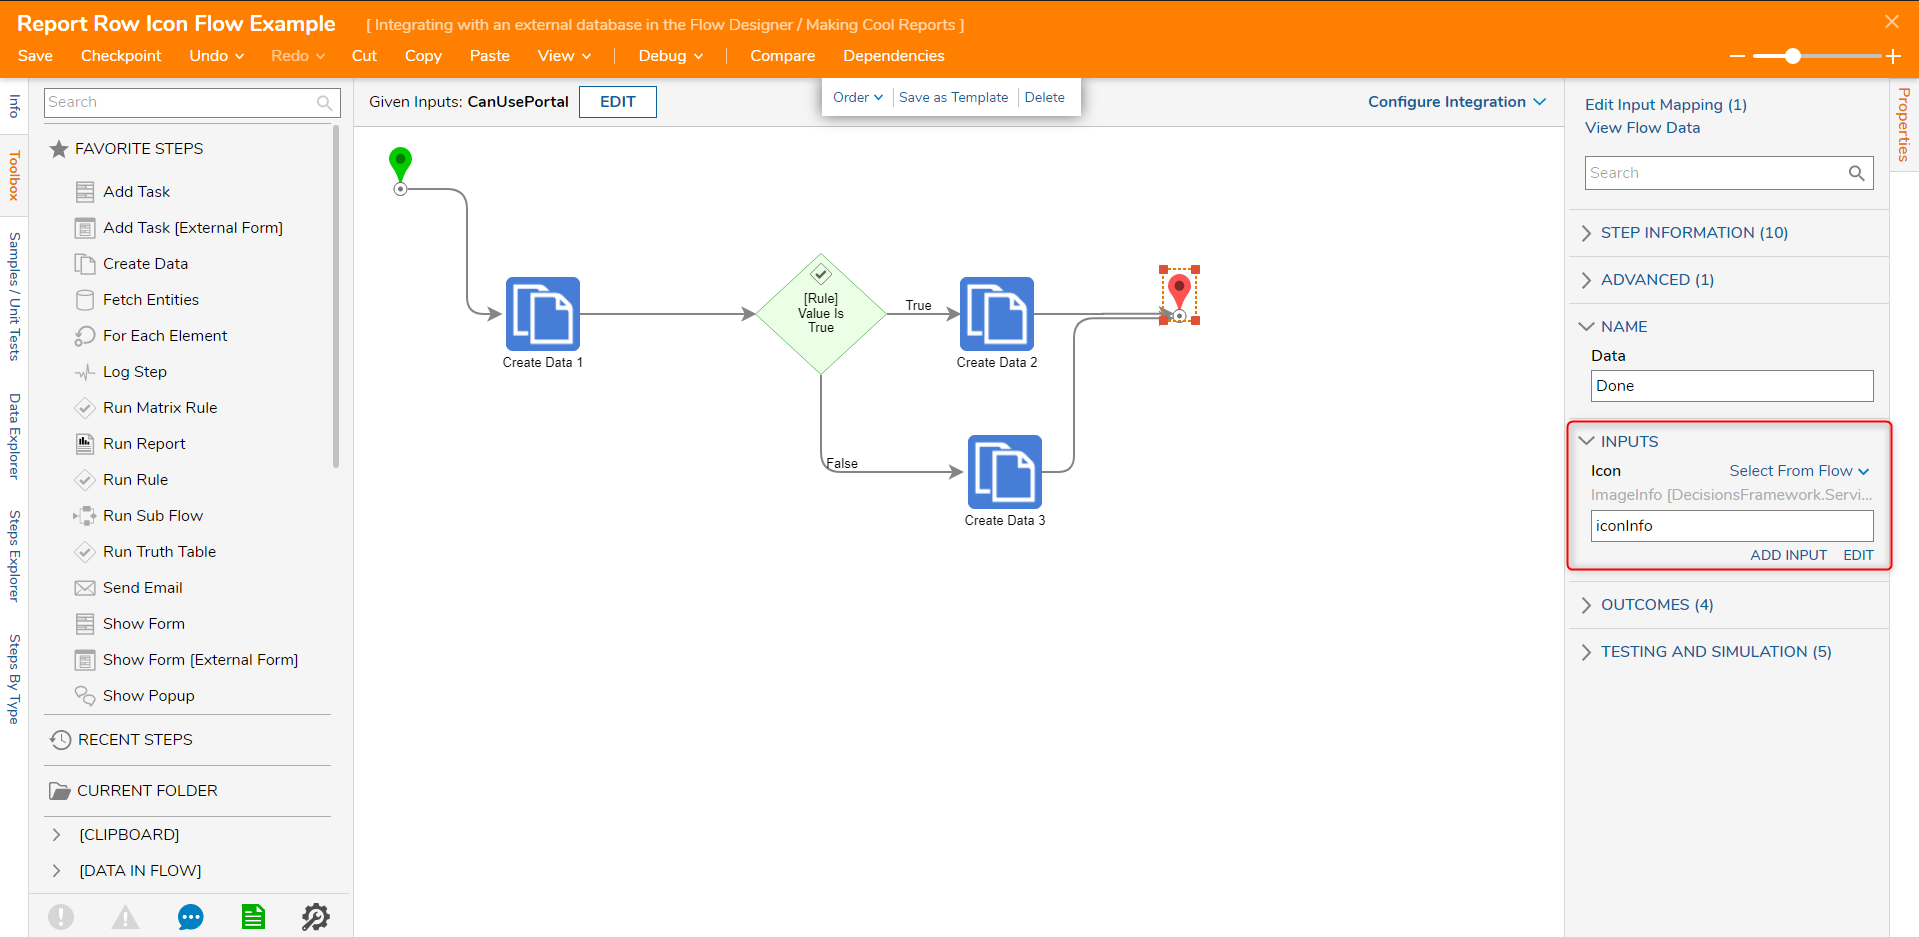
- On the End step, map the 'IconInfo' variable into the 'Icon' variable. Then 'Save' and 'Close' the Flow.
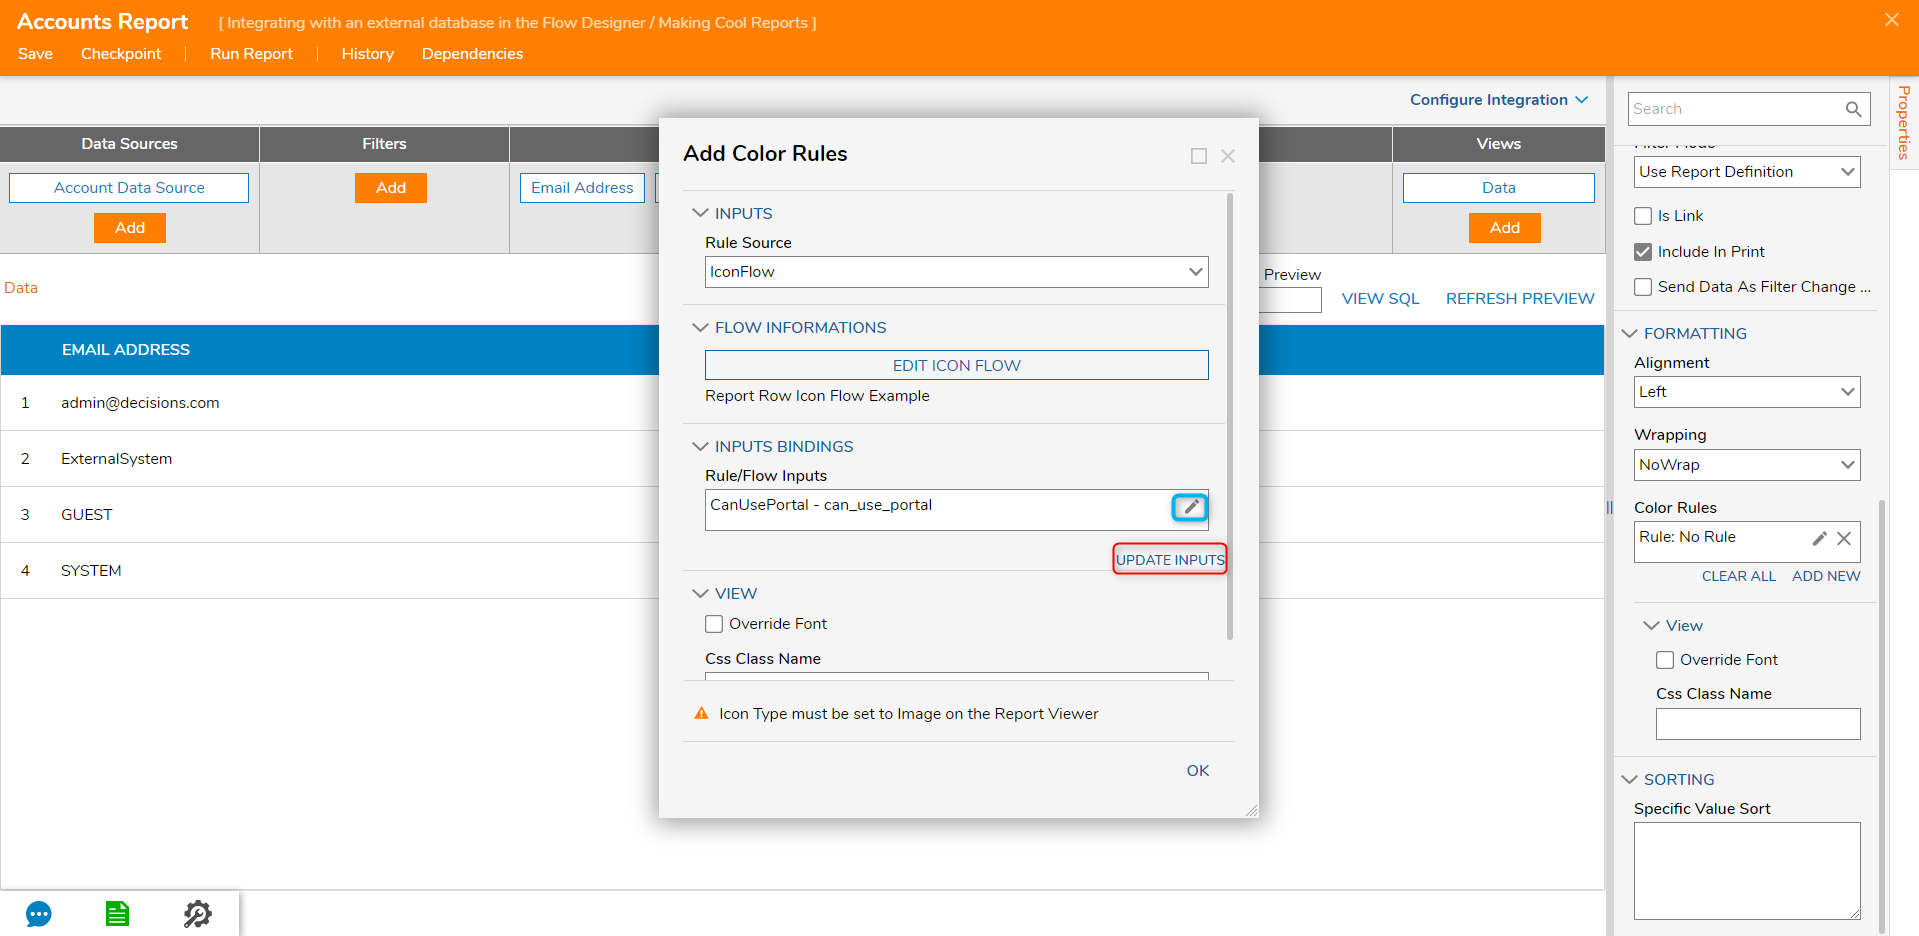
- Back in the Report Designer, in the Add Colors and Icon Rules dialog, select Update Inputs. This will populate the Flow/Rule Inputs Data Grid, select the pencil icon next to the CanUsePortal input.
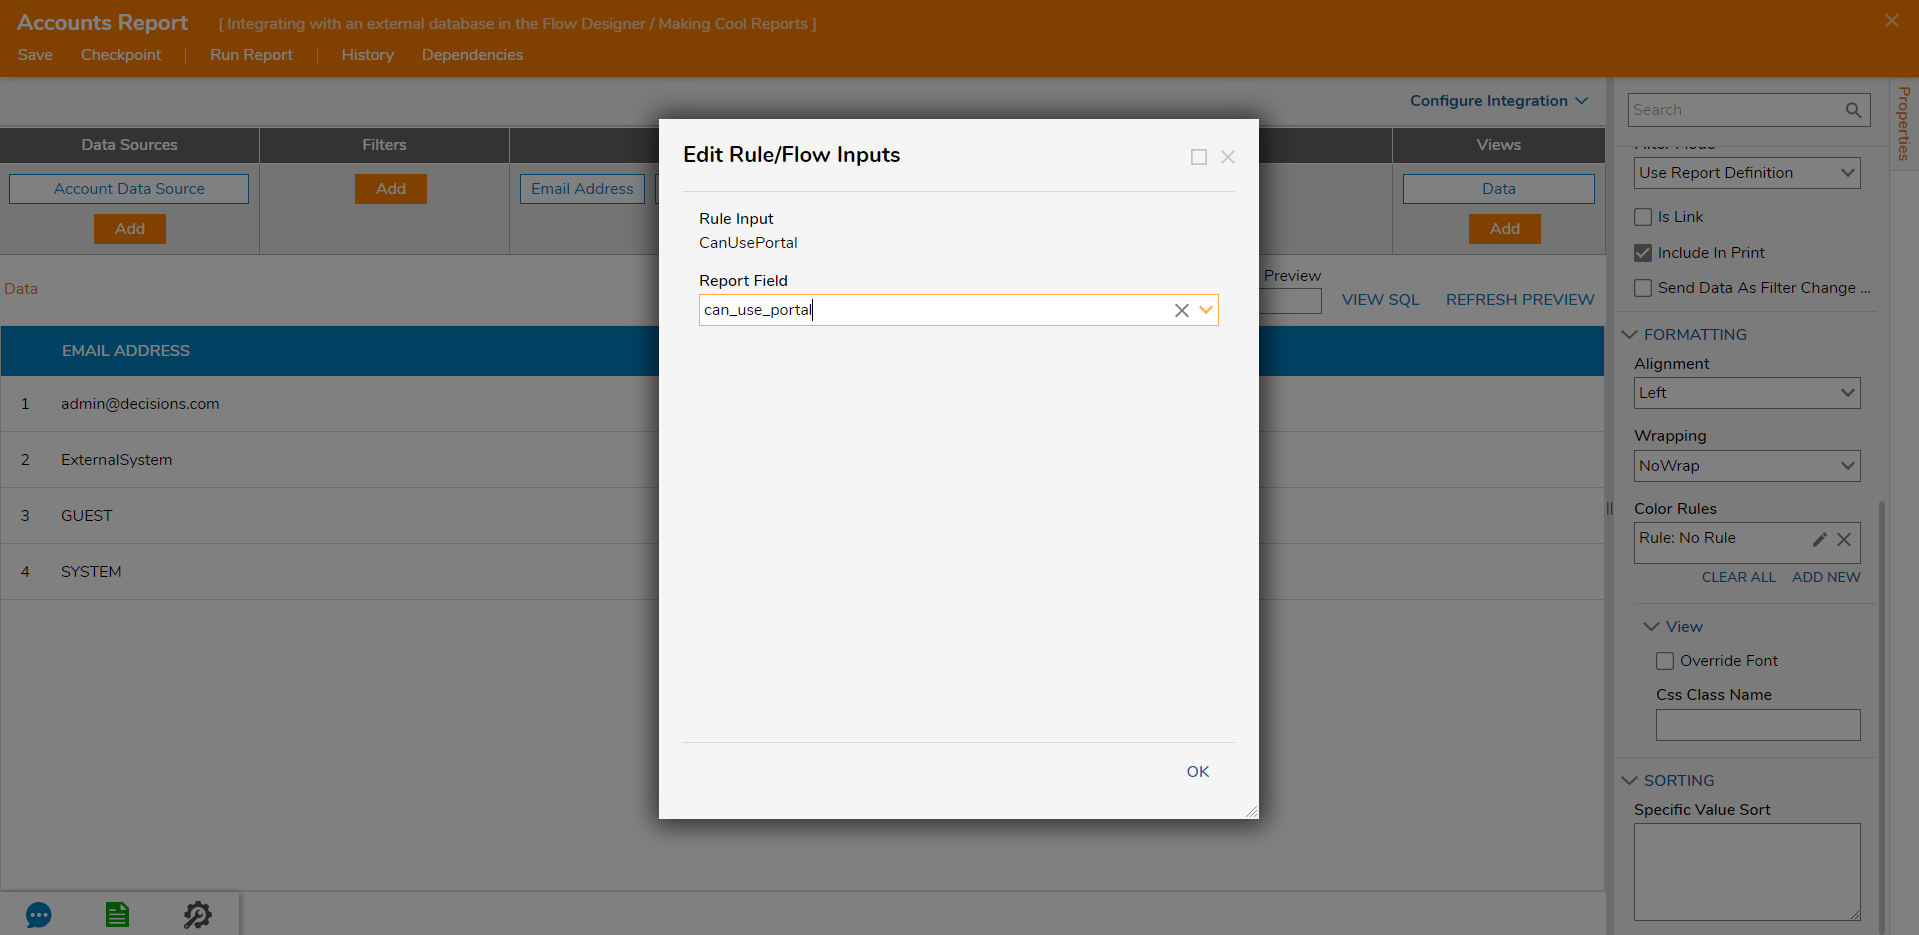
- In the resulting window, in the Report Field drop-down, choose can_use_portal and select OK.
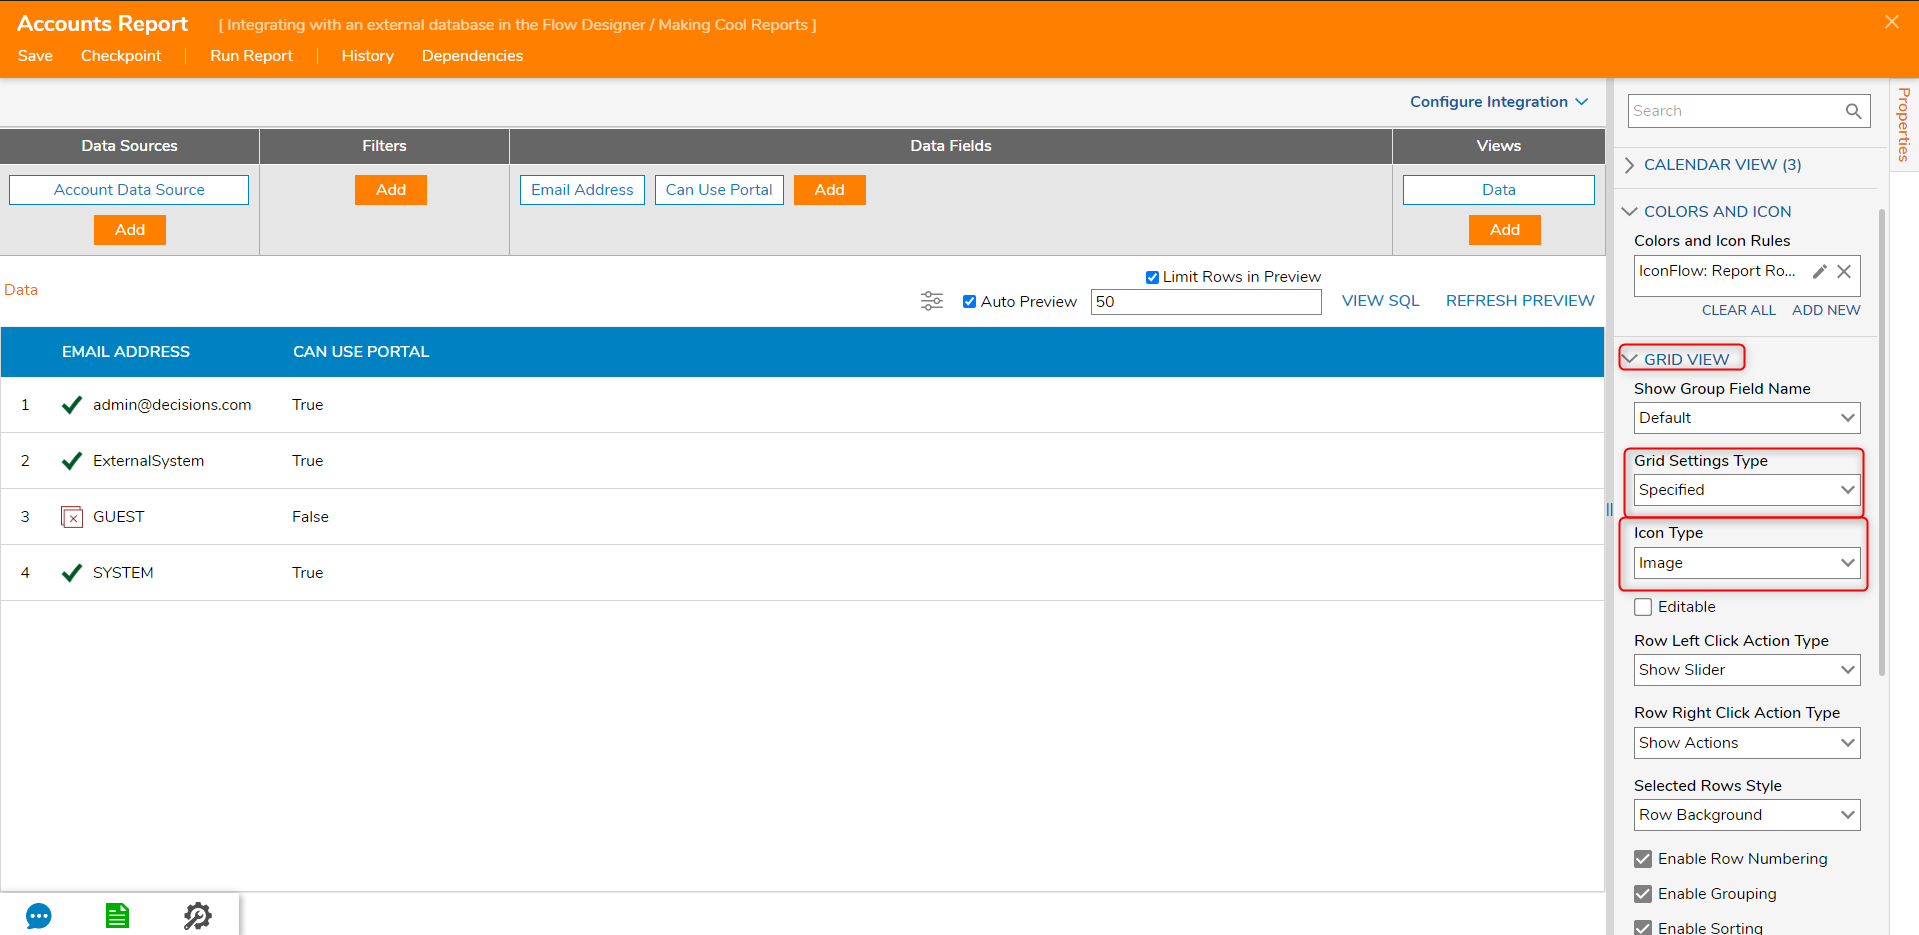
- Next, adjust the Report Grid View so the Icons will show up.
- Expand the Grid View section in the Properties panel.
- In the Grid Type drop-down, select Specified. This selection will provide additional options for configuring the Grid Settings. Selecting Specified also automatically adjusts the columns to their specified width, this can be adjusted within each Data Field Properties panel.
- From the Icon Type drop-down, select Image.
- The Report displays Icons for accounts that can use the Portal.
